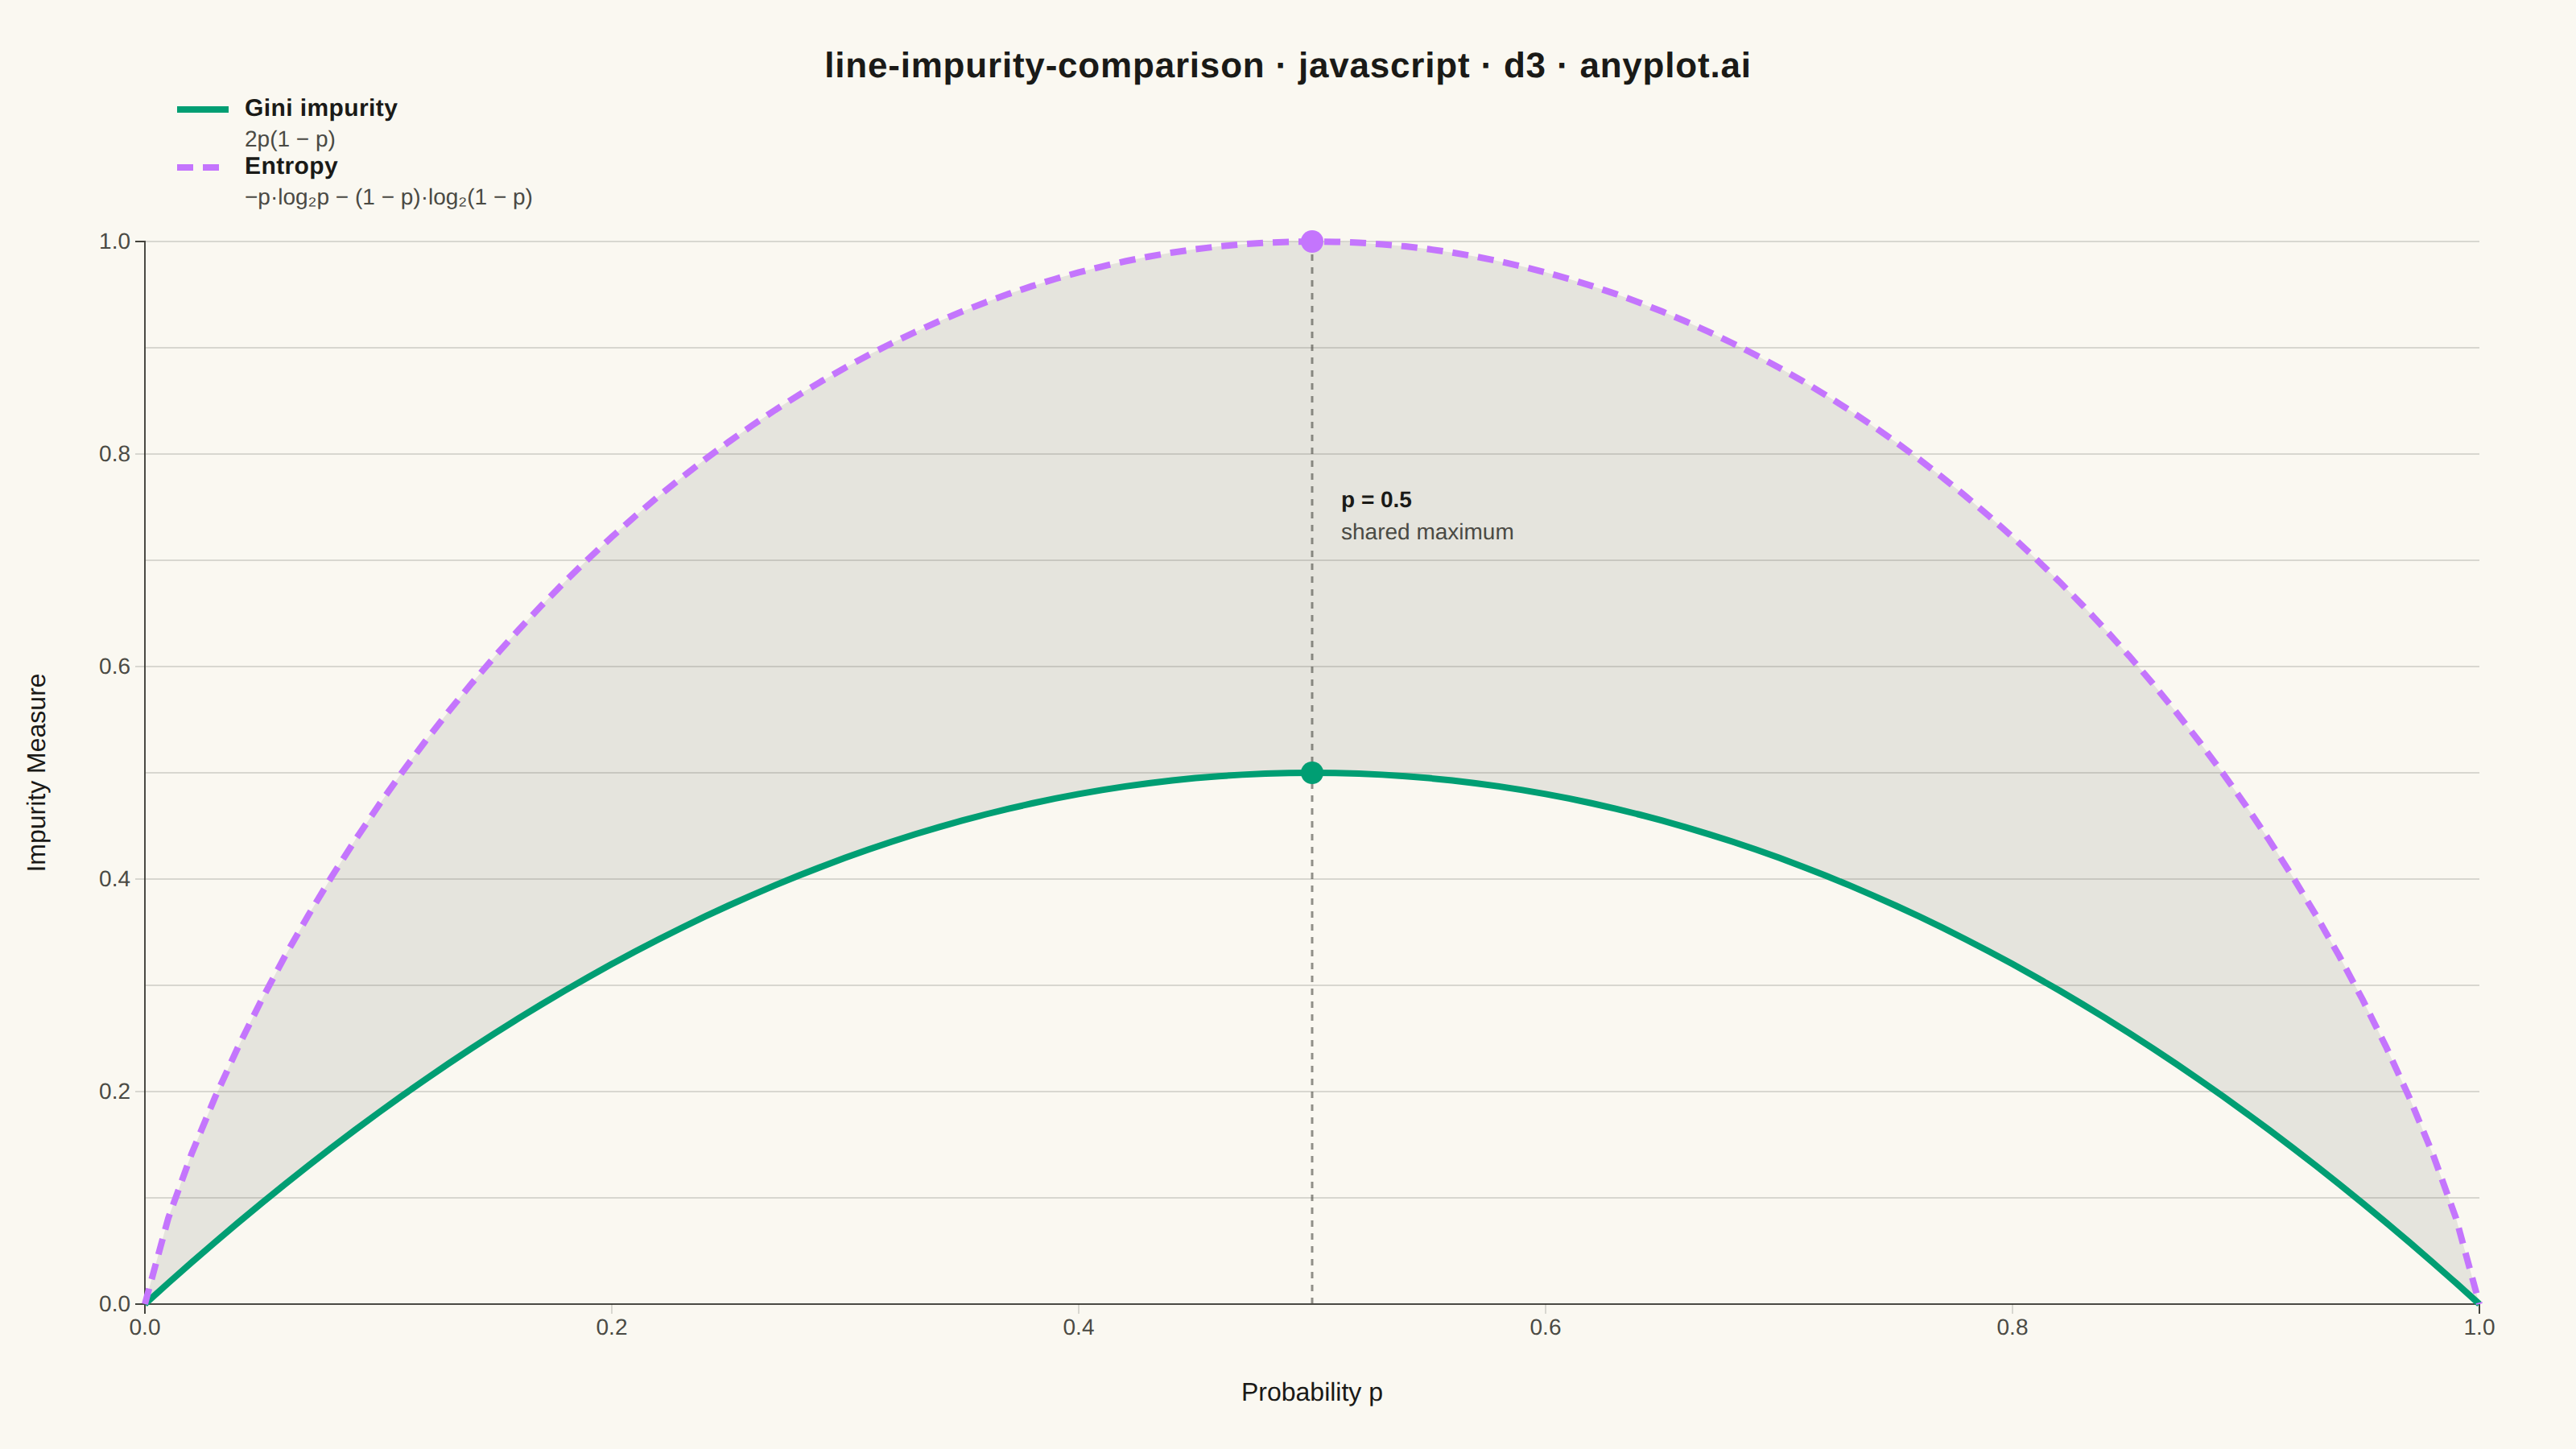
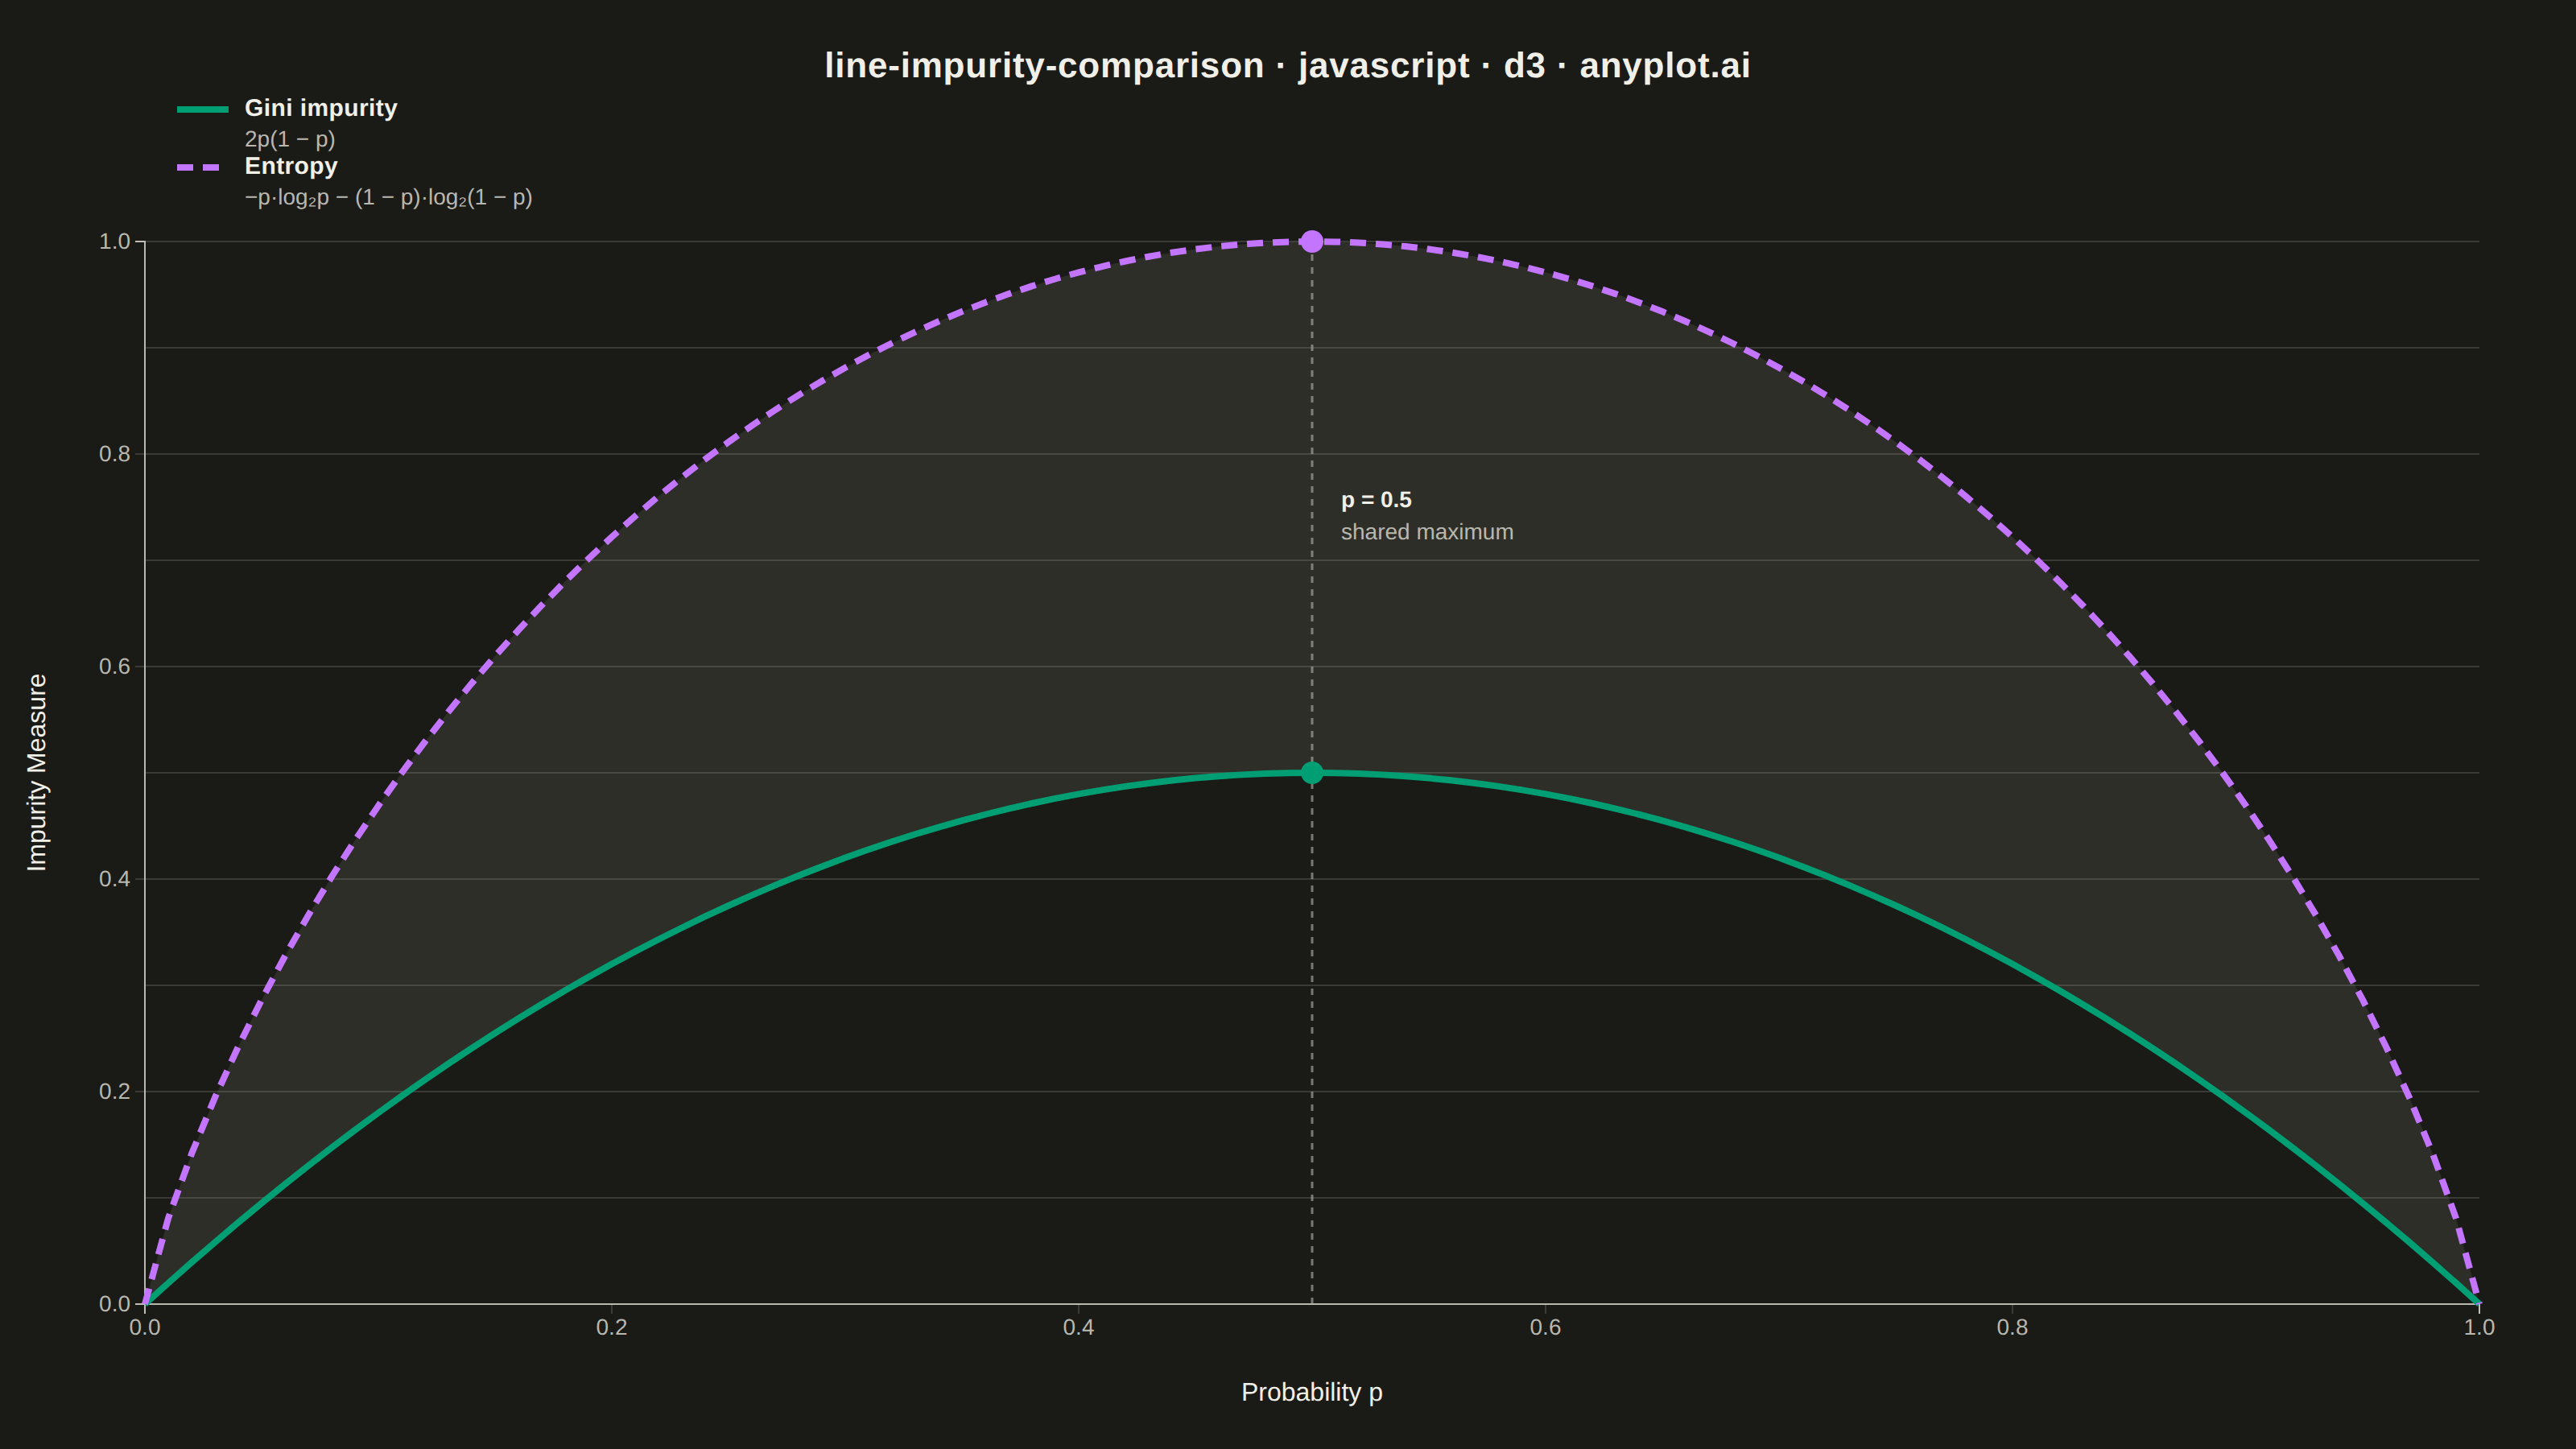
A theoretical comparison plot showing Gini impurity and entropy (information gain) as splitting criteria for decision trees across the probability range [0, 1]. Both curves are displayed on the same axes to illustrate their similar behavior and slight differences. This educational visualization helps understand the mathematical foundation of tree-based algorithms and why both criteria lead to similar tree structures in practice.
Preview render from the D3.js implementation.