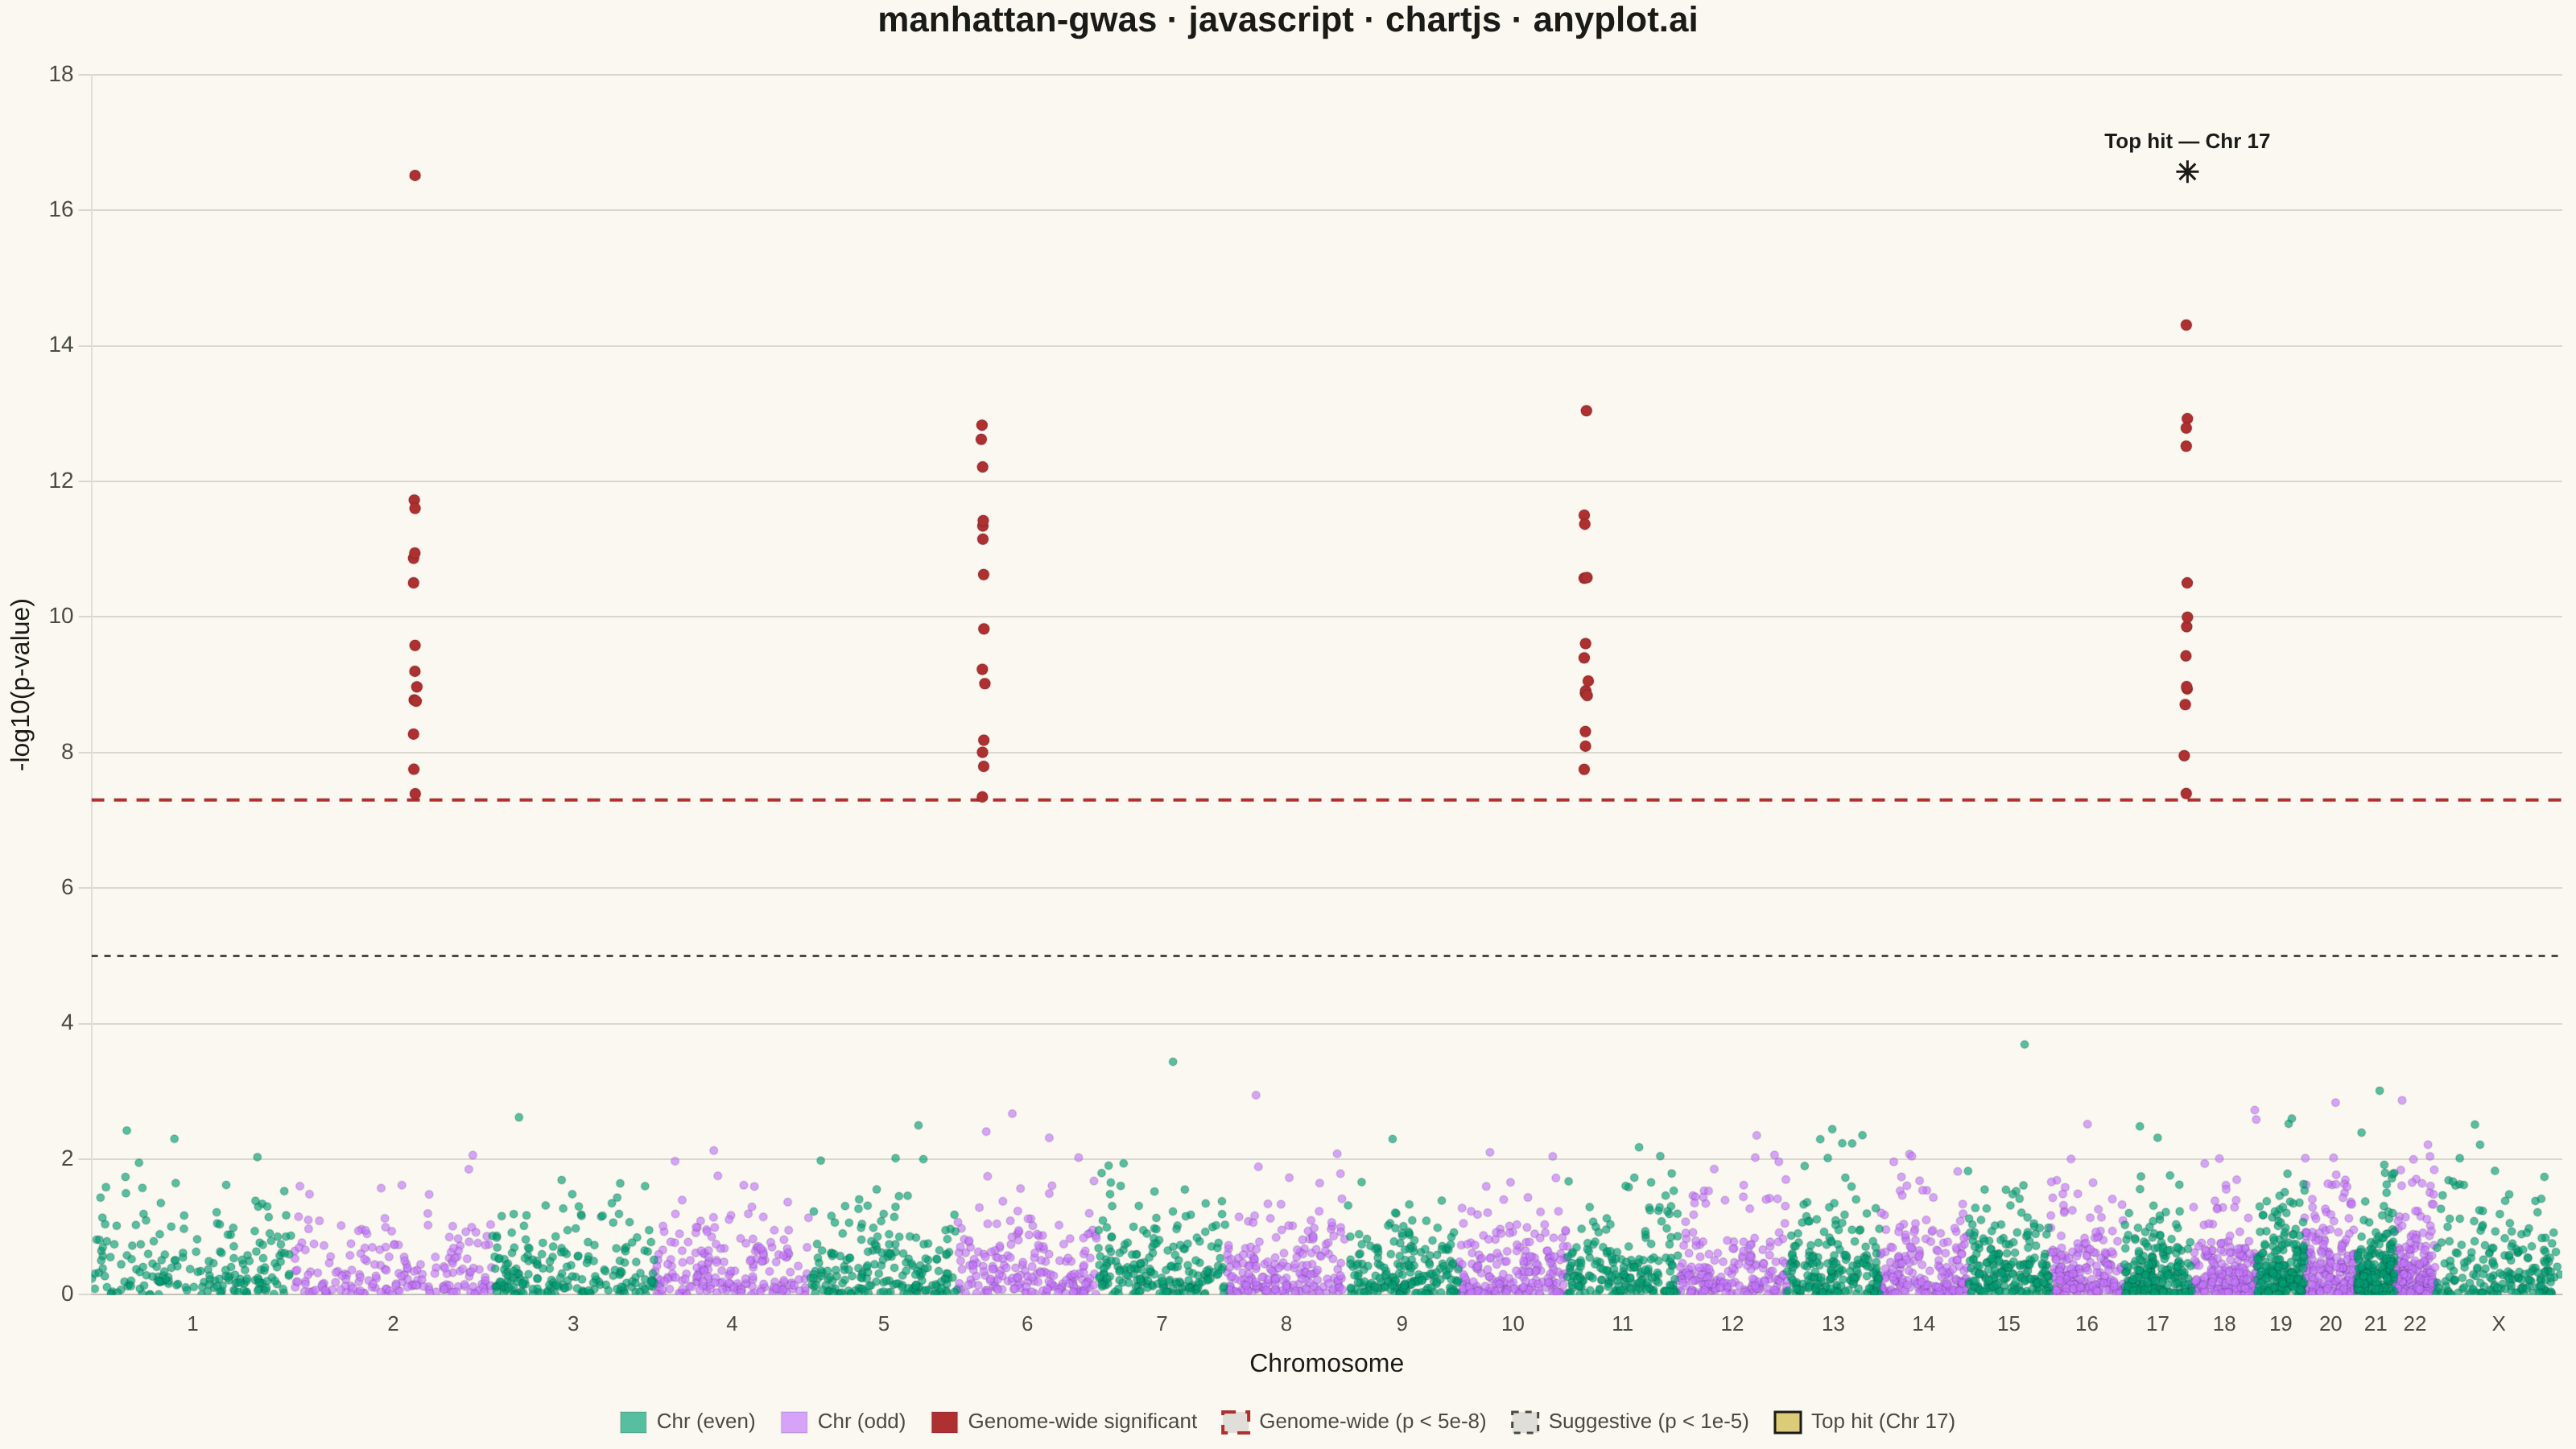
The same plot in 14 other libraries — JavaScript: D3.js, Apache ECharts, Highcharts, MUI X Charts; Python: Altair, Bokeh, lets-plot, Matplotlib, Plotly, plotnine, Pygal, Seaborn; R: ggplot2; Julia: Makie.jl. Compare all 15 side by side: Manhattan Plot for GWAS in Python, R, Julia and JavaScript.
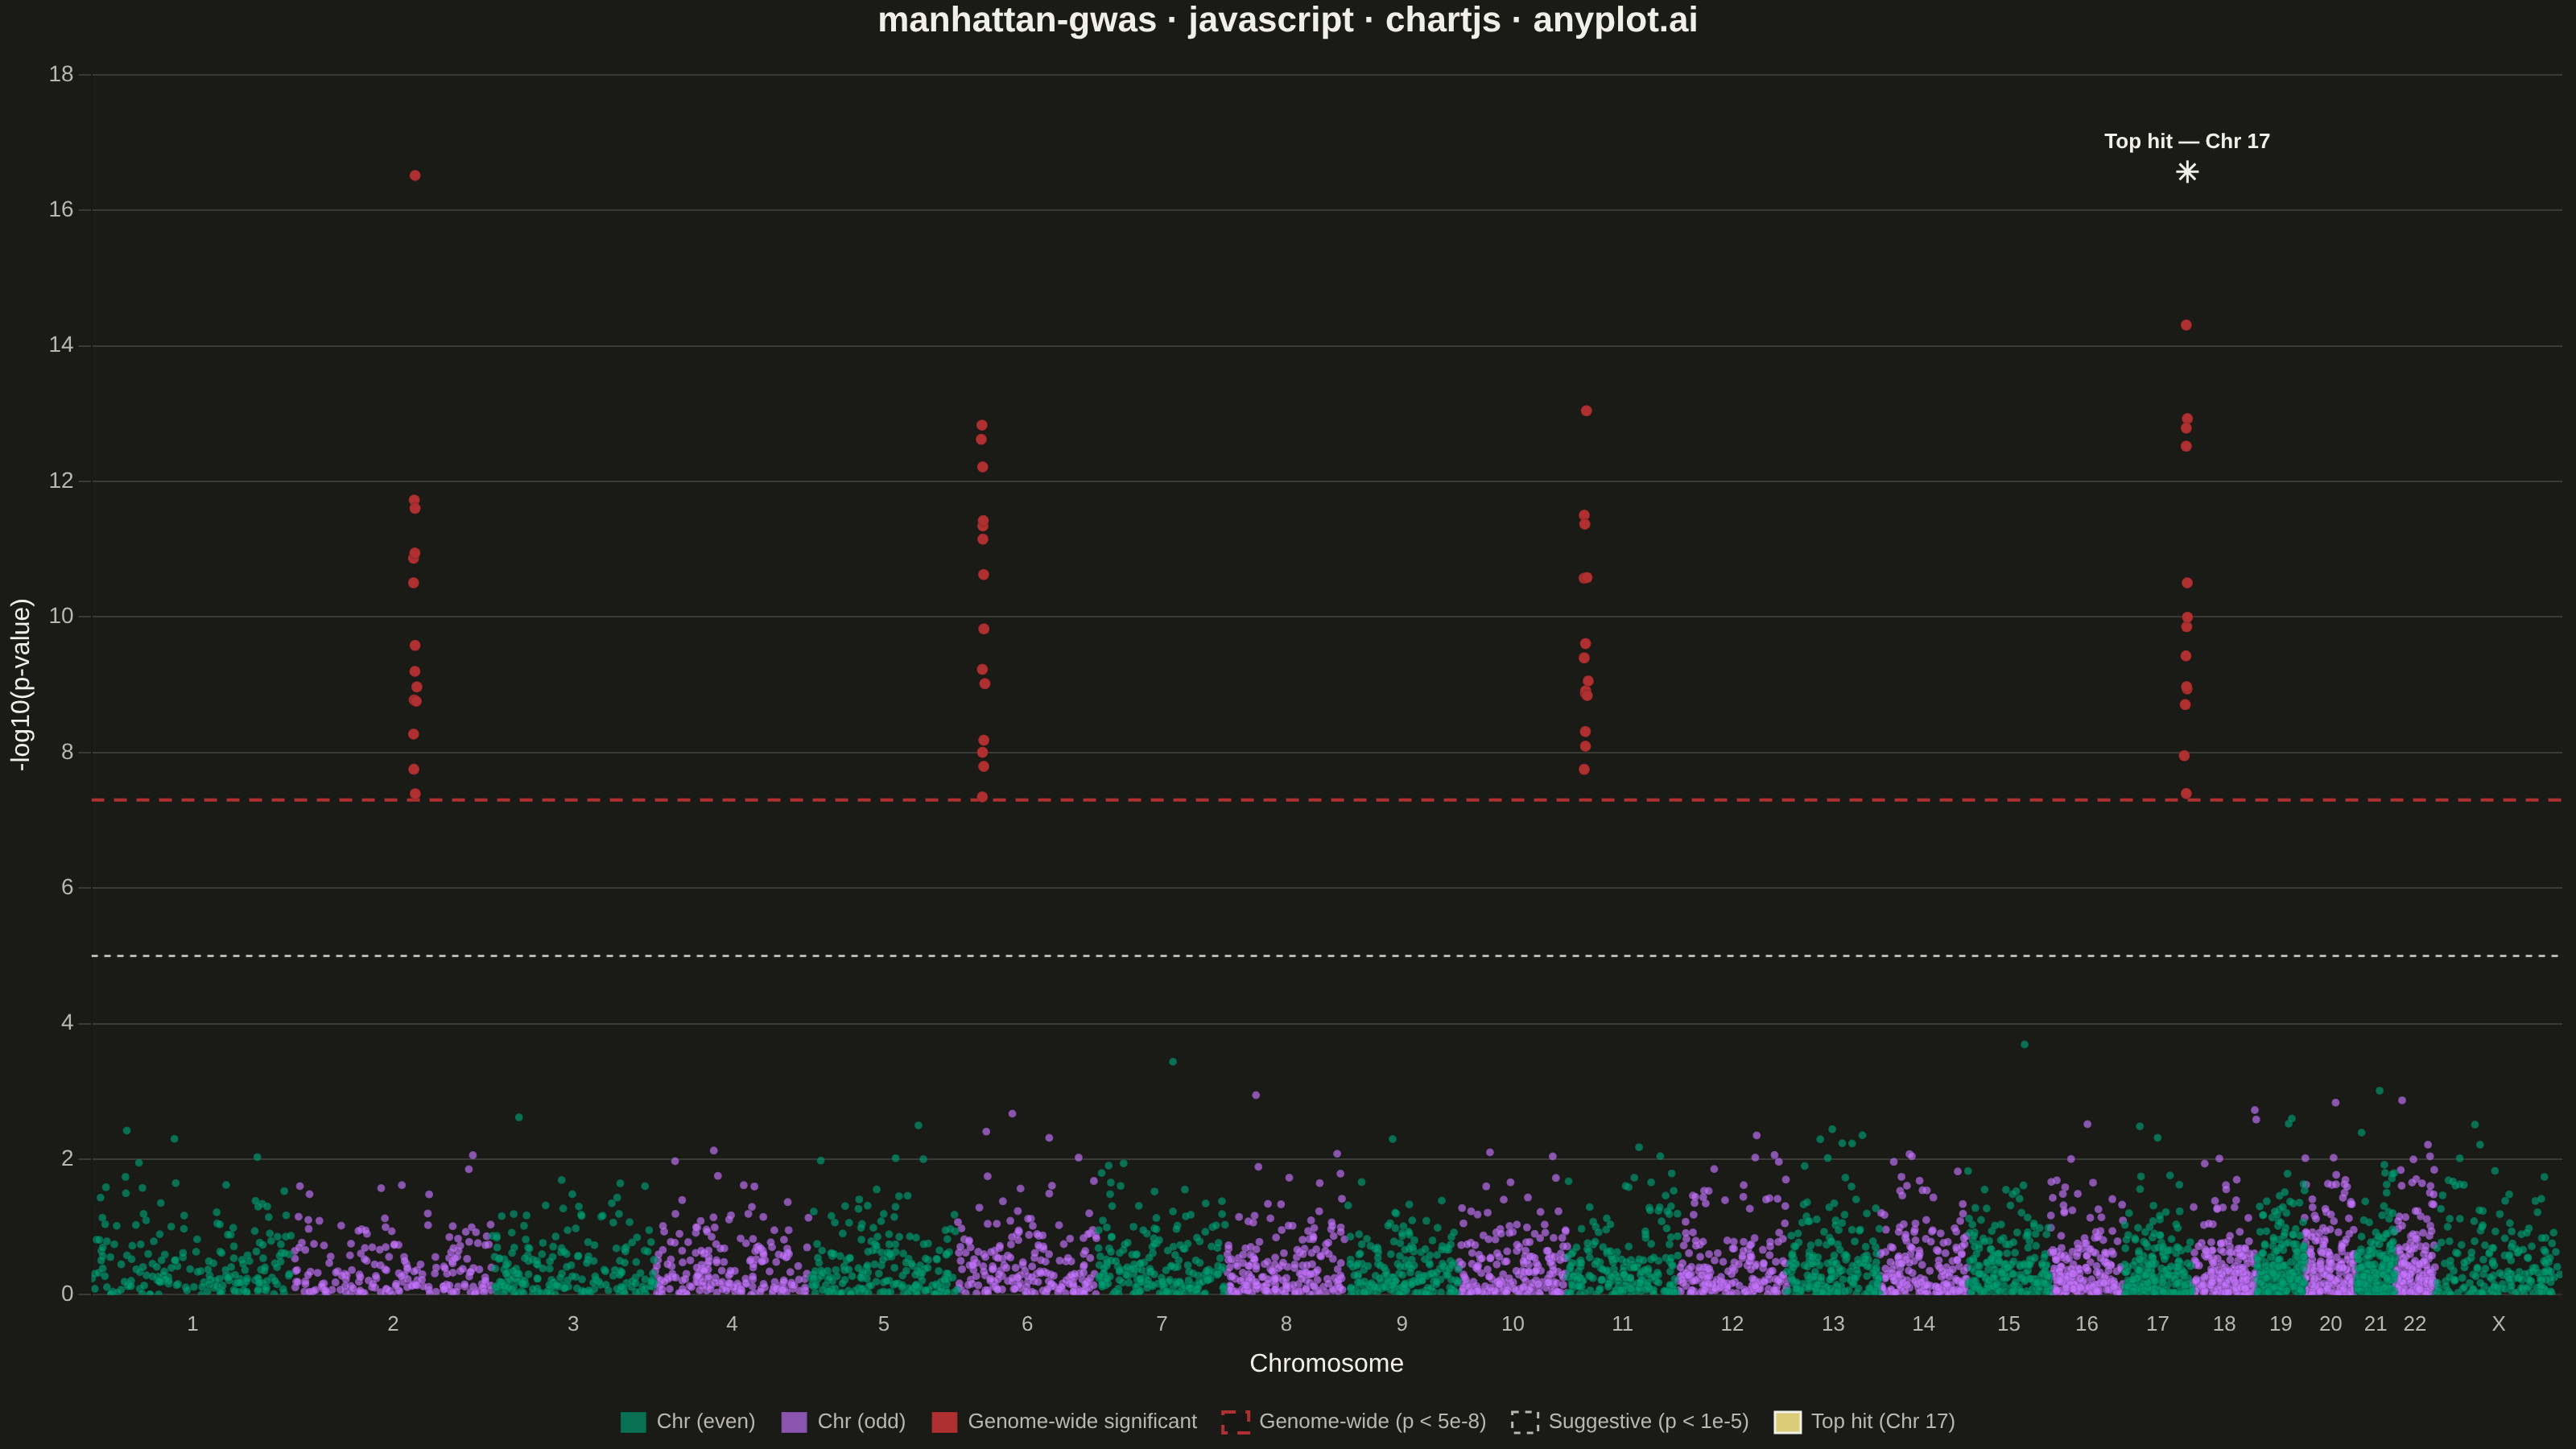
A Manhattan plot visualizes genome-wide association study (GWAS) results by displaying -log10 transformed p-values across chromosomal positions. Points are arranged by genomic position along the x-axis with alternating colors for each chromosome, making it easy to identify significant associations. A horizontal threshold line indicates genome-wide significance (typically p < 5×10⁻⁸). This plot is essential for identifying genetic variants associated with traits or diseases.
// anyplot.ai
// manhattan-gwas: Manhattan Plot for GWAS
// Library: chartjs 4.4.7 | JavaScript 22.23.2
// Quality: 95/100 | Created: 2026-09-05

//# anyplot-orientation: landscape
const t = window.ANYPLOT_TOKENS;

// --- Deterministic PRNG (LCG + Box-Muller) ----------------------------------
let seed = 42;
function rand() {
  seed = (seed * 1103515245 + 12345) & 0x7fffffff;
  return seed / 0x7fffffff;
}
function randNormal() {
  const u1 = Math.max(rand(), 1e-12);
  const u2 = rand();
  return Math.sqrt(-2 * Math.log(u1)) * Math.cos(2 * Math.PI * u2);
}
function hexToRgba(hex, alpha) {
  const n = parseInt(hex.replace("#", ""), 16);
  return `rgba(${(n >> 16) & 255}, ${(n >> 8) & 255}, ${n & 255}, ${alpha})`;
}

// --- Data: simulated GWAS summary statistics --------------------------------
// Approximate human chromosome lengths (Mb), 1-22 + X. Points-per-chromosome is
// a representative subsample (not the full 100k-1M variants) so the scatter
// stays legible and renders quickly.
const CHROM_LENGTHS_MB = [
  248, 242, 198, 190, 181, 170, 159, 145, 138, 133, 135, 133, 114, 107, 101,
  90, 83, 80, 58, 64, 46, 50, 155,
];
const CHROM_LABELS = [...Array(22).keys()].map((i) => String(i + 1)).concat("X");
const POINTS_PER_CHROM = 200;
const GENOME_WIDE = -Math.log10(5e-8); // ~7.301
const SUGGESTIVE = -Math.log10(1e-5); // 5

const chromRanges = [];
const points = [];
let cumOffset = 0;
CHROM_LABELS.forEach((label, i) => {
  const lengthMb = CHROM_LENGTHS_MB[i];
  const start = cumOffset;
  for (let j = 0; j < POINTS_PER_CHROM; j++) {
    const cumPos = start + rand() * lengthMb;
    const negLog10p = -Math.log10(Math.max(rand(), 1e-12));
    points.push({ x: cumPos, y: negLog10p, chromIndex: i });
  }
  chromRanges.push({ label, start, end: start + lengthMb, mid: start + lengthMb / 2 });
  cumOffset += lengthMb;
});

// Inject a handful of significant association peaks on selected chromosomes.
const peakChromLabels = ["2", "6", "11", "17"];
peakChromLabels.forEach((label) => {
  const range = chromRanges.find((r) => r.label === label);
  const chromIndex = CHROM_LABELS.indexOf(label);
  const peakCenter = range.start + rand() * (range.end - range.start);
  for (let k = 0; k < 14; k++) {
    const cumPos = Math.min(Math.max(peakCenter + randNormal() * 1.4, range.start), range.end);
    const negLog10p = GENOME_WIDE + Math.abs(randNormal()) * 3 + (k === 0 ? 2.5 : 0);
    points.push({ x: cumPos, y: negLog10p, chromIndex });
  }
});

// Split by chromosome parity (alternating color bands) and significance.
const evenChromPoints = [];
const oddChromPoints = [];
const significantPoints = [];
points.forEach((p) => {
  if (p.y >= GENOME_WIDE) {
    significantPoints.push({ x: p.x, y: p.y, chromIndex: p.chromIndex });
  } else if (p.chromIndex % 2 === 0) {
    evenChromPoints.push({ x: p.x, y: p.y });
  } else {
    oddChromPoints.push({ x: p.x, y: p.y });
  }
});

// Single strongest association becomes a labeled focal point.
const topHit = significantPoints.reduce((best, p) => (p.y > best.y ? p : best));
const topHitLabel = chromRanges[topHit.chromIndex].label;
const restSignificant = significantPoints.filter((p) => p !== topHit);

const genomeLength = cumOffset;

// --- Mount -------------------------------------------------------------------
const canvas = document.createElement("canvas");
document.getElementById("container").appendChild(canvas);

// Draws a text callout next to the top-hit marker, clamped inside the plot area.
const topHitLabelPlugin = {
  id: "topHitLabel",
  afterDatasetsDraw(chart) {
    const { ctx, chartArea, scales } = chart;
    const text = `Top hit — Chr ${topHitLabel}`;
    ctx.save();
    ctx.font = "bold 13px sans-serif";
    ctx.fillStyle = t.ink;
    ctx.textAlign = "center";
    ctx.textBaseline = "middle";
    const halfWidth = ctx.measureText(text).width / 2 + 4;
    const rawX = scales.x.getPixelForValue(topHit.x);
    const px = Math.min(Math.max(rawX, chartArea.left + halfWidth), chartArea.right - halfWidth);
    const py = scales.y.getPixelForValue(topHit.y);
    const labelY = py - 18 >= chartArea.top + 10 ? py - 18 : py + 22;
    ctx.fillText(text, px, labelY);
    ctx.restore();
  },
};

// --- Chart ---------------------------------------------------------------
new Chart(canvas, {
  type: "scatter",
  data: {
    datasets: [
      {
        label: "Chr (even)",
        data: evenChromPoints,
        backgroundColor: hexToRgba(t.palette[0], 0.65),
        pointRadius: 2.5,
        pointHoverRadius: 2.5,
      },
      {
        label: "Chr (odd)",
        data: oddChromPoints,
        backgroundColor: hexToRgba(t.palette[1], 0.65),
        pointRadius: 2.5,
        pointHoverRadius: 2.5,
      },
      {
        label: "Genome-wide significant",
        data: restSignificant,
        backgroundColor: t.palette[4],
        pointRadius: 3.5,
        pointHoverRadius: 3.5,
      },
      {
        type: "line",
        label: "Genome-wide (p < 5e-8)",
        data: [
          { x: 0, y: GENOME_WIDE },
          { x: genomeLength, y: GENOME_WIDE },
        ],
        borderColor: t.palette[4],
        borderWidth: 2,
        borderDash: [8, 6],
        pointRadius: 0,
        fill: false,
      },
      {
        type: "line",
        label: "Suggestive (p < 1e-5)",
        data: [
          { x: 0, y: SUGGESTIVE },
          { x: genomeLength, y: SUGGESTIVE },
        ],
        borderColor: t.inkSoft,
        borderWidth: 1.5,
        borderDash: [4, 4],
        pointRadius: 0,
        fill: false,
      },
      {
        label: `Top hit (Chr ${topHitLabel})`,
        data: [{ x: topHit.x, y: topHit.y }],
        backgroundColor: t.amber,
        borderColor: t.ink,
        borderWidth: 1.5,
        pointRadius: 7,
        pointHoverRadius: 7,
        pointStyle: "star",
      },
    ],
  },
  options: {
    responsive: true,
    maintainAspectRatio: false,
    animation: false,
    plugins: {
      title: {
        display: true,
        text: "manhattan-gwas · javascript · chartjs · anyplot.ai",
        color: t.ink,
        font: { size: 22 },
        padding: { bottom: 20 },
      },
      legend: {
        display: true,
        position: "bottom",
        labels: { color: t.inkSoft, font: { size: 13 }, boxWidth: 16, padding: 16 },
      },
    },
    scales: {
      x: {
        type: "linear",
        min: 0,
        max: genomeLength,
        afterBuildTicks: (axis) => {
          axis.ticks = chromRanges.map((r) => ({ value: r.mid }));
        },
        ticks: {
          color: t.inkSoft,
          font: { size: 13 },
          callback: (value) => {
            const range = chromRanges.find((r) => r.mid === value);
            return range ? range.label : "";
          },
        },
        grid: { display: false },
        title: { display: true, text: "Chromosome", color: t.ink, font: { size: 16 } },
      },
      y: {
        min: 0,
        ticks: { color: t.inkSoft, font: { size: 14 } },
        grid: { color: t.grid },
        title: { display: true, text: "-log10(p-value)", color: t.ink, font: { size: 16 } },
      },
    },
  },
  plugins: [topHitLabelPlugin],
});
Runnable source as JSON, for any HTTP client: https://api.anyplot.ai/specs/manhattan-gwas/chartjs/code. Any spec id and library id listed in llms-full.txt fit the same URL shape; every URL below is complete and callable.
{
  "spec_id": "manhattan-gwas",
  "language": "javascript",
  "library": "chartjs",
  "page": "https://anyplot.ai/manhattan-gwas/javascript/chartjs",
  "hub": "https://anyplot.ai/manhattan-gwas",
  "code_json": "https://api.anyplot.ai/specs/manhattan-gwas/chartjs/code",
  "spec_json": "https://api.anyplot.ai/specs/manhattan-gwas",
  "render_light_png": "https://storage.googleapis.com/anyplot-images/plots/manhattan-gwas/javascript/chartjs/plot-light.png",
  "render_dark_png": "https://storage.googleapis.com/anyplot-images/plots/manhattan-gwas/javascript/chartjs/plot-dark.png",
  "interactive_light_html": "https://storage.googleapis.com/anyplot-images/plots/manhattan-gwas/javascript/chartjs/plot-light.html",
  "interactive_dark_html": "https://storage.googleapis.com/anyplot-images/plots/manhattan-gwas/javascript/chartjs/plot-dark.html",
  "quality_score": 95.0,
  "license": "MIT",
  "guide": "https://anyplot.ai/llms.txt"
}
Part of Manhattan Plot for GWAS on anyplot.ai.