The same plot in 14 other libraries — JavaScript: Chart.js, D3.js, Highcharts, MUI X Charts; Python: Altair, Bokeh, lets-plot, Matplotlib, Plotly, plotnine, Pygal, Seaborn; R: ggplot2; Julia: Makie.jl. Compare all 15 side by side: Manhattan Plot for GWAS in Python, R, Julia and JavaScript.
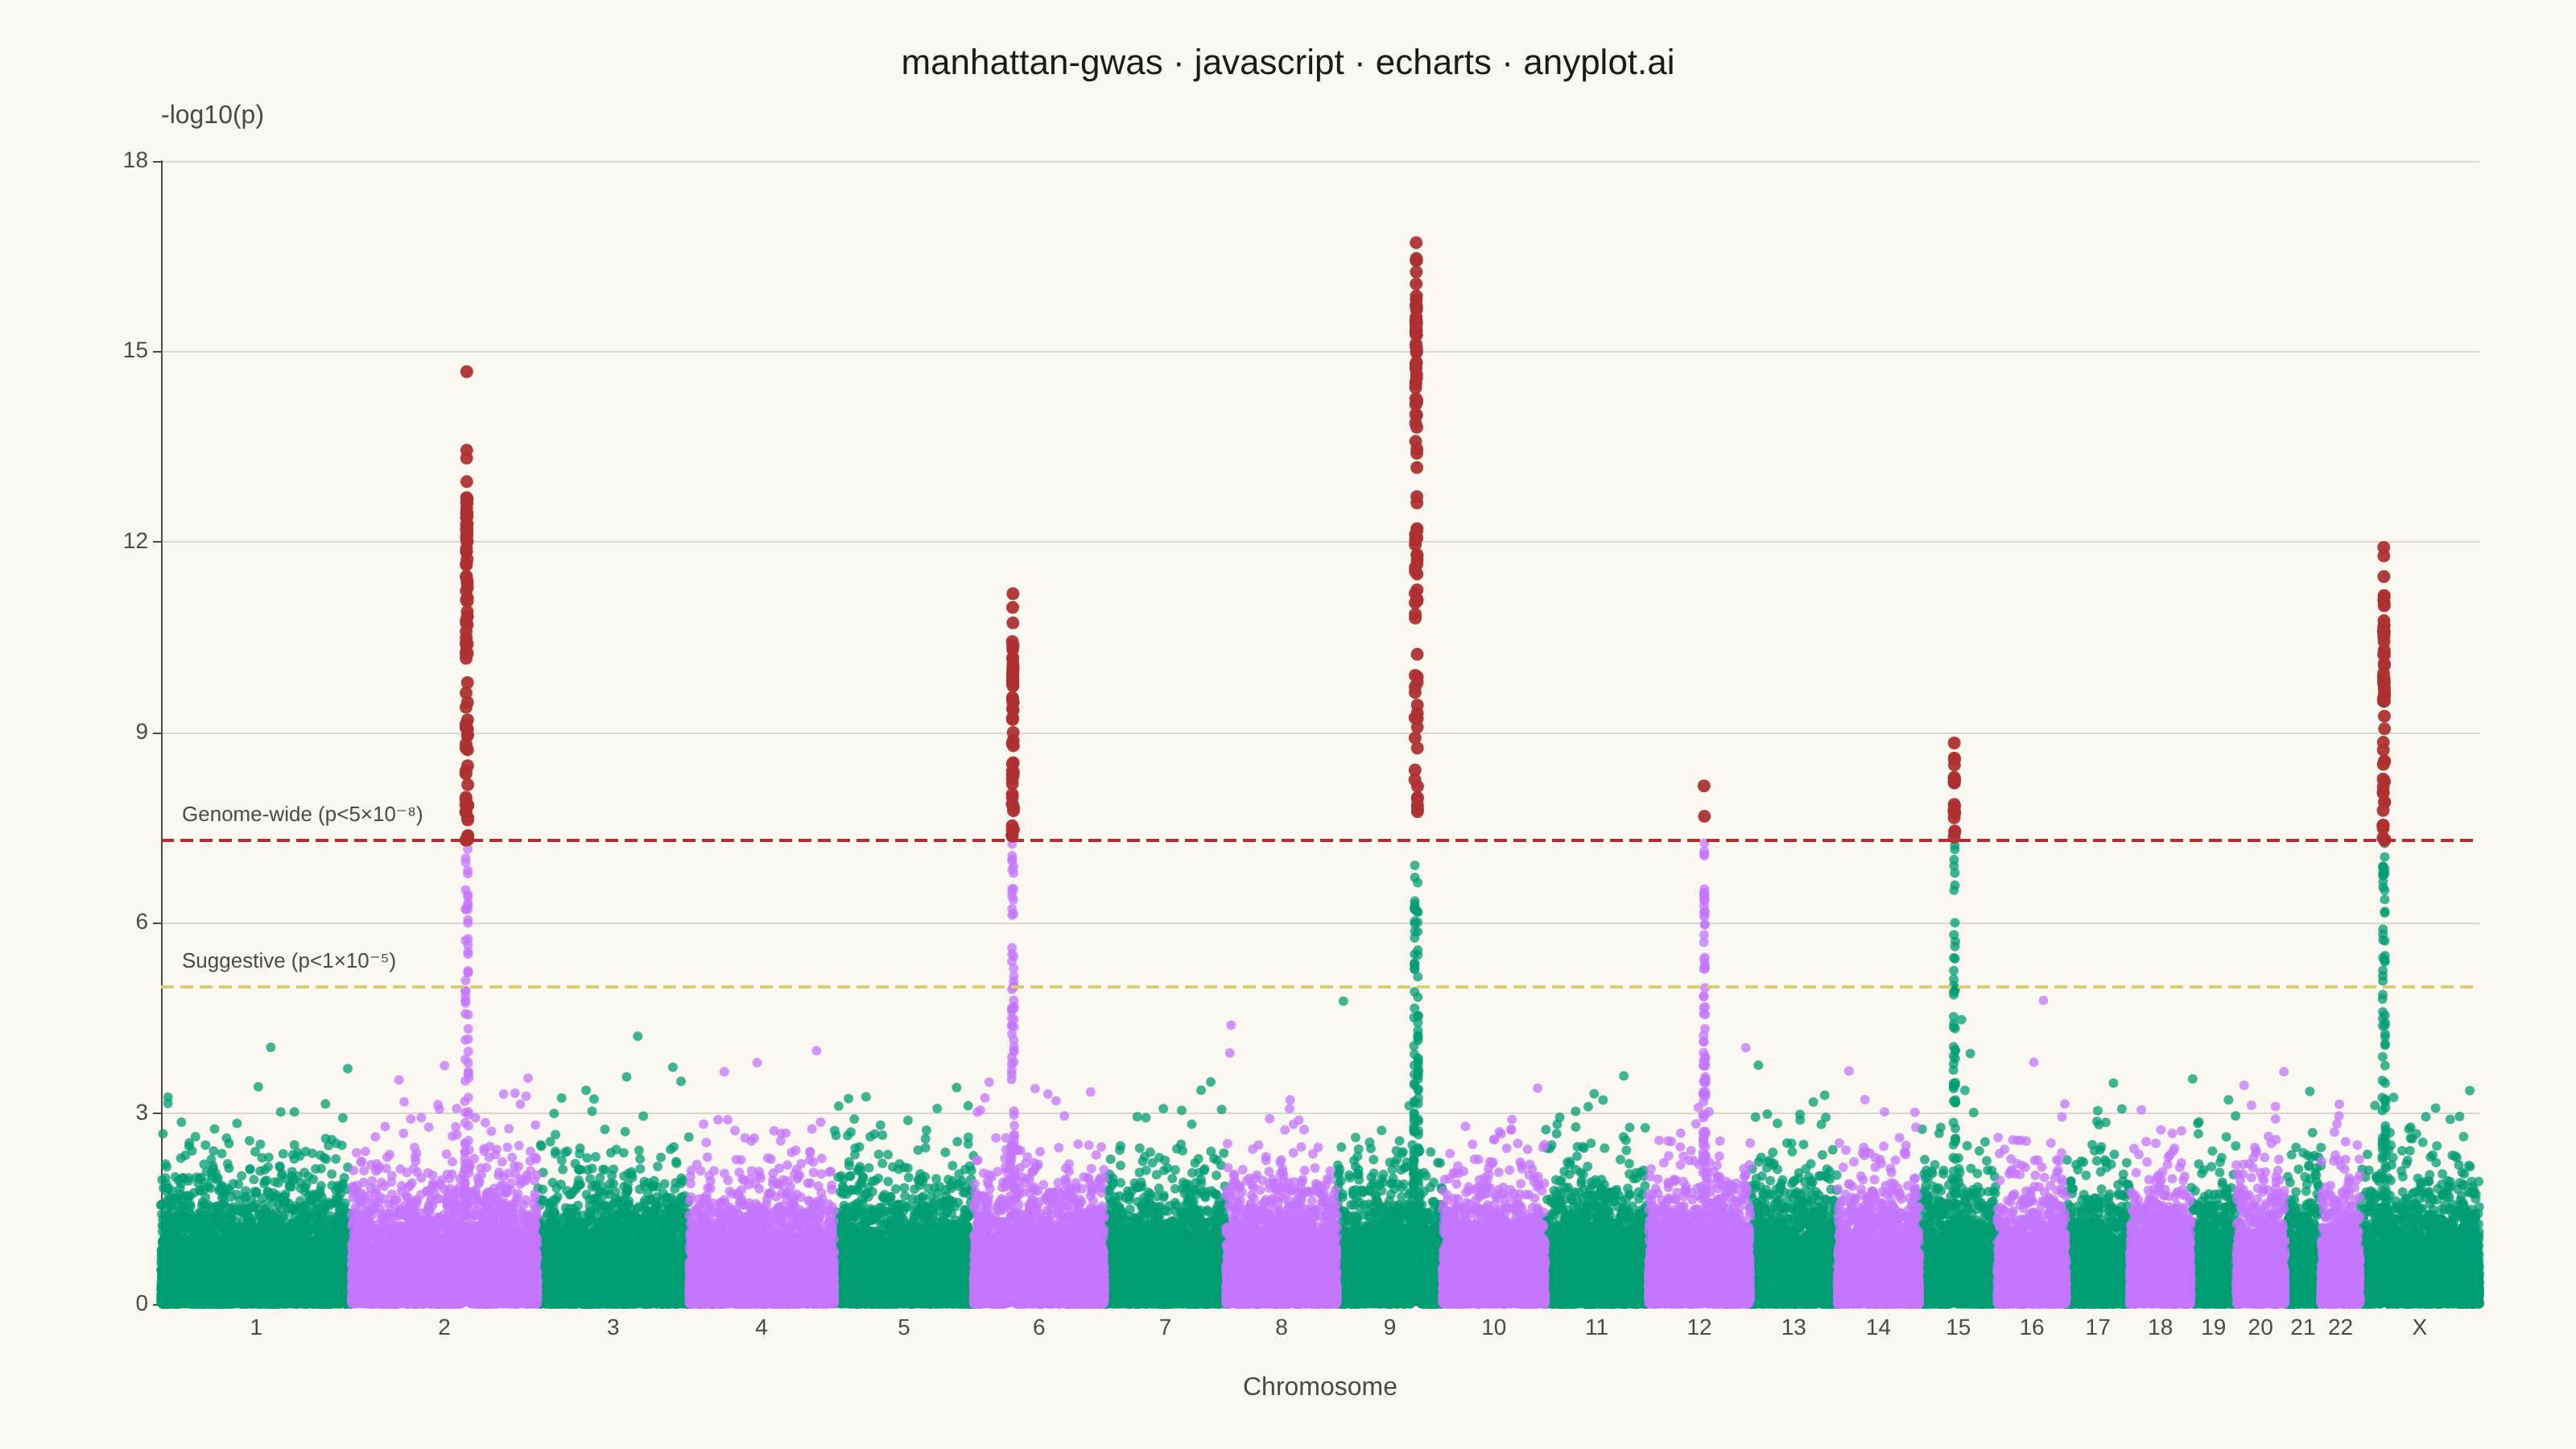
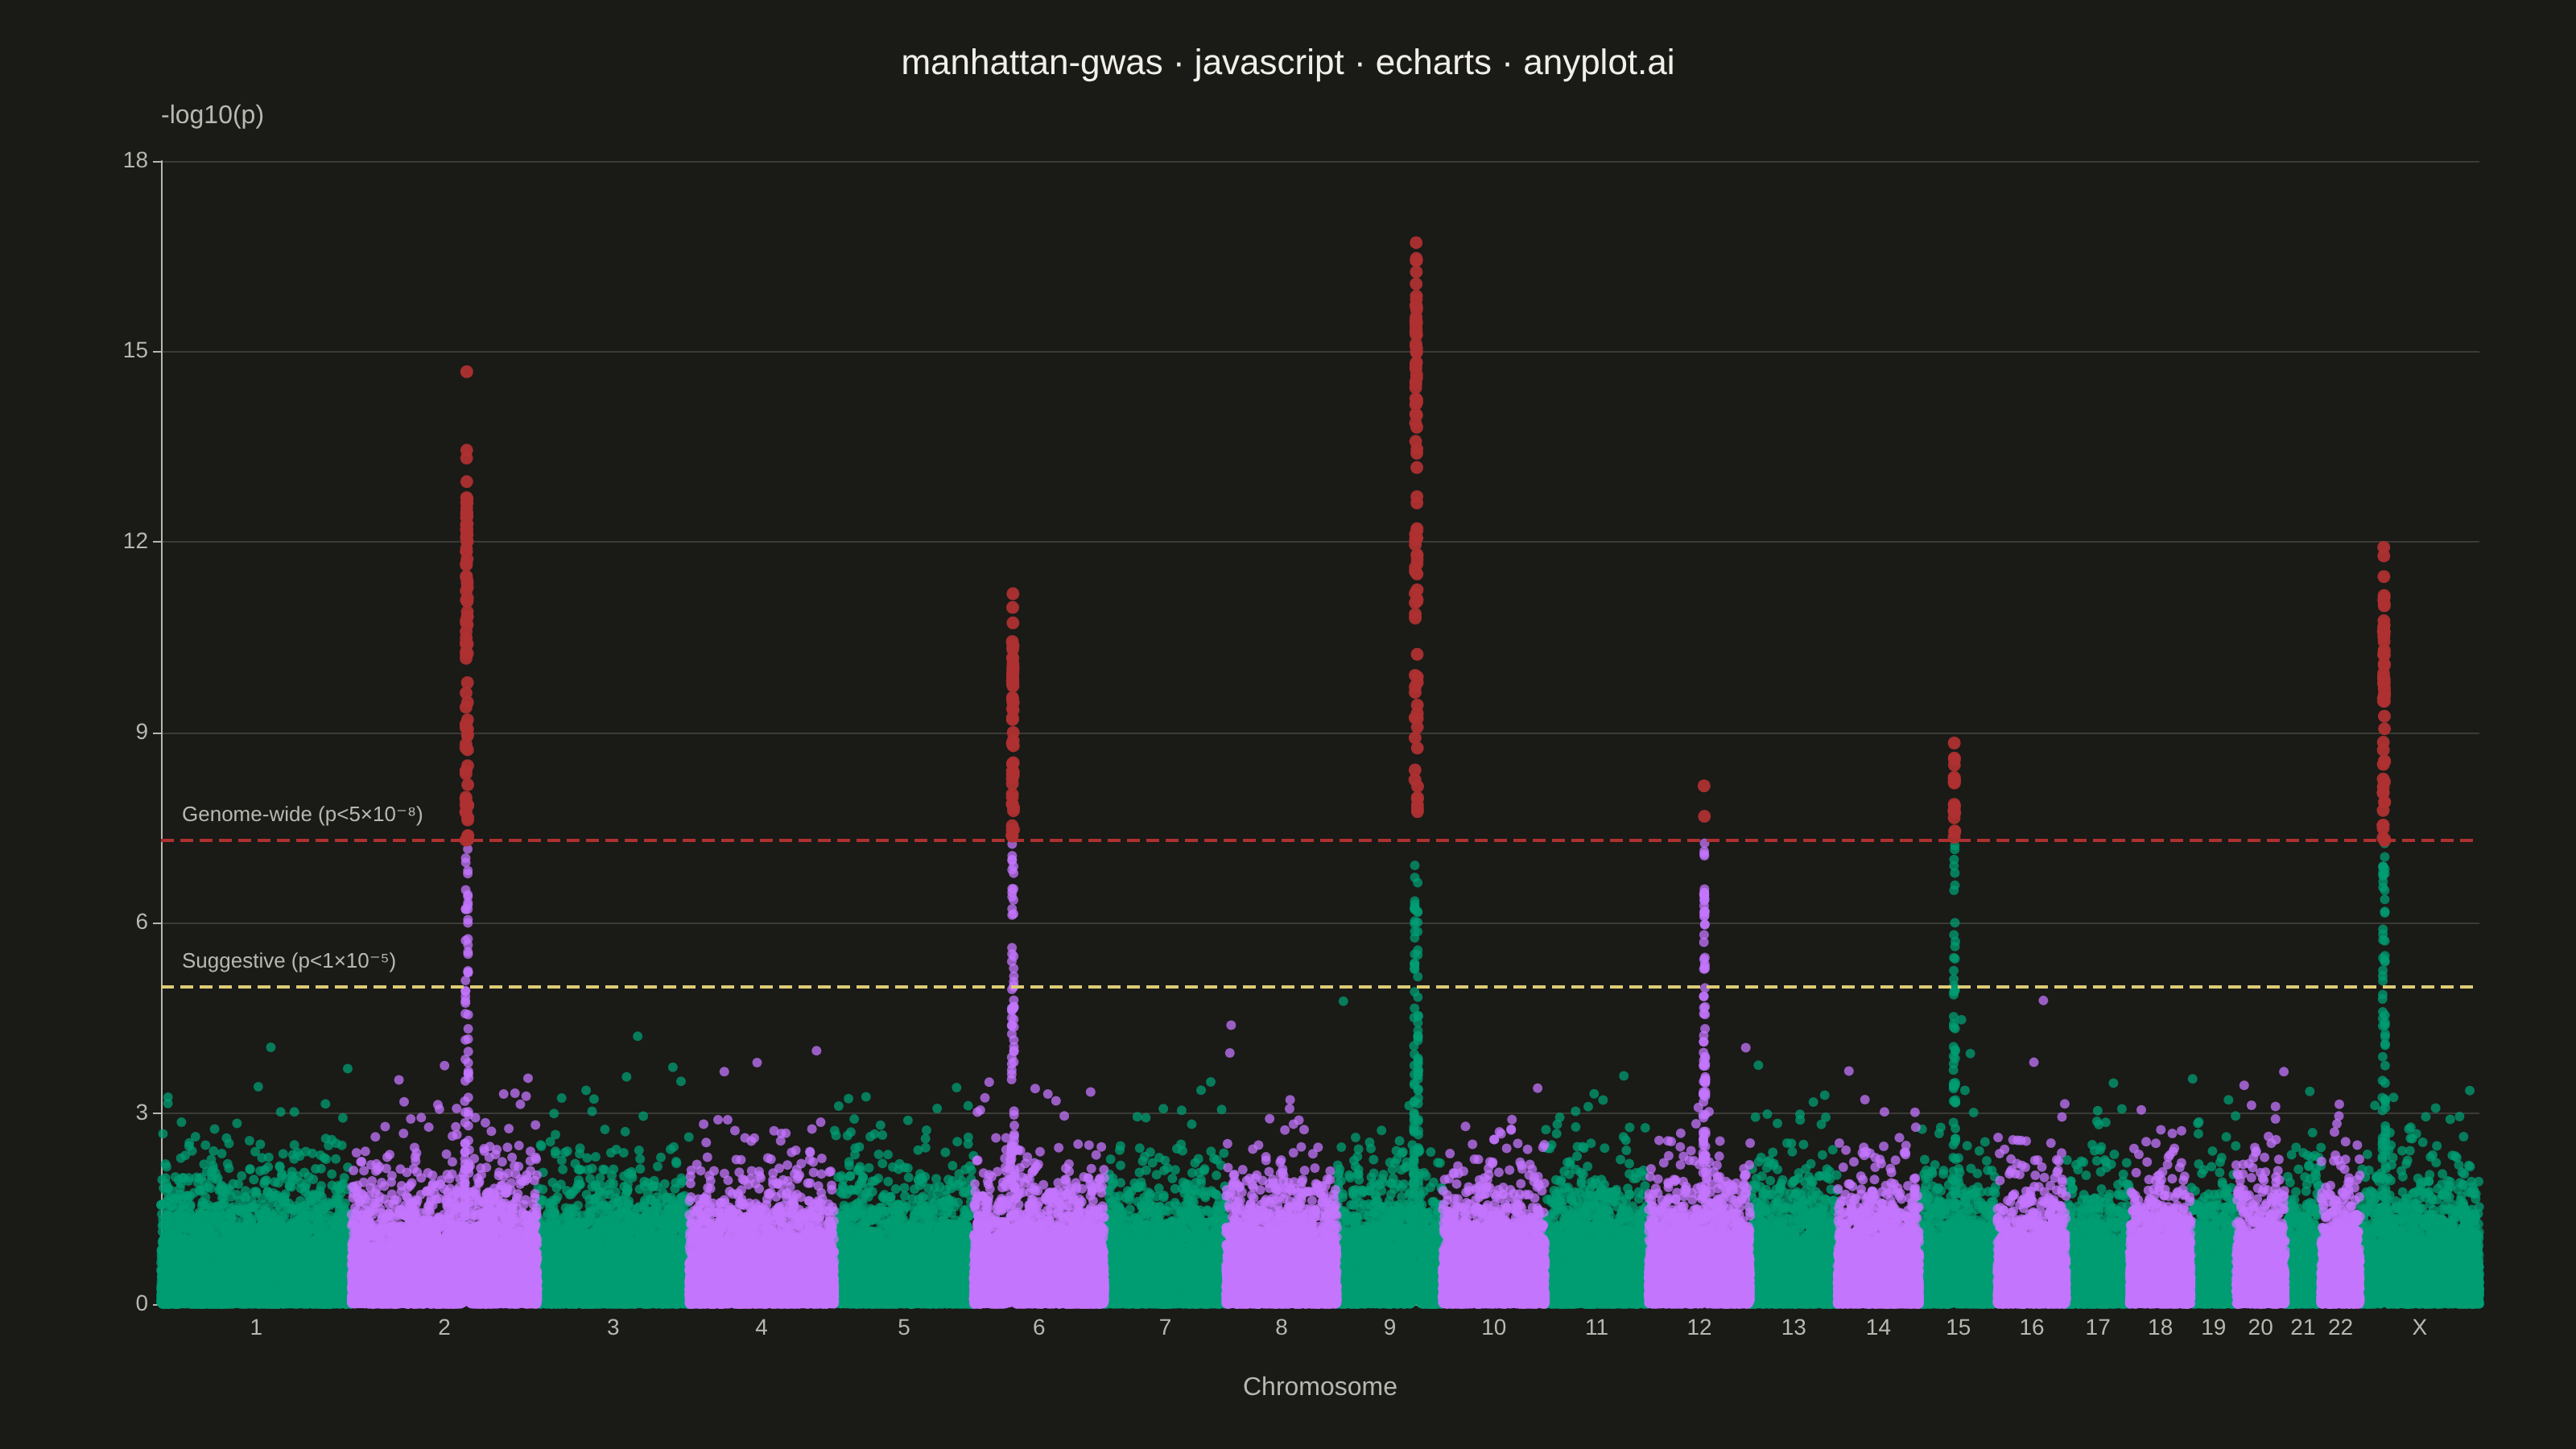
A Manhattan plot visualizes genome-wide association study (GWAS) results by displaying -log10 transformed p-values across chromosomal positions. Points are arranged by genomic position along the x-axis with alternating colors for each chromosome, making it easy to identify significant associations. A horizontal threshold line indicates genome-wide significance (typically p < 5×10⁻⁸). This plot is essential for identifying genetic variants associated with traits or diseases.
// anyplot.ai
// manhattan-gwas: Manhattan Plot for GWAS
// Library: echarts 6.1.0 | JavaScript 22.23.2
// Quality: 94/100 | Created: 2026-09-05
//# anyplot-orientation: landscape

const t = window.ANYPLOT_TOKENS;

// --- Deterministic PRNG (32-bit LCG via Math.imul, never returns exactly 0) -
let seed = 42;
function rand() {
  seed = (Math.imul(seed, 1103515245) + 12345) | 0;
  return (seed >>> 0) / 4294967296 + 1e-9;
}

// --- Chromosome layout (approximate GRCh38 lengths, Mb) ---------------------
const CHROMOSOMES = [
  ["1", 249],
  ["2", 243],
  ["3", 198],
  ["4", 190],
  ["5", 182],
  ["6", 171],
  ["7", 159],
  ["8", 145],
  ["9", 138],
  ["10", 134],
  ["11", 135],
  ["12", 133],
  ["13", 114],
  ["14", 107],
  ["15", 102],
  ["16", 90],
  ["17", 83],
  ["18", 80],
  ["19", 59],
  ["20", 64],
  ["21", 47],
  ["22", 51],
  ["X", 156],
];

// --- Simulated GWAS association peaks (chromosome index, position fraction,
// peak height added to the null -log10(p), and width of the LD-decay window) -
const PEAKS = [
  { chrIdx: 1, frac: 0.62, height: 12.5, width: 1.2 }, // chr2 — genome-wide hit
  { chrIdx: 5, frac: 0.3, height: 9.8, width: 1.0 }, // chr6 — genome-wide hit
  { chrIdx: 8, frac: 0.75, height: 15.4, width: 1.4 }, // chr9 — strongest hit
  { chrIdx: 11, frac: 0.55, height: 6.4, width: 0.9 }, // chr12 — suggestive only
  { chrIdx: 14, frac: 0.45, height: 8.1, width: 0.8 }, // chr15 — genome-wide hit
  { chrIdx: 22, frac: 0.2, height: 10.6, width: 1.1 }, // chrX — genome-wide hit
];

const GENOME_WIDE = 7.3; // -log10(5e-8)
const SUGGESTIVE = 5; // -log10(1e-5)

// --- Build points -------------------------------------------------------------
let offset = 0;
const primaryChr = []; // odd-numbered chromosomes (1, 3, 5, ...) — brand green
const secondaryChr = []; // even-numbered chromosomes (2, 4, 6, ...) — blue
const significant = []; // genome-wide significant SNPs — matte red
const tickPositions = [];

CHROMOSOMES.forEach(([, lengthMb], idx) => {
  const nPoints = Math.round(lengthMb * 30);
  const peak = PEAKS.find((p) => p.chrIdx === idx);
  for (let i = 0; i < nPoints; i += 1) {
    const posMb = rand() * lengthMb;
    let negLogP = -Math.log10(rand());
    if (peak) {
      const dist = posMb - peak.frac * lengthMb;
      negLogP +=
        peak.height * Math.exp(-(dist * dist) / (2 * peak.width * peak.width));
    }
    negLogP = Math.min(negLogP, 20);
    const point = [offset + posMb, negLogP];
    if (negLogP >= GENOME_WIDE) significant.push(point);
    else if (idx % 2 === 0) primaryChr.push(point);
    else secondaryChr.push(point);
  }
  tickPositions.push(offset + lengthMb / 2);
  offset += lengthMb;
});

const totalLength = offset;
const chrNameByTick = new Map(
  tickPositions.map((pos, idx) => [pos, CHROMOSOMES[idx][0]]),
);

// --- Chart --------------------------------------------------------------------
const chart = echarts.init(document.getElementById("container"));

chart.setOption({
  animation: false,
  backgroundColor: "transparent",
  color: t.palette,
  title: {
    text: "manhattan-gwas · javascript · echarts · anyplot.ai",
    left: "center",
    top: 24,
    textStyle: { color: t.ink, fontSize: 22, fontWeight: 500 },
  },
  grid: { left: 100, right: 60, top: 100, bottom: 90 },
  xAxis: {
    type: "value",
    min: 0,
    max: totalLength,
    name: "Chromosome",
    nameLocation: "center",
    nameGap: 44,
    nameTextStyle: { color: t.inkSoft, fontSize: 16 },
    axisLine: { lineStyle: { color: t.inkSoft } },
    axisTick: { show: false },
    splitLine: { show: false },
    axisLabel: {
      color: t.inkSoft,
      fontSize: 14,
      customValues: tickPositions,
      formatter: (value) => chrNameByTick.get(value) ?? "",
    },
  },
  yAxis: {
    type: "value",
    name: "-log10(p)",
    nameLocation: "end",
    nameGap: 20,
    nameTextStyle: { color: t.inkSoft, fontSize: 16, align: "left" },
    min: 0,
    axisLine: { lineStyle: { color: t.inkSoft } },
    axisLabel: { color: t.inkSoft, fontSize: 14 },
    splitLine: { lineStyle: { color: t.grid } },
  },
  series: [
    {
      name: "Odd chromosomes",
      type: "scatter",
      data: primaryChr,
      symbolSize: 6,
      itemStyle: { color: t.palette[0], opacity: 0.75 },
      markLine: {
        symbol: "none",
        silent: true,
        animation: false,
        lineStyle: { type: "dashed", width: 2 },
        label: {
          show: true,
          position: "insideStartTop",
          align: "left",
          color: t.inkSoft,
          fontSize: 13,
          formatter: "{b}",
          padding: [4, 8],
        },
        data: [
          {
            yAxis: GENOME_WIDE,
            name: "Genome-wide (p<5×10⁻⁸)",
            lineStyle: { color: t.palette[4] },
          },
          {
            yAxis: SUGGESTIVE,
            name: "Suggestive (p<1×10⁻⁵)",
            lineStyle: { color: t.amber },
          },
        ],
      },
    },
    {
      name: "Even chromosomes",
      type: "scatter",
      data: secondaryChr,
      symbolSize: 6,
      itemStyle: { color: t.palette[1], opacity: 0.75 },
    },
    {
      name: "Genome-wide significant",
      type: "scatter",
      data: significant,
      symbolSize: 8,
      itemStyle: { color: t.palette[4], opacity: 0.95 },
    },
  ],
});

chart.on("finished", () => {
  window.__anyplotReady = true;
});
Runnable source as JSON, for any HTTP client: https://api.anyplot.ai/specs/manhattan-gwas/echarts/code. Any spec id and library id listed in llms-full.txt fit the same URL shape; every URL below is complete and callable.
{
  "spec_id": "manhattan-gwas",
  "language": "javascript",
  "library": "echarts",
  "page": "https://anyplot.ai/manhattan-gwas/javascript/echarts",
  "hub": "https://anyplot.ai/manhattan-gwas",
  "code_json": "https://api.anyplot.ai/specs/manhattan-gwas/echarts/code",
  "spec_json": "https://api.anyplot.ai/specs/manhattan-gwas",
  "render_light_png": "https://storage.googleapis.com/anyplot-images/plots/manhattan-gwas/javascript/echarts/plot-light.png",
  "render_dark_png": "https://storage.googleapis.com/anyplot-images/plots/manhattan-gwas/javascript/echarts/plot-dark.png",
  "interactive_light_html": "https://storage.googleapis.com/anyplot-images/plots/manhattan-gwas/javascript/echarts/plot-light.html",
  "interactive_dark_html": "https://storage.googleapis.com/anyplot-images/plots/manhattan-gwas/javascript/echarts/plot-dark.html",
  "quality_score": 94.0,
  "license": "MIT",
  "guide": "https://anyplot.ai/llms.txt"
}
Part of Manhattan Plot for GWAS on anyplot.ai.