The same plot in 14 other libraries — JavaScript: Chart.js, D3.js, Apache ECharts, Highcharts; Python: Altair, Bokeh, lets-plot, Matplotlib, Plotly, plotnine, Pygal, Seaborn; R: ggplot2; Julia: Makie.jl. Compare all 15 side by side: Manhattan Plot for GWAS in Python, R, Julia and JavaScript.
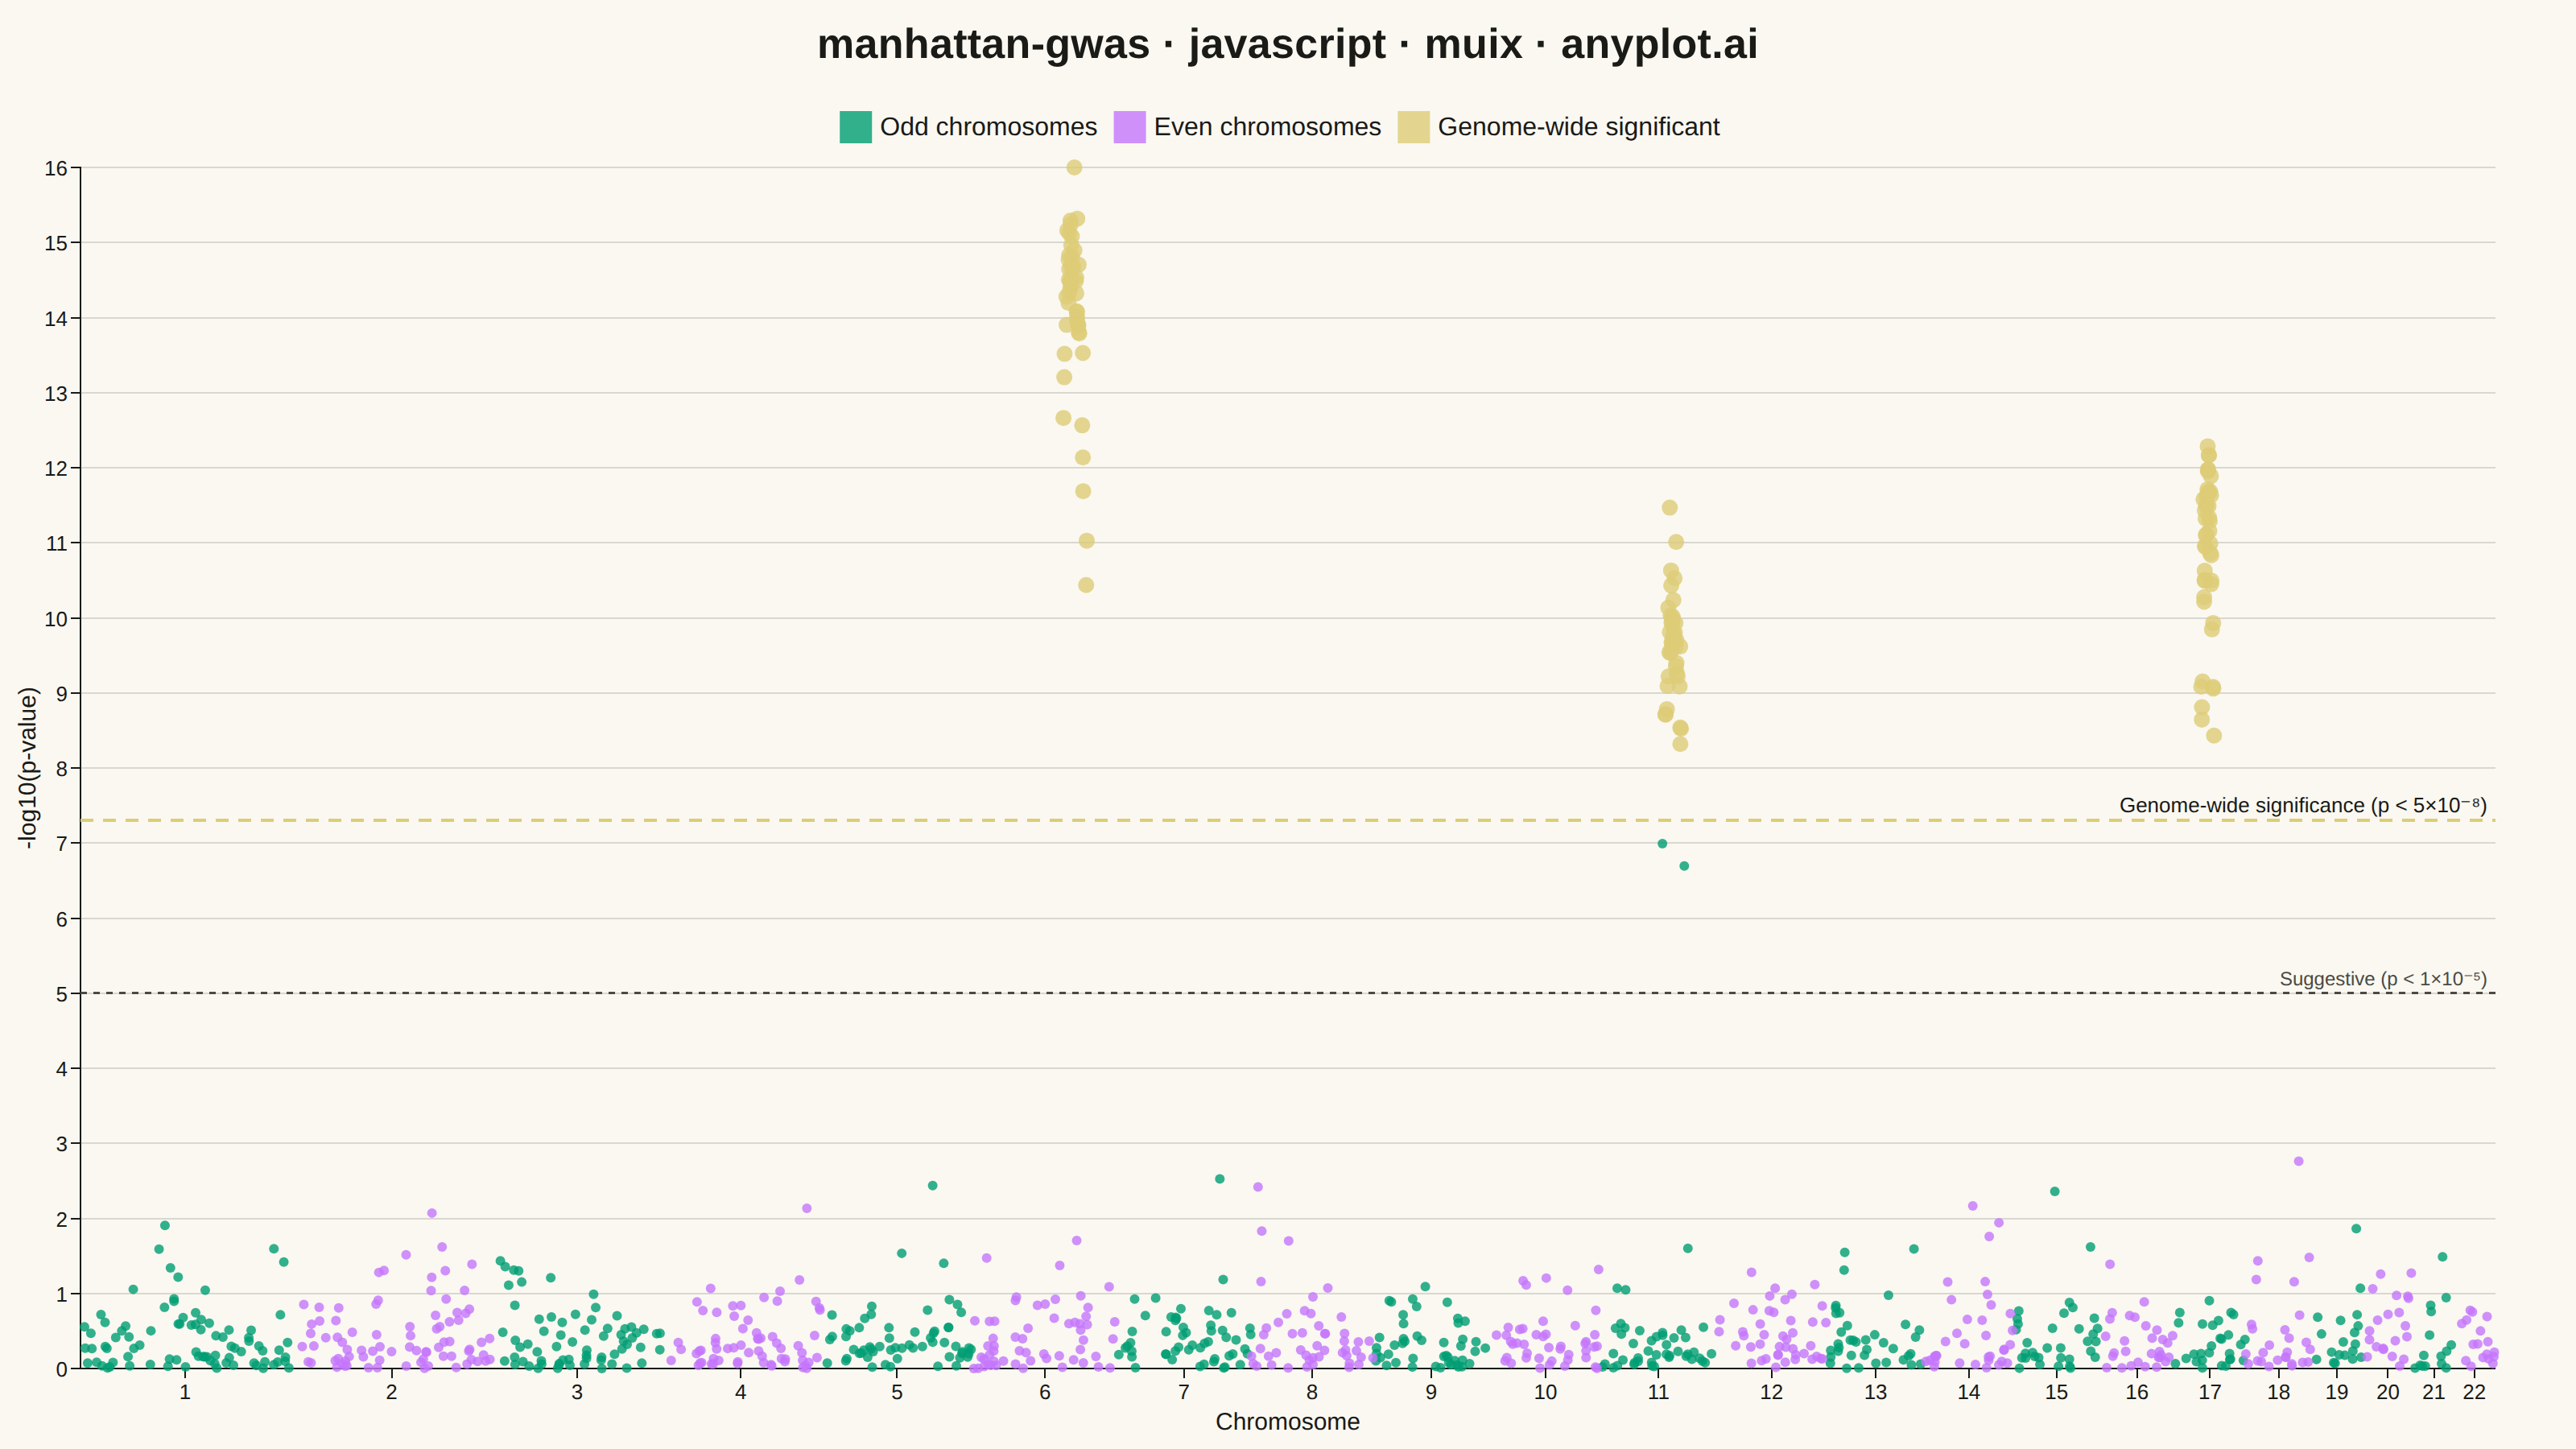
A Manhattan plot visualizes genome-wide association study (GWAS) results by displaying -log10 transformed p-values across chromosomal positions. Points are arranged by genomic position along the x-axis with alternating colors for each chromosome, making it easy to identify significant associations. A horizontal threshold line indicates genome-wide significance (typically p < 5×10⁻⁸). This plot is essential for identifying genetic variants associated with traits or diseases.
// anyplot.ai
// manhattan-gwas: Manhattan Plot for GWAS
// Library: muix 7.29.1 | JavaScript 22.23.2
// Quality: 91/100 | Created: 2026-09-05
import { ScatterChart } from "@mui/x-charts/ScatterChart";
import { ChartsReferenceLine } from "@mui/x-charts/ChartsReferenceLine";

const t = window.ANYPLOT_TOKENS;

// --- Deterministic PRNG (LCG, no seeded Math.random in the browser) ---------
let seed = 42;
function rand() {
  seed = (seed * 1664525 + 1013904223) % 4294967296;
  return seed / 4294967296;
}

// --- Chromosome layout (approximate relative lengths, Mb) -------------------
const CHROM_LENGTHS = [
  248, 242, 198, 190, 181, 170, 159, 145, 138, 133, 135, 133, 114, 107, 101, 90,
  83, 80, 58, 63, 46, 50,
];

let cursor = 0;
const chromRanges = CHROM_LENGTHS.map((length, i) => {
  const start = cursor;
  cursor += length;
  return { label: String(i + 1), start, length, center: start + length / 2 };
});
const genomeLength = cursor;

// --- Simulated association signal -------------------------------------------
// Null-model baseline: for p ~ Uniform(0,1), -log10(p) is Exponential(ln 10).
// A few chromosomes additionally carry a genuine association peak — a dense
// cluster of points near one locus whose height decays with distance from it.
const PEAK_CHROM_INDICES = [5, 10, 16]; // chr6, chr11, chr17 (0-indexed)
const PEAK_HEIGHTS = [14.5, 9.6, 11.3];

const GENOME_WIDE_SIGNIFICANCE = -Math.log10(5e-8); // ≈ 7.3
const SUGGESTIVE_THRESHOLD = -Math.log10(1e-5); // 5

const oddPoints = [];
const evenPoints = [];
const significantPoints = [];
let pointId = 0;

function pushPoint(chromIndex, position, negLogP) {
  const y = Math.min(negLogP, 16);
  const point = { x: position, y, id: pointId };
  pointId += 1;
  if (y >= GENOME_WIDE_SIGNIFICANCE) {
    significantPoints.push(point);
  } else if (chromIndex % 2 === 0) {
    oddPoints.push(point);
  } else {
    evenPoints.push(point);
  }
}

chromRanges.forEach((range, chromIndex) => {
  // Baseline scatter across the whole chromosome.
  const numPoints = Math.round(range.length / 3);
  for (let i = 0; i < numPoints; i += 1) {
    const position = range.start + rand() * range.length;
    const negLogP = -Math.log(rand()) / Math.LN10;
    pushPoint(chromIndex, position, negLogP);
  }

  // Associated locus: a denser cluster around a peak position, height
  // decaying with distance (an approximate-normal jitter via Irwin-Hall).
  const peakIdx = PEAK_CHROM_INDICES.indexOf(chromIndex);
  if (peakIdx >= 0) {
    const peakPos = range.start + range.length * (0.3 + rand() * 0.4);
    const peakHeight = PEAK_HEIGHTS[peakIdx];
    const spread = range.length * 0.08;
    for (let i = 0; i < 45; i += 1) {
      const jitter = (rand() + rand() + rand() - 1.5) * spread;
      const position = Math.min(Math.max(peakPos + jitter, range.start), range.start + range.length);
      const distance = (position - peakPos) / (spread * 2);
      const negLogP = -Math.log(rand()) / Math.LN10 + peakHeight * Math.exp(-distance * distance);
      pushPoint(chromIndex, position, negLogP);
    }
  }
});

const centerToLabel = new Map(chromRanges.map((r) => [r.center, r.label]));
const tickCenters = chromRanges.map((r) => r.center);

// Dense baseline/peak points get a touch of transparency to combat
// overplotting in the association clusters; the sparse highlighted hits
// below stay fully opaque.
const MARKER_ALPHA = "CC"; // ~80% opacity, appended as 8-digit hex alpha

// --- Chart (default-exported component — the harness mounts it) -------------
export default function Chart() {
  const W = window.ANYPLOT_SIZE.width;
  const H = window.ANYPLOT_SIZE.height;
  const TITLE_H = 54;

  return (
    <div
      style={{
        width: W,
        height: H,
        background: t.pageBg,
        display: "flex",
        flexDirection: "column",
        fontFamily: "'Roboto', 'Helvetica Neue', Arial, sans-serif",
      }}
    >
      <div
        style={{
          height: TITLE_H,
          display: "flex",
          alignItems: "center",
          justifyContent: "center",
          fontSize: 26,
          fontWeight: 600,
          color: t.ink,
          letterSpacing: 0.15,
        }}
      >
        manhattan-gwas · javascript · muix · anyplot.ai
      </div>
      <ScatterChart
        width={W}
        height={H - TITLE_H}
        series={[
          {
            id: "odd",
            label: "Odd chromosomes",
            color: `${t.palette[0]}${MARKER_ALPHA}`,
            markerSize: 3,
            data: oddPoints,
          },
          {
            id: "even",
            label: "Even chromosomes",
            color: `${t.palette[1]}${MARKER_ALPHA}`,
            markerSize: 3,
            data: evenPoints,
          },
          {
            id: "significant",
            label: "Genome-wide significant",
            color: `${t.amber}${MARKER_ALPHA}`,
            markerSize: 5,
            data: significantPoints,
          },
        ]}
        xAxis={[
          {
            scaleType: "linear",
            min: 0,
            max: genomeLength,
            label: "Chromosome",
            tickInterval: tickCenters,
            valueFormatter: (value) => centerToLabel.get(value) ?? "",
            tickLabelStyle: { fontSize: 13 },
            labelStyle: { fontSize: 15 },
          },
        ]}
        yAxis={[
          {
            scaleType: "linear",
            min: 0,
            label: "-log10(p-value)",
            tickLabelStyle: { fontSize: 13 },
            labelStyle: { fontSize: 15 },
          },
        ]}
        grid={{ horizontal: true }}
        disableVoronoi
        skipAnimation
        slotProps={{ legend: { position: { vertical: "top", horizontal: "middle" } } }}
      >
        <ChartsReferenceLine
          y={GENOME_WIDE_SIGNIFICANCE}
          label="Genome-wide significance (p < 5×10⁻⁸)"
          labelAlign="end"
          lineStyle={{ stroke: t.amber, strokeDasharray: "8 6", strokeWidth: 2 }}
          labelStyle={{ fill: t.ink, fontSize: 13 }}
        />
        <ChartsReferenceLine
          y={SUGGESTIVE_THRESHOLD}
          label="Suggestive (p < 1×10⁻⁵)"
          labelAlign="end"
          lineStyle={{ stroke: t.inkSoft, strokeDasharray: "4 4", strokeWidth: 1.5 }}
          labelStyle={{ fill: t.inkSoft, fontSize: 12 }}
        />
      </ScatterChart>
    </div>
  );
}
Runnable source as JSON, for any HTTP client: https://api.anyplot.ai/specs/manhattan-gwas/muix/code. Any spec id and library id listed in llms-full.txt fit the same URL shape; every URL below is complete and callable.
{
  "spec_id": "manhattan-gwas",
  "language": "javascript",
  "library": "muix",
  "page": "https://anyplot.ai/manhattan-gwas/javascript/muix",
  "hub": "https://anyplot.ai/manhattan-gwas",
  "code_json": "https://api.anyplot.ai/specs/manhattan-gwas/muix/code",
  "spec_json": "https://api.anyplot.ai/specs/manhattan-gwas",
  "render_light_png": "https://storage.googleapis.com/anyplot-images/plots/manhattan-gwas/javascript/muix/plot-light.png",
  "render_dark_png": "https://storage.googleapis.com/anyplot-images/plots/manhattan-gwas/javascript/muix/plot-dark.png",
  "interactive_light_html": "https://storage.googleapis.com/anyplot-images/plots/manhattan-gwas/javascript/muix/plot-light.html",
  "interactive_dark_html": "https://storage.googleapis.com/anyplot-images/plots/manhattan-gwas/javascript/muix/plot-dark.html",
  "quality_score": 91.0,
  "license": "MIT",
  "guide": "https://anyplot.ai/llms.txt"
}
Part of Manhattan Plot for GWAS on anyplot.ai.