The same plot in 14 other libraries — JavaScript: Chart.js, D3.js, Apache ECharts, MUI X Charts; Python: Altair, Bokeh, lets-plot, Matplotlib, Plotly, plotnine, Pygal, Seaborn; R: ggplot2; Julia: Makie.jl. Compare all 15 side by side: Manhattan Plot for GWAS in Python, R, Julia and JavaScript.
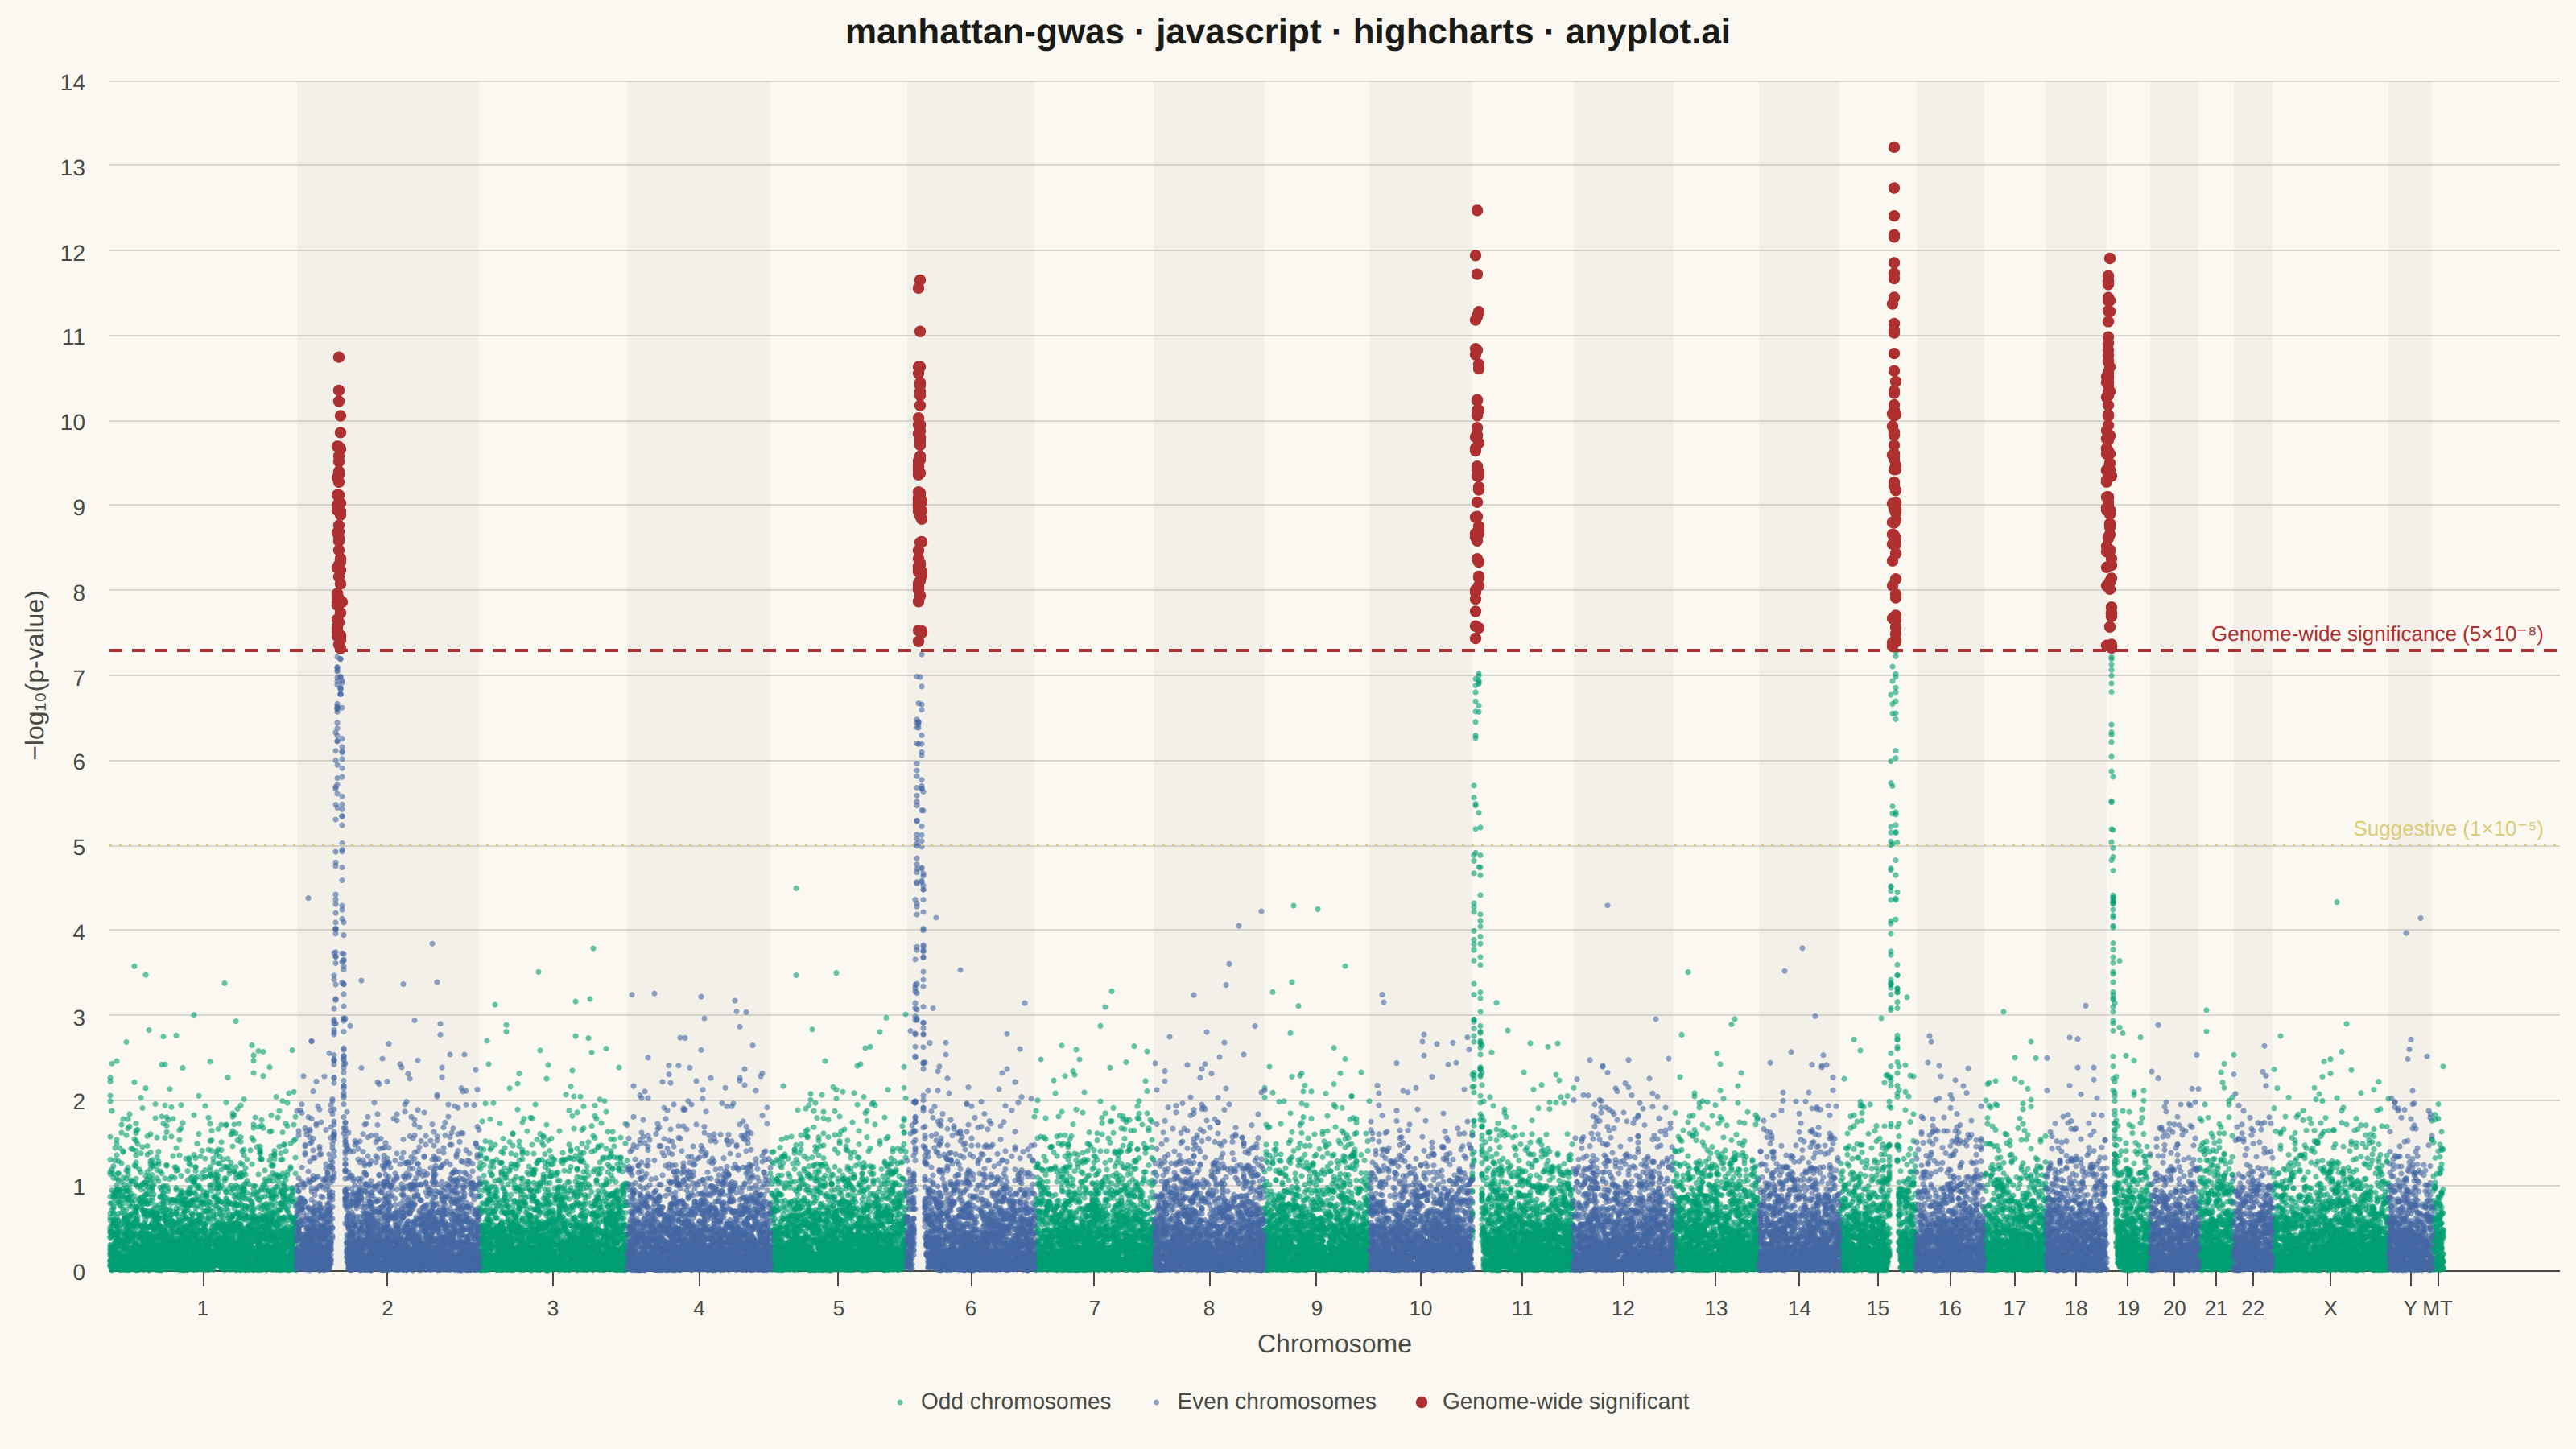
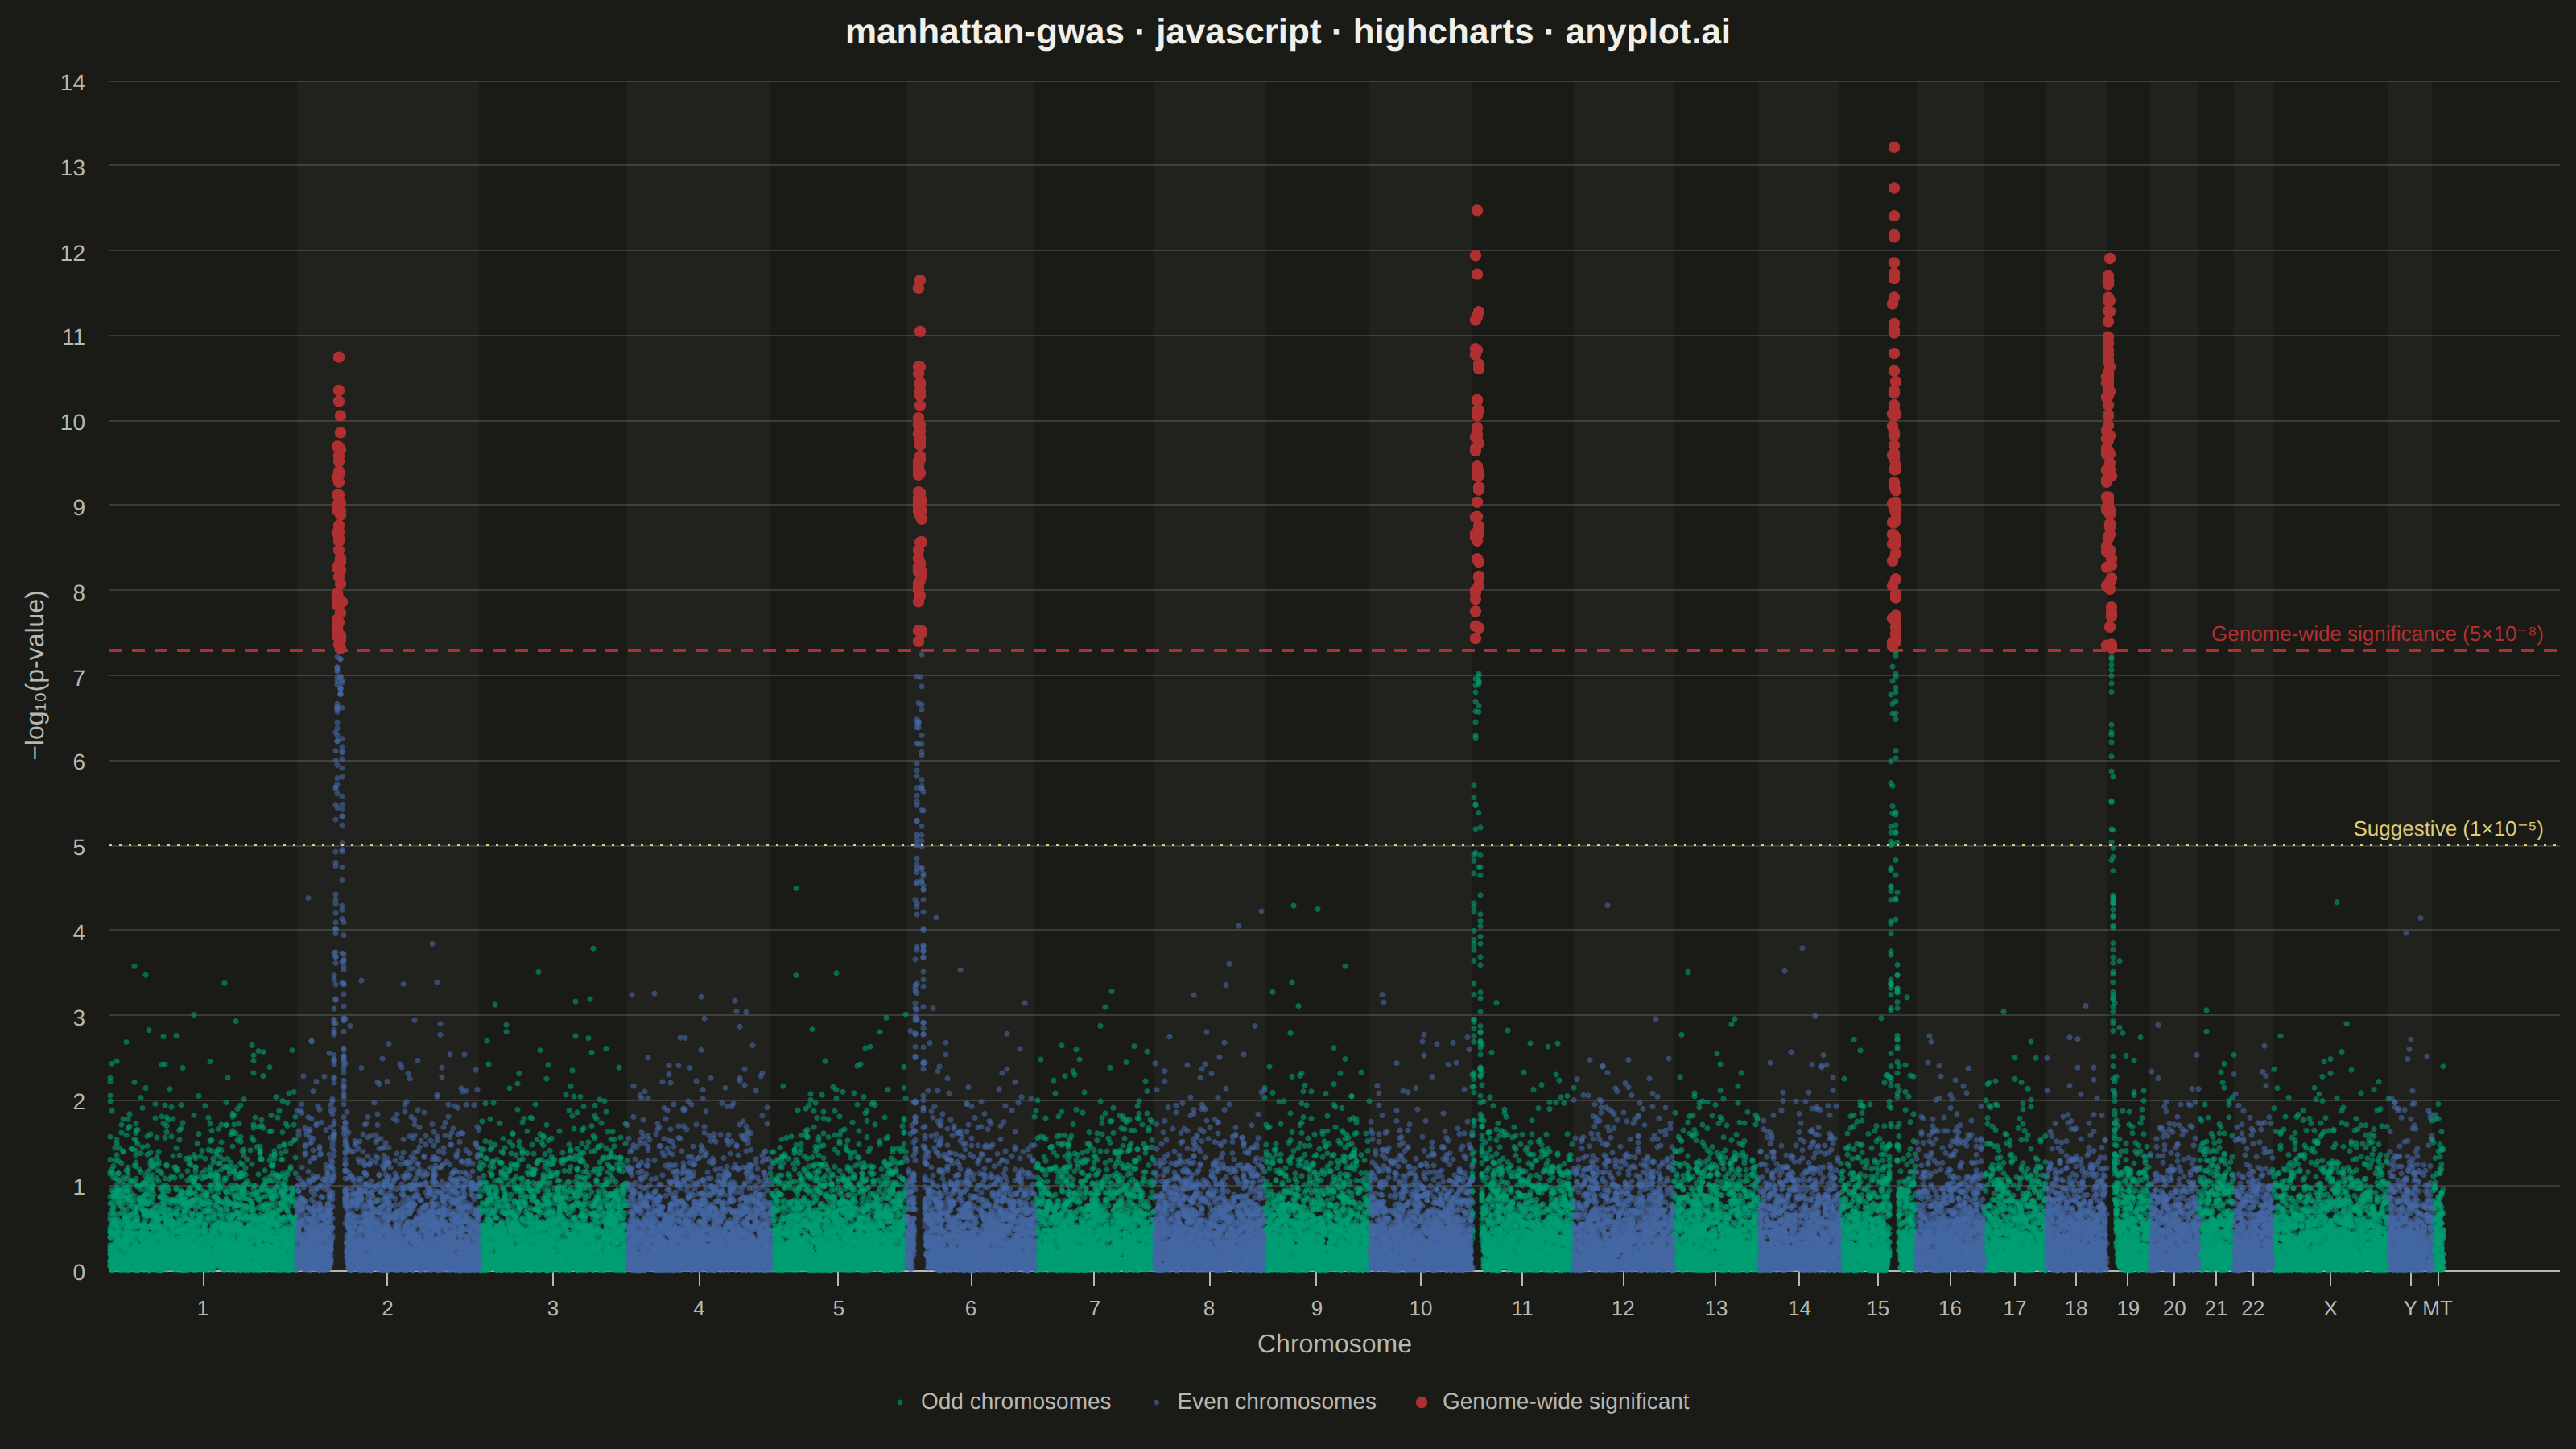
A Manhattan plot visualizes genome-wide association study (GWAS) results by displaying -log10 transformed p-values across chromosomal positions. Points are arranged by genomic position along the x-axis with alternating colors for each chromosome, making it easy to identify significant associations. A horizontal threshold line indicates genome-wide significance (typically p < 5×10⁻⁸). This plot is essential for identifying genetic variants associated with traits or diseases.
// anyplot.ai
// manhattan-gwas: Manhattan Plot for GWAS
// Library: highcharts 12.6.0 | JavaScript 22.23.2
// Quality: 93/100 | Created: 2026-09-05

const t = window.ANYPLOT_TOKENS;

// --- Data (in-memory, deterministic) ----------------------------------------
// Tiny LCG so the browser (no seeded Math.random) still reproduces the sample.
function lcg(seed) {
  let state = seed >>> 0;
  return function () {
    state = (1664525 * state + 1013904223) >>> 0;
    return state / 4294967296;
  };
}
const rand = lcg(42);

// Approximate human chromosome lengths in Mb (autosomes 1-22 + X/Y/MT) —
// gives chromosomes realistic relative widths along the cumulative
// genomic-position axis, matching the spec's full chromosome vocabulary.
// MT's true length (16.5 kb) is thousands of times smaller than Y and would
// collapse to an invisible sliver whose tick label collides with Y's — given
// a nominal display width instead, as real Manhattan plots commonly do.
const chromLengths = [
  249, 243, 198, 191, 181, 171, 159, 146, 141, 136, 135, 133, 115, 107, 102, 90, 83, 80, 59, 64, 47, 51, 156, 57, 15,
];
const chromNames = [...Array.from({ length: 22 }, (_, i) => String(i + 1)), "X", "Y", "MT"];

const offsets = [];
let cumulative = 0;
for (const length of chromLengths) {
  offsets.push(cumulative);
  cumulative += length;
}
const genomeLength = cumulative;
const tickPositions = chromLengths.map((length, i) => offsets[i] + length / 2);

const sigThreshold = -Math.log10(5e-8); // ≈ 7.30, genome-wide significance
const suggestiveThreshold = -Math.log10(1e-5); // 5, suggestive association

// A handful of chromosomes carry a simulated association peak (a Gaussian
// bump in -log10(p) around a random locus, mimicking an LD block).
const peakChroms = new Set([1, 5, 10, 14, 18]);
// Density-based SNP count (per Mb) instead of a flat per-chromosome count —
// scales naturally across the wide length range from chr1 (249 Mb) down to
// MT's nominal 15 Mb, landing near the spec's 100k-1M GWAS variant scale
// while staying renderable as plain (non-boosted) SVG scatter points.
const snpsPerMb = 15;

const oddPoints = [];
const evenPoints = [];
const sigPoints = [];

chromLengths.forEach((length, c) => {
  const offset = offsets[c];
  const bucket = c % 2 === 0 ? oddPoints : evenPoints;
  const hasPeak = peakChroms.has(c);
  const peakPos = hasPeak ? rand() * length : null;
  const peakHeight = hasPeak ? 9 + rand() * 5 : 0;
  const peakWidth = 2.5 + rand() * 2; // Mb, LD-block scale
  const snpCount = Math.round(length * snpsPerMb);

  for (let i = 0; i < snpCount; i++) {
    const pos = rand() * length;
    // Under the null, p-values are Uniform(0,1), so -log10(p) is exponential
    // with mean 1/ln(10) — a realistic background association-test noise floor.
    let negLogP = -Math.log10(1 - rand());

    if (hasPeak) {
      const dist = pos - peakPos;
      const bump = peakHeight * Math.exp(-(dist * dist) / (2 * peakWidth * peakWidth));
      negLogP += bump * (0.7 + rand() * 0.3);
    }

    const point = [offset + pos, negLogP];
    if (negLogP >= sigThreshold) {
      sigPoints.push(point);
    } else {
      bucket.push(point);
    }
  }
});

// Subtle alternating background band per chromosome region — reinforces the
// chromosome boundaries beyond just the point-color alternation.
const chromBands = chromLengths.map((length, i) => ({
  from: offsets[i],
  to: offsets[i] + length,
  color: i % 2 === 0 ? "transparent" : Highcharts.color(t.ink).setOpacity(0.035).get(),
}));

// --- Chart -------------------------------------------------------------------
Highcharts.chart("container", {
  chart: {
    type: "scatter",
    backgroundColor: "transparent",
    animation: false,
    style: { fontFamily: "inherit" },
  },
  credits: { enabled: false },
  colors: t.palette,
  title: {
    text: "manhattan-gwas · javascript · highcharts · anyplot.ai",
    style: { color: t.ink, fontSize: "22px", fontWeight: "600" },
  },
  xAxis: {
    title: { text: "Chromosome", style: { color: t.inkSoft, fontSize: "16px" } },
    min: 0,
    // 5% of blank headroom past MT reserves a data-free strip for the
    // right-anchored threshold-line labels below, so they never collide with
    // a randomly placed peak (a fixed pixel offset can't guarantee that).
    max: genomeLength * 1.05,
    tickPositions,
    lineColor: t.inkSoft,
    tickColor: t.inkSoft,
    gridLineWidth: 0,
    plotBands: chromBands,
    labels: {
      style: { color: t.inkSoft, fontSize: "13px" },
      formatter() {
        return chromNames[tickPositions.indexOf(this.value)];
      },
    },
  },
  yAxis: {
    title: { text: "−log₁₀(p-value)", style: { color: t.inkSoft, fontSize: "16px" } },
    min: 0,
    gridLineColor: t.grid,
    labels: { style: { color: t.inkSoft, fontSize: "14px" } },
    plotLines: [
      {
        value: sigThreshold,
        color: t.palette[4],
        dashStyle: "Dash",
        width: 2,
        zIndex: 4,
        label: {
          text: "Genome-wide significance (5×10⁻⁸)",
          align: "right",
          x: -10,
          y: -6,
          style: { color: t.palette[4], fontSize: "13px" },
        },
      },
      {
        value: suggestiveThreshold,
        color: t.amber,
        dashStyle: "Dot",
        width: 1.5,
        zIndex: 4,
        label: {
          text: "Suggestive (1×10⁻⁵)",
          align: "right",
          x: -10,
          y: -6,
          style: { color: t.amber, fontSize: "13px" },
        },
      },
    ],
  },
  legend: {
    itemStyle: { color: t.inkSoft, fontSize: "14px" },
    itemHoverStyle: { color: t.ink },
  },
  tooltip: {
    headerFormat: "",
    pointFormat: "Position {point.x:.1f} Mb<br/>−log₁₀(p): <b>{point.y:.2f}</b>",
  },
  plotOptions: {
    series: { animation: false, turboThreshold: 0 },
    scatter: {
      marker: { radius: 1.8, symbol: "circle", states: { hover: { radiusPlus: 2.5 } } },
    },
  },
  series: [
    {
      name: "Odd chromosomes",
      data: oddPoints,
      color: Highcharts.color(t.palette[0]).setOpacity(0.6).get(),
    },
    {
      name: "Even chromosomes",
      data: evenPoints,
      color: Highcharts.color(t.palette[2]).setOpacity(0.6).get(),
    },
    {
      name: "Genome-wide significant",
      data: sigPoints,
      color: t.palette[4],
      marker: { radius: 3.6 },
      zIndex: 5,
    },
  ],
});
Runnable source as JSON, for any HTTP client: https://api.anyplot.ai/specs/manhattan-gwas/highcharts/code. Any spec id and library id listed in llms-full.txt fit the same URL shape; every URL below is complete and callable.
{
  "spec_id": "manhattan-gwas",
  "language": "javascript",
  "library": "highcharts",
  "page": "https://anyplot.ai/manhattan-gwas/javascript/highcharts",
  "hub": "https://anyplot.ai/manhattan-gwas",
  "code_json": "https://api.anyplot.ai/specs/manhattan-gwas/highcharts/code",
  "spec_json": "https://api.anyplot.ai/specs/manhattan-gwas",
  "render_light_png": "https://storage.googleapis.com/anyplot-images/plots/manhattan-gwas/javascript/highcharts/plot-light.png",
  "render_dark_png": "https://storage.googleapis.com/anyplot-images/plots/manhattan-gwas/javascript/highcharts/plot-dark.png",
  "interactive_light_html": "https://storage.googleapis.com/anyplot-images/plots/manhattan-gwas/javascript/highcharts/plot-light.html",
  "interactive_dark_html": "https://storage.googleapis.com/anyplot-images/plots/manhattan-gwas/javascript/highcharts/plot-dark.html",
  "quality_score": 93.0,
  "license": "MIT",
  "guide": "https://anyplot.ai/llms.txt"
}
Part of Manhattan Plot for GWAS on anyplot.ai.