The same plot in 14 other libraries — Python: Bokeh, lets-plot, Matplotlib, Plotly, plotnine, Pygal, Seaborn; R: ggplot2; Julia: Makie.jl; JavaScript: Chart.js, D3.js, Apache ECharts, Highcharts, MUI X Charts. Compare all 15 side by side: World Map with Different Projections in Python, R, Julia and JavaScript.
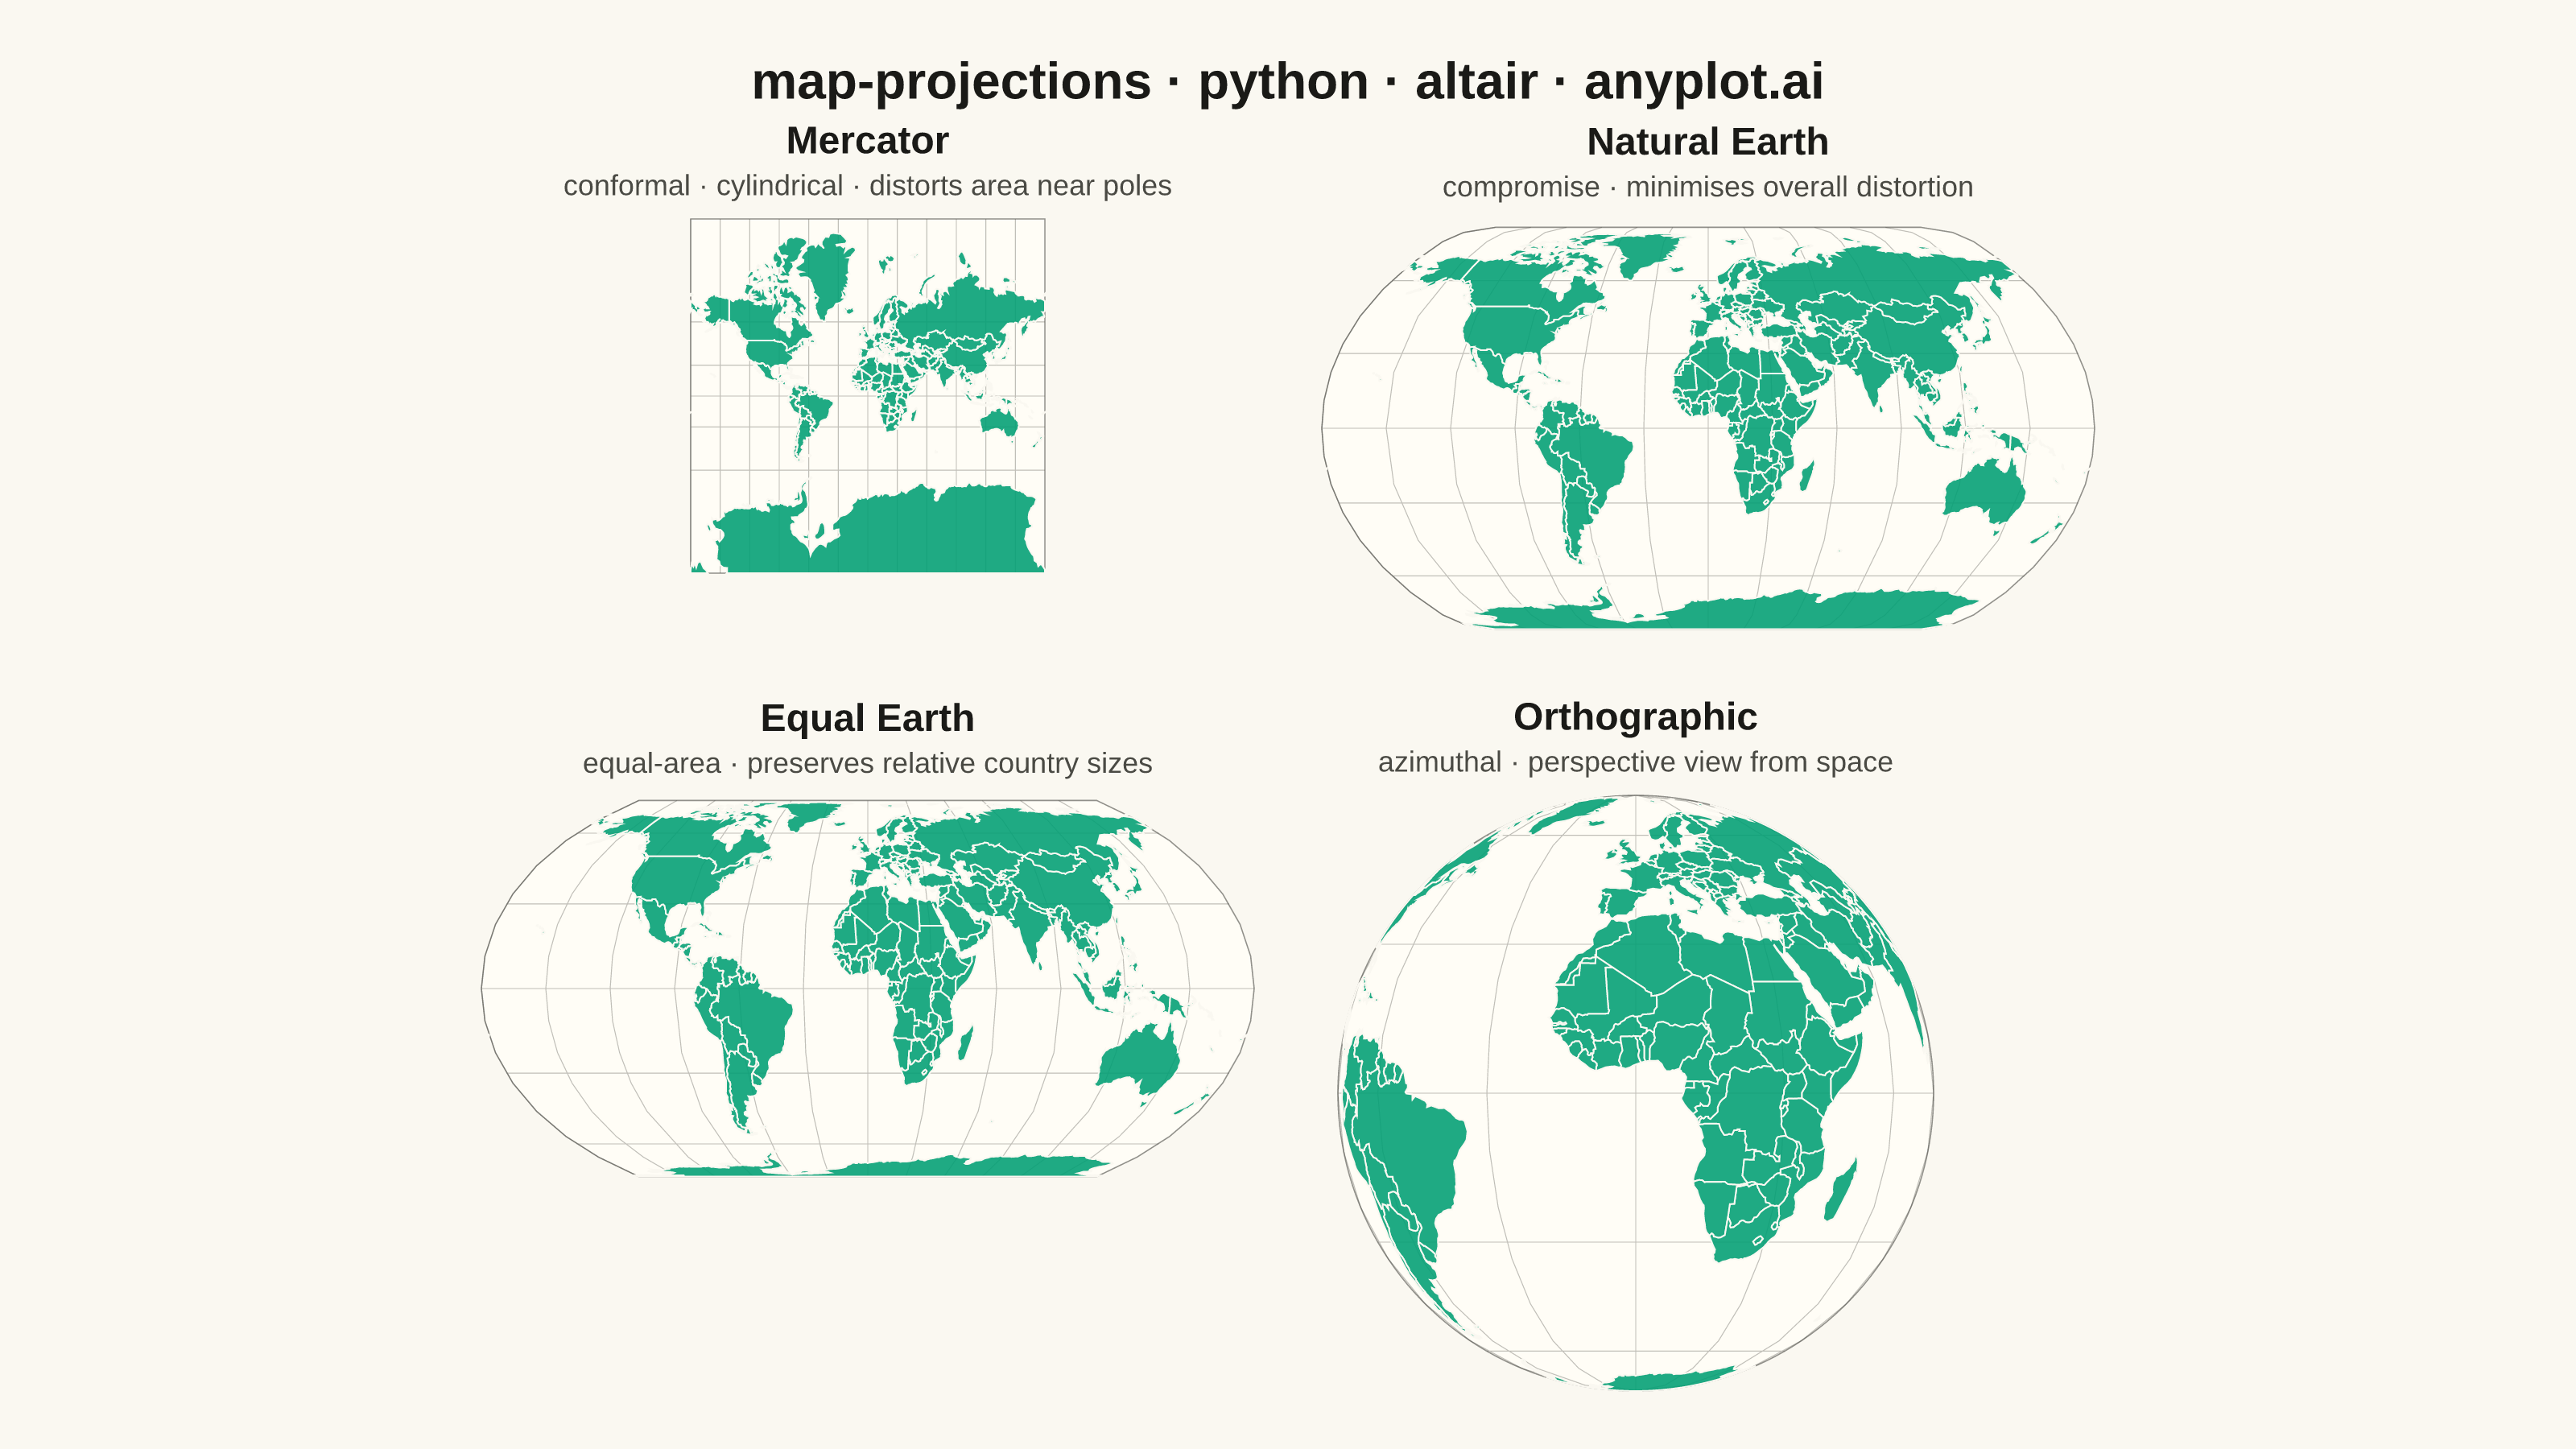
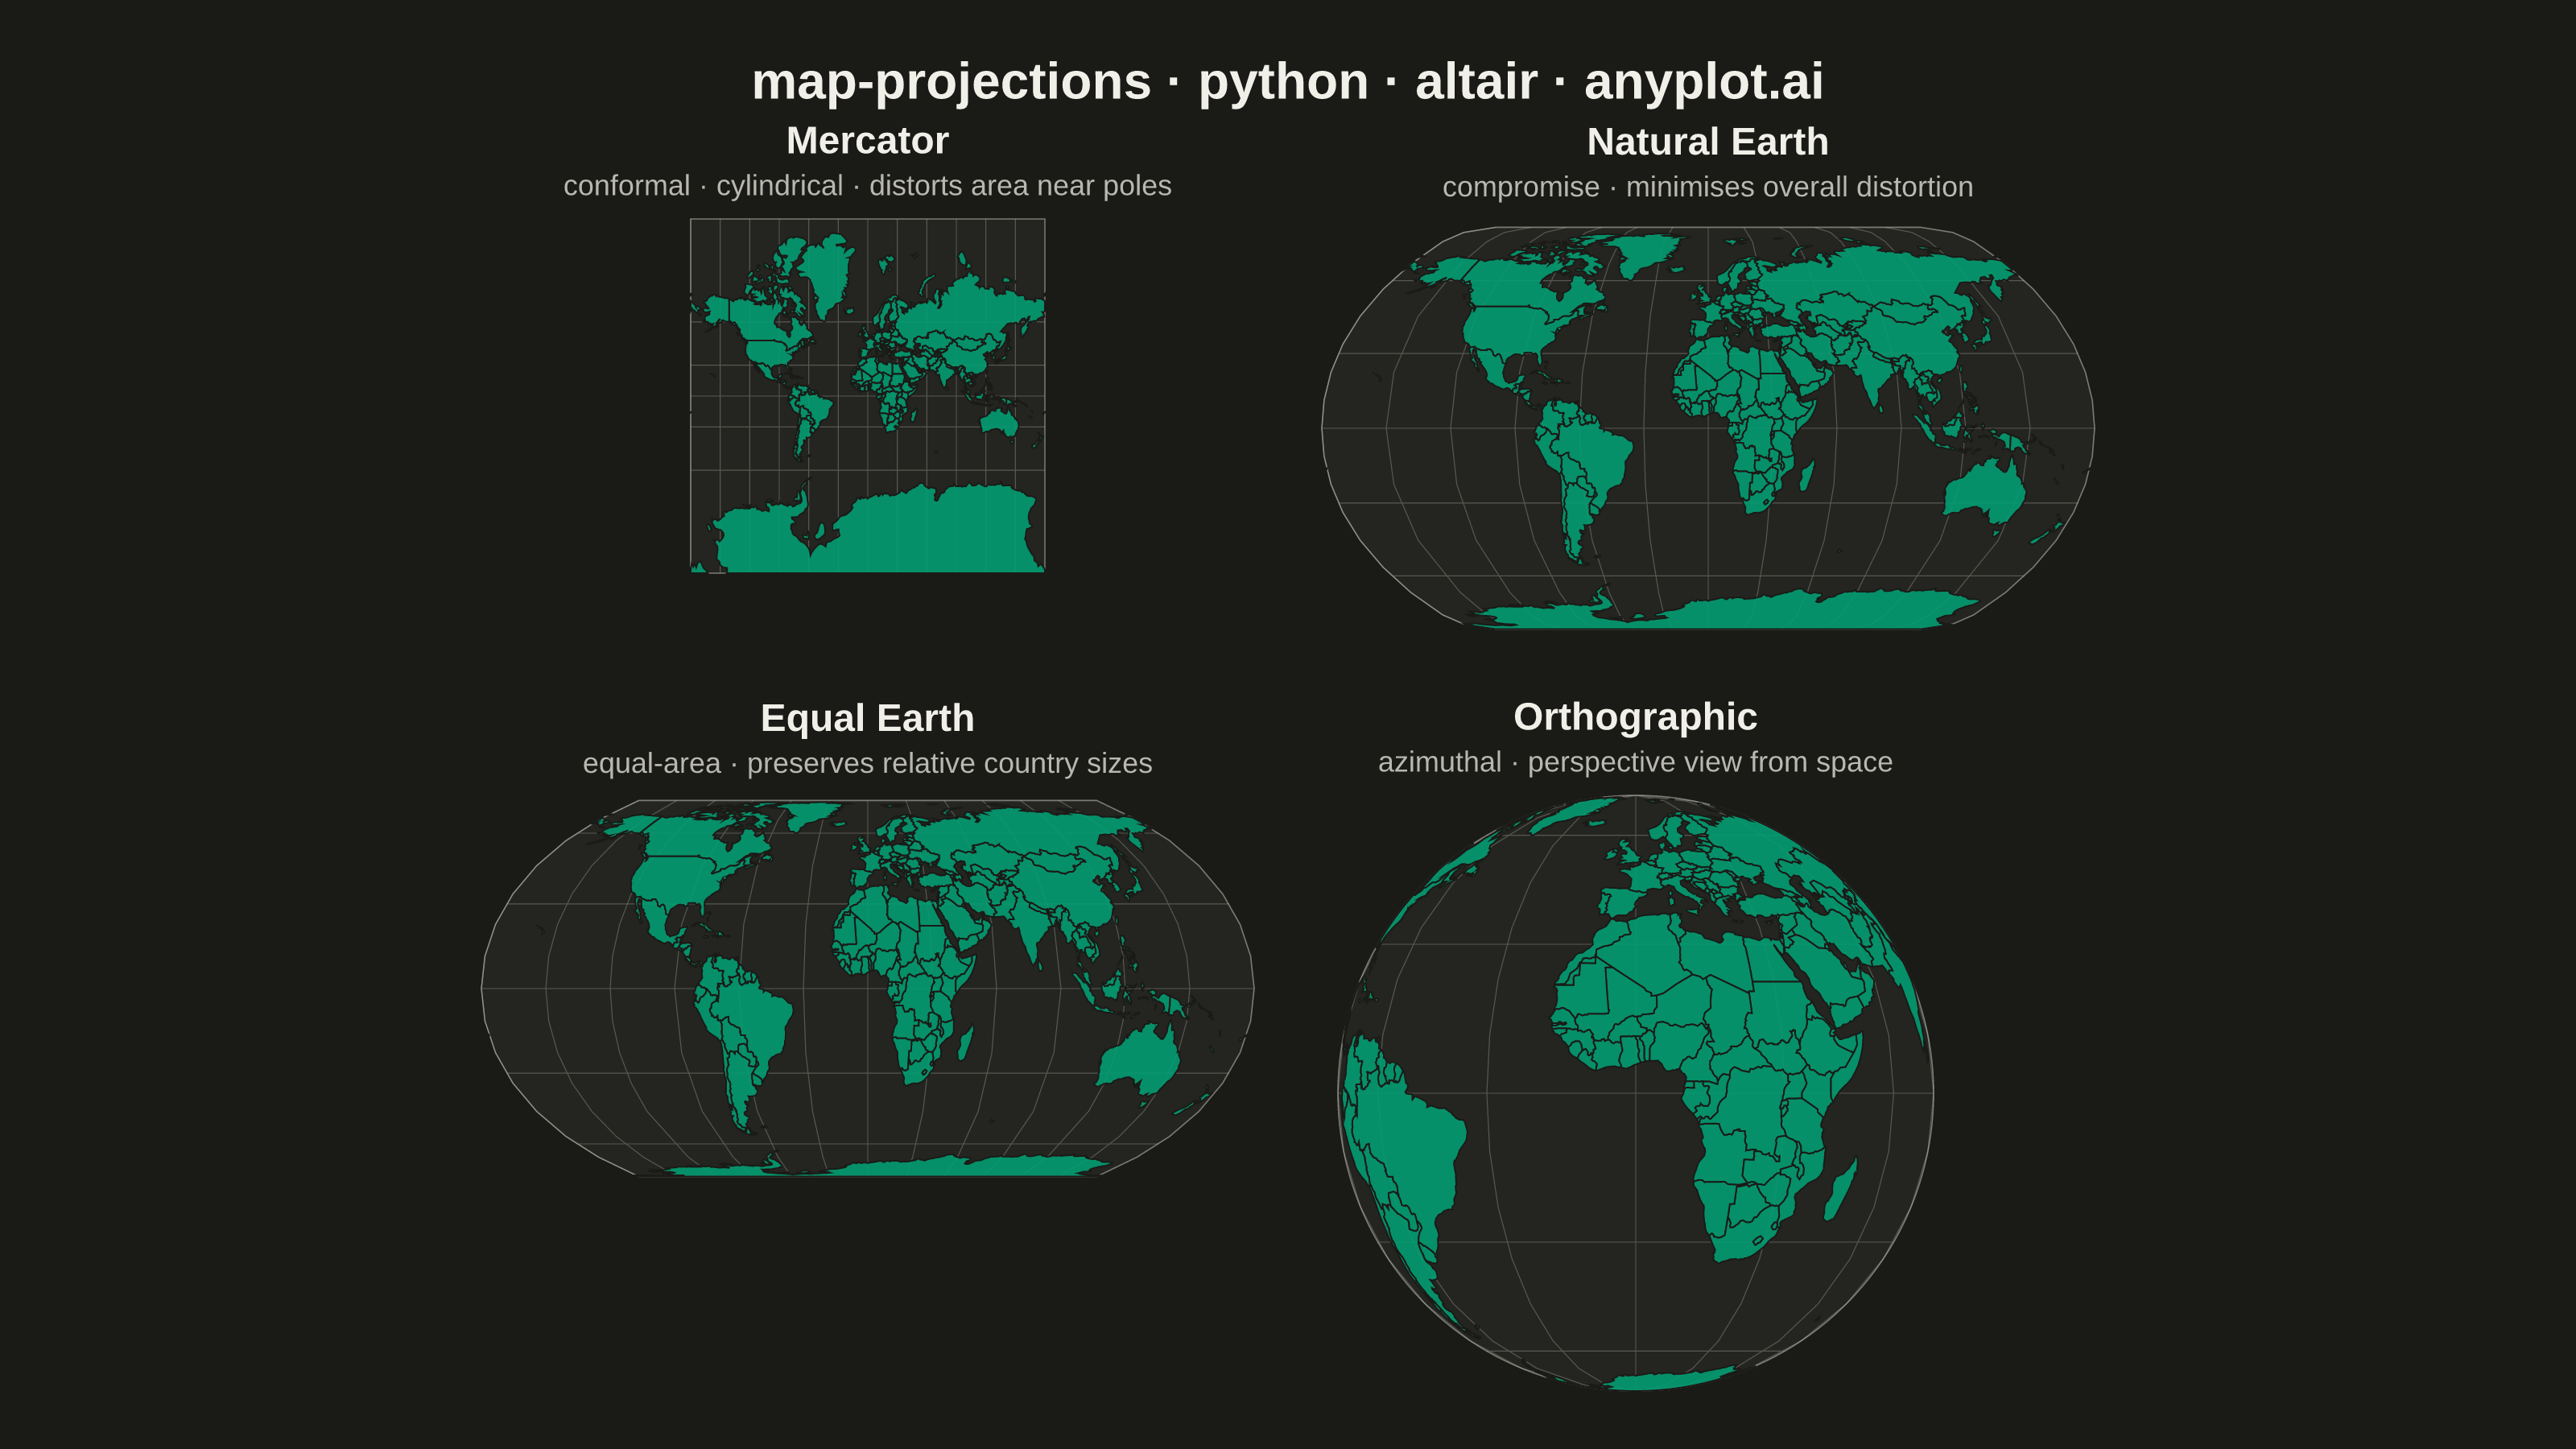
A world map demonstrating different cartographic projections and their distortion characteristics. This visualization showcases how the same geographic data appears under various map projections (Mercator, Robinson, Mollweide, Orthographic, etc.), revealing how each projection preserves or distorts area, shape, distance, or direction. The plot includes graticule (latitude/longitude grid lines) and optionally Tissot indicatrices to illustrate projection distortion patterns.
""" anyplot.ai
map-projections: World Map with Different Projections
Library: altair 6.1.0 | Python 3.13.13
Quality: 84/100 | Created: 2026-05-23
"""

import os
import sys


sys.path.pop(0)
import altair as alt
from PIL import Image


THEME = os.getenv("ANYPLOT_THEME", "light")
PAGE_BG = "#FAF8F1" if THEME == "light" else "#1A1A17"
ELEVATED_BG = "#FFFDF6" if THEME == "light" else "#242420"
INK = "#1A1A17" if THEME == "light" else "#F0EFE8"
INK_SOFT = "#4A4A44" if THEME == "light" else "#B8B7B0"

BRAND = "#009E73"

WORLD_URL = "https://cdn.jsdelivr.net/npm/[email protected]/data/world-110m.json"

MAIN_TITLE = "map-projections · python · altair · anyplot.ai"


def make_panel(proj_type, label, subtitle, w, h):
    sphere = alt.Chart(alt.sphere()).mark_geoshape(
        fill=ELEVATED_BG, stroke=INK_SOFT, strokeWidth=0.4, strokeOpacity=0.6
    )
    graticule = alt.Chart(alt.graticule(step=[30, 30])).mark_geoshape(
        filled=False, stroke=INK_SOFT, strokeWidth=0.3, strokeOpacity=0.35
    )
    countries = alt.Chart(alt.topo_feature(WORLD_URL, "countries")).mark_geoshape(
        fill=BRAND, stroke=PAGE_BG, strokeWidth=0.5, fillOpacity=0.88
    )
    return (
        (sphere + graticule + countries)
        .project(type=proj_type)
        .properties(
            width=w,
            height=h,
            title=alt.Title(
                text=label,
                subtitle=subtitle,
                fontSize=12,
                subtitleFontSize=9,
                color=INK,
                subtitleColor=INK_SOFT,
                anchor="middle",
            ),
        )
    )


# 4 projections in a 2×2 grid
# Mercator clips naturally at height=145 — avoids infinite polar distortion
map_mercator = make_panel("mercator", "Mercator", "conformal · cylindrical · distorts area near poles", 240, 110)
map_natural = make_panel("naturalEarth1", "Natural Earth", "compromise · minimises overall distortion", 240, 130)
map_equal_earth = make_panel("equalEarth", "Equal Earth", "equal-area · preserves relative country sizes", 240, 120)
map_orthographic = make_panel("orthographic", "Orthographic", "azimuthal · perspective view from space", 195, 185)

row1 = alt.hconcat(map_mercator, map_natural, spacing=20)
row2 = alt.hconcat(map_equal_earth, map_orthographic, spacing=20)

chart = (
    alt.vconcat(row1, row2, spacing=18)
    .properties(background=PAGE_BG, title=alt.Title(text=MAIN_TITLE, fontSize=16, color=INK, anchor="middle"))
    .configure_view(stroke=None)
)

chart.save(f"plot-{THEME}.png", scale_factor=4.0)

TW, TH = 3200, 1800
_img = Image.open(f"plot-{THEME}.png").convert("RGB")
_w, _h = _img.size
if _w > TW or _h > TH:
    raise SystemExit(
        f"altair vl-convert produced {_w}×{_h}, exceeds target {TW}×{TH}. "
        f"Shrink chart .properties(width=, height=) values and re-render."
    )
if _w < TW or _h < TH:
    _canvas = Image.new("RGB", (TW, TH), PAGE_BG)
    _canvas.paste(_img, ((TW - _w) // 2, (TH - _h) // 2))
    _canvas.save(f"plot-{THEME}.png")

chart.save(f"plot-{THEME}.html")
Runnable source as JSON, for any HTTP client: https://api.anyplot.ai/specs/map-projections/altair/code. Any spec id and library id listed in llms-full.txt fit the same URL shape; every URL below is complete and callable.
{
  "spec_id": "map-projections",
  "language": "python",
  "library": "altair",
  "page": "https://anyplot.ai/map-projections/python/altair",
  "hub": "https://anyplot.ai/map-projections",
  "code_json": "https://api.anyplot.ai/specs/map-projections/altair/code",
  "spec_json": "https://api.anyplot.ai/specs/map-projections",
  "render_light_png": "https://storage.googleapis.com/anyplot-images/plots/map-projections/python/altair/plot-light.png",
  "render_dark_png": "https://storage.googleapis.com/anyplot-images/plots/map-projections/python/altair/plot-dark.png",
  "interactive_light_html": "https://storage.googleapis.com/anyplot-images/plots/map-projections/python/altair/plot-light.html",
  "interactive_dark_html": "https://storage.googleapis.com/anyplot-images/plots/map-projections/python/altair/plot-dark.html",
  "quality_score": 84.0,
  "license": "MIT",
  "guide": "https://anyplot.ai/llms.txt"
}
Part of World Map with Different Projections on anyplot.ai.