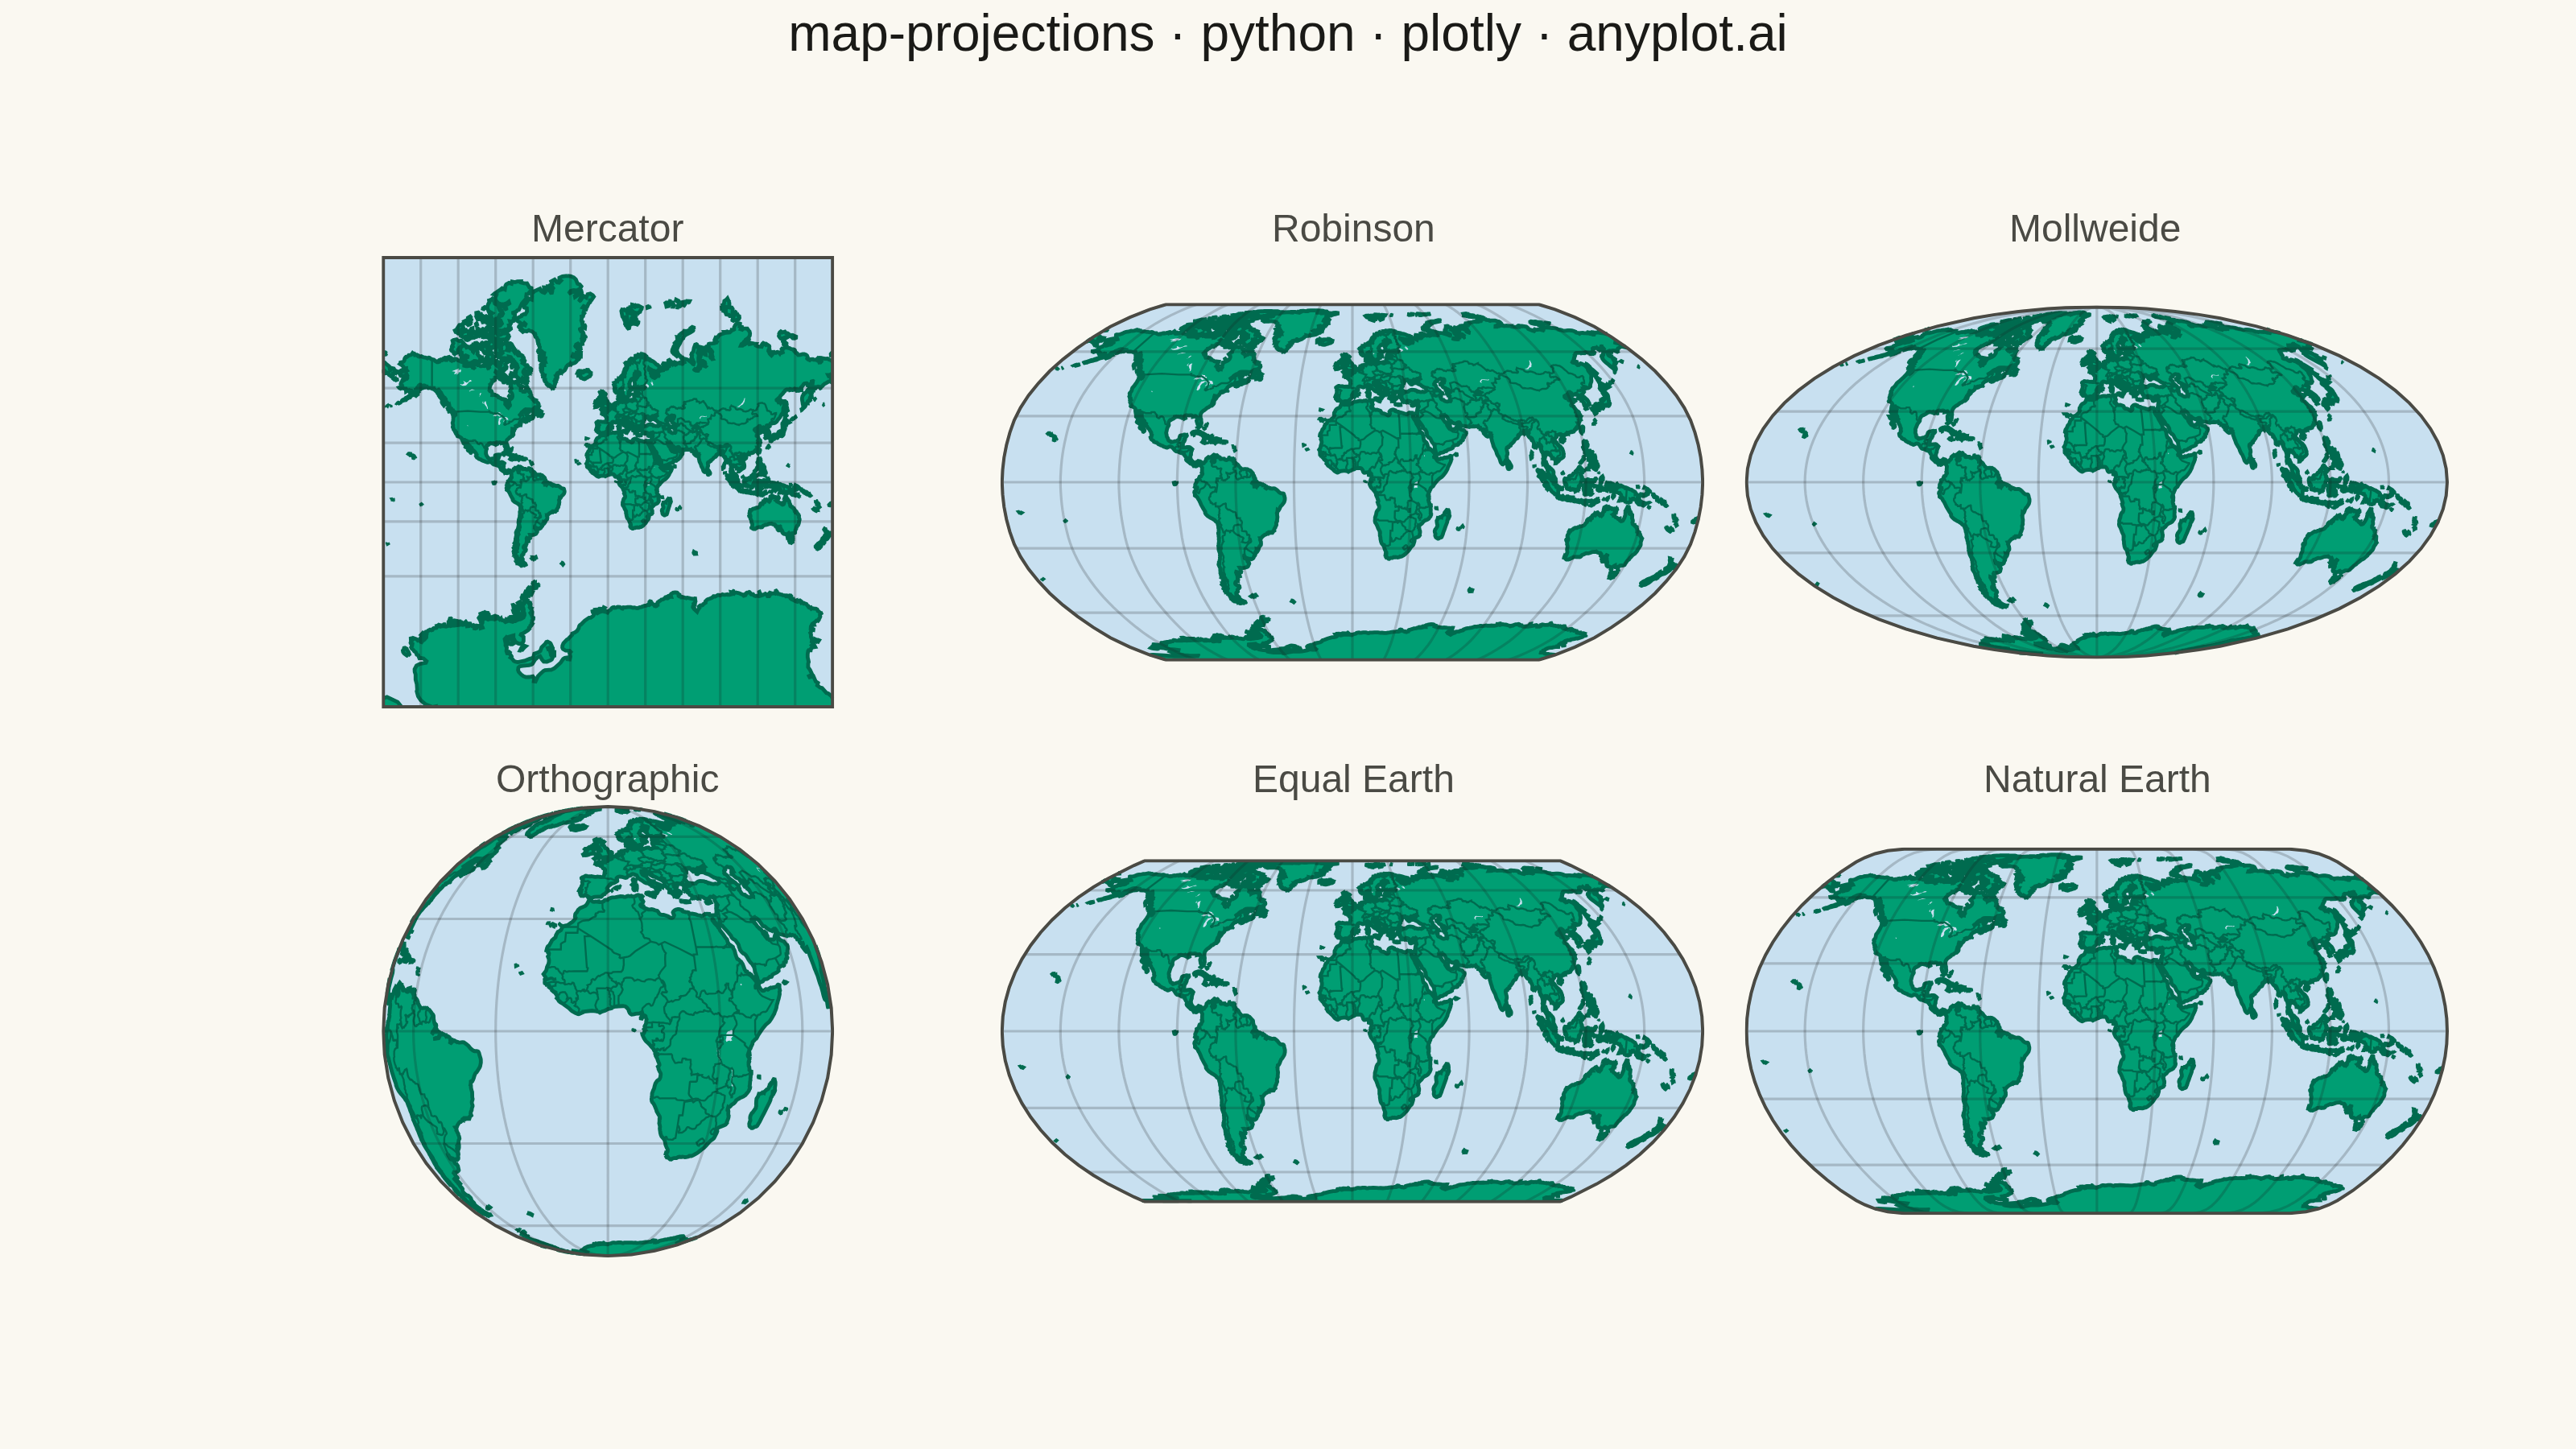
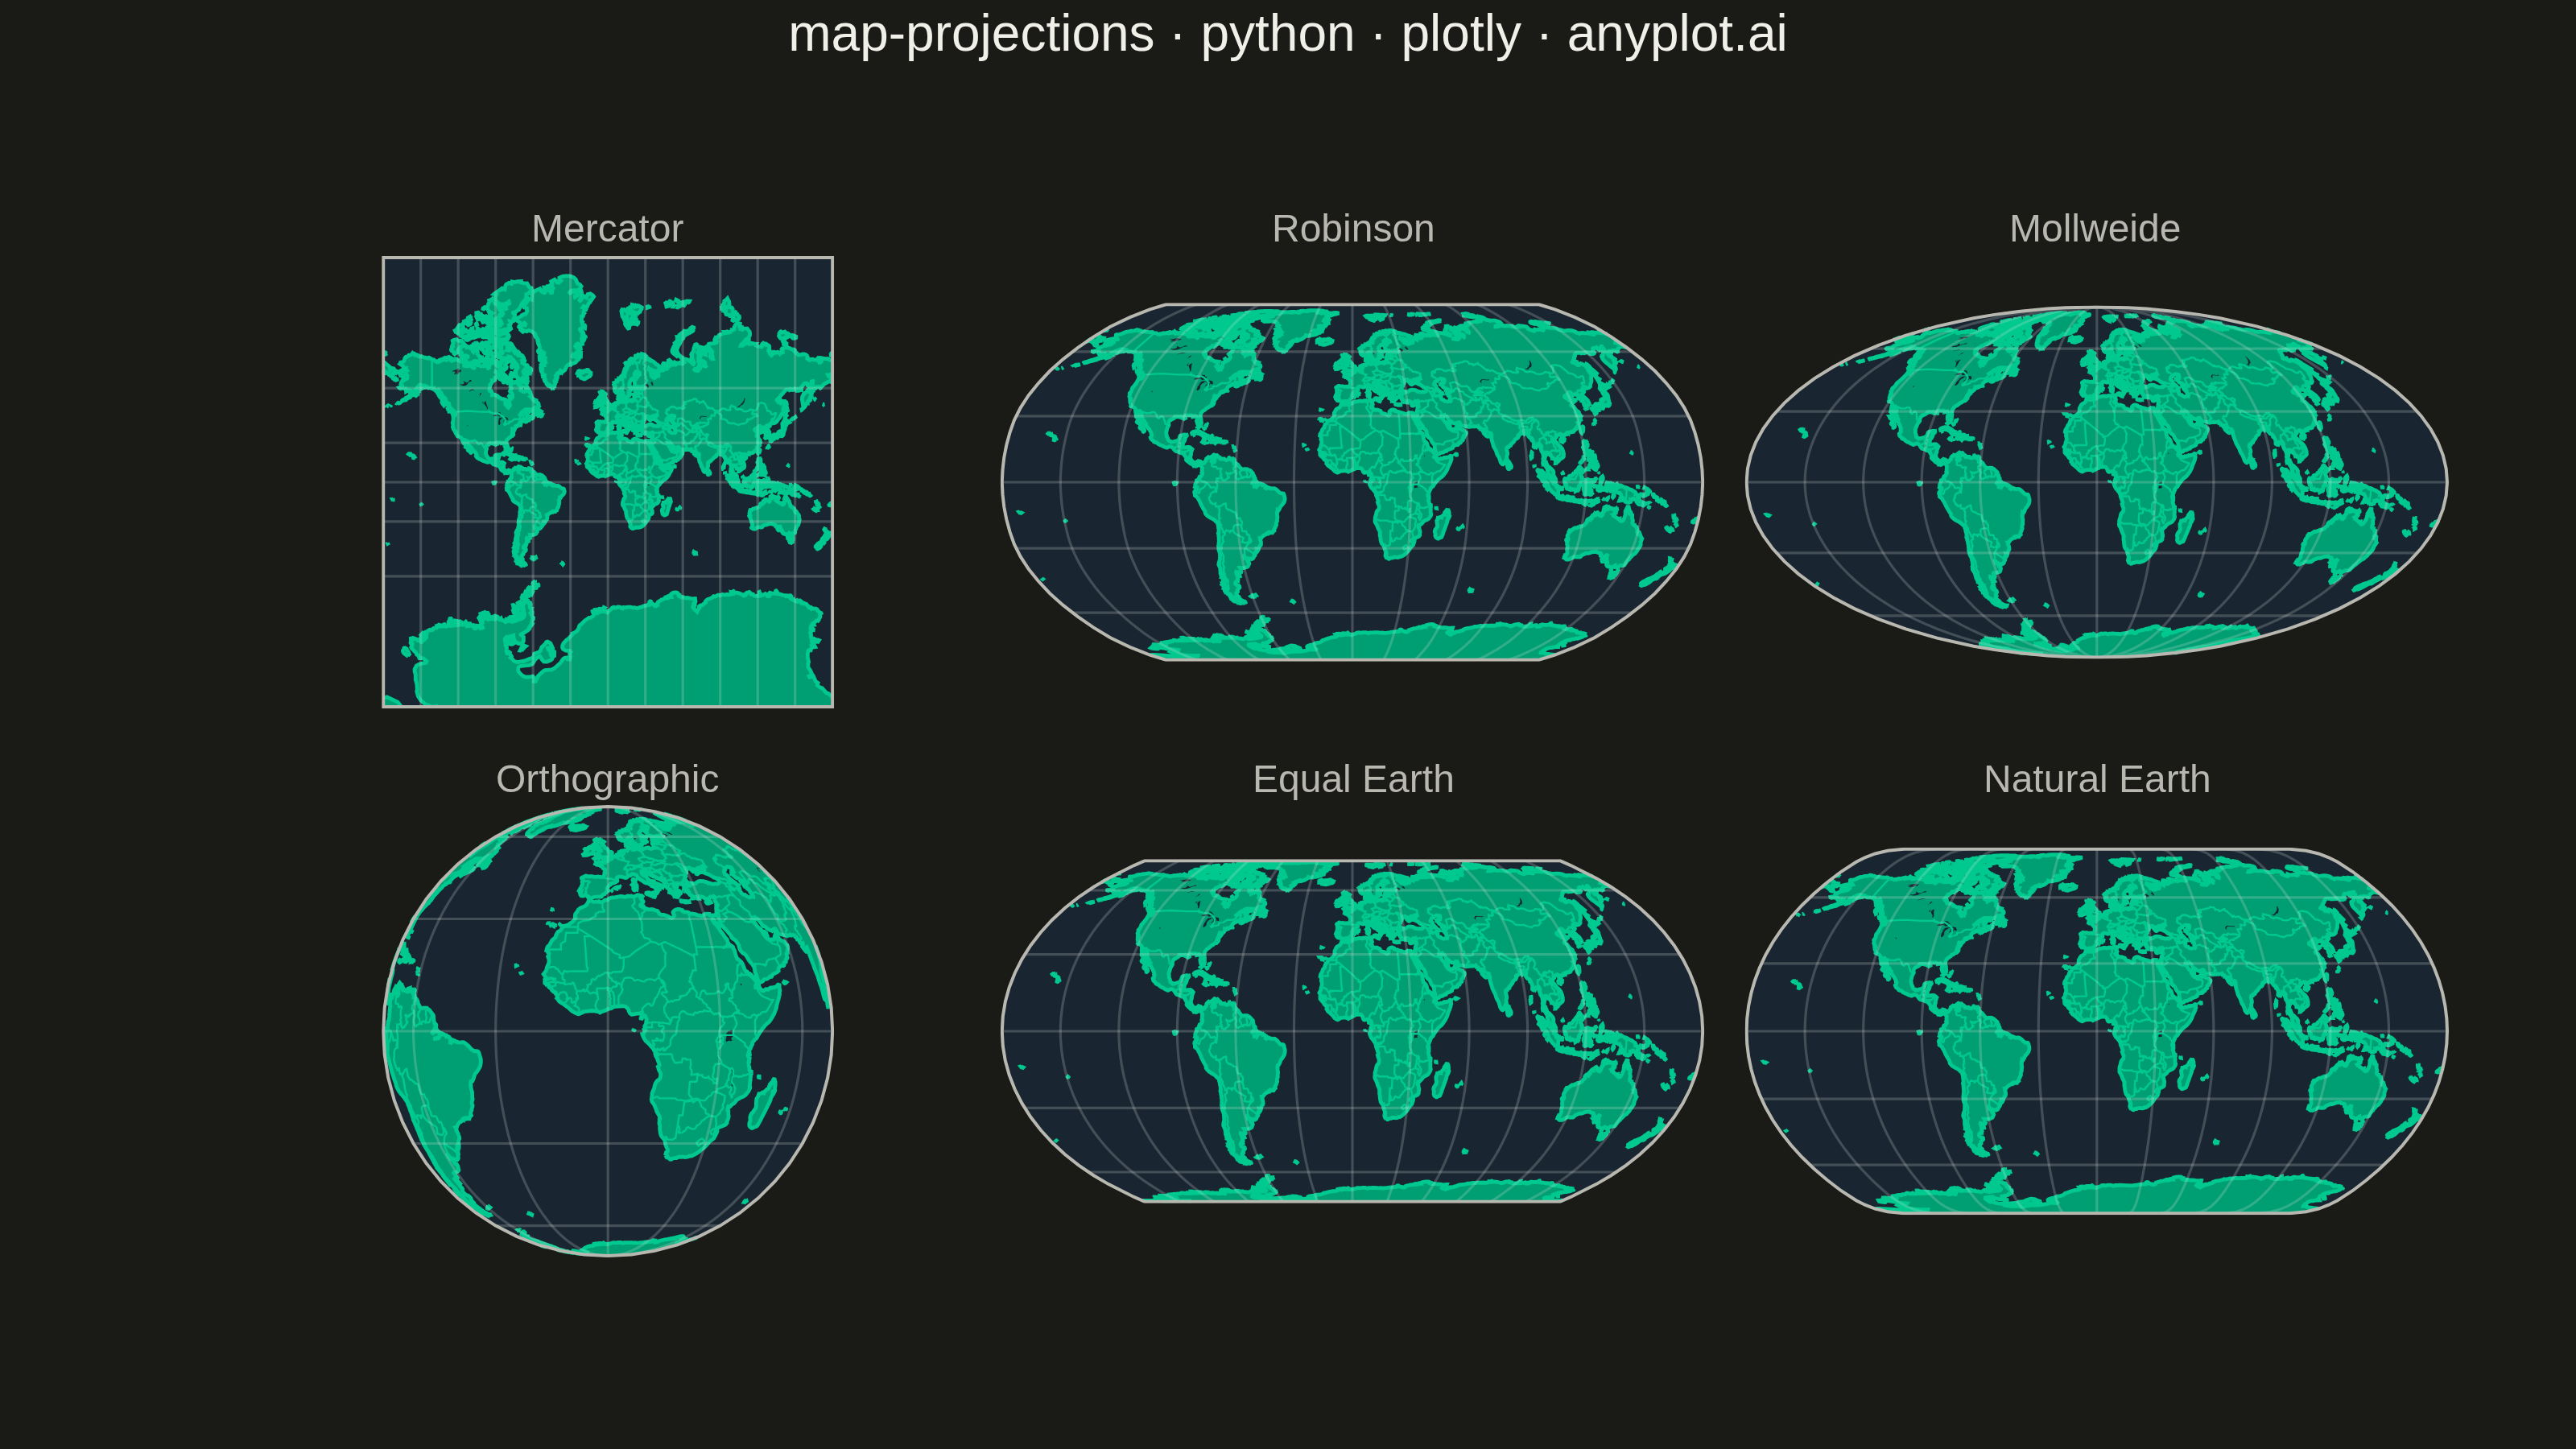
A world map demonstrating different cartographic projections and their distortion characteristics. This visualization showcases how the same geographic data appears under various map projections (Mercator, Robinson, Mollweide, Orthographic, etc.), revealing how each projection preserves or distorts area, shape, distance, or direction. The plot includes graticule (latitude/longitude grid lines) and optionally Tissot indicatrices to illustrate projection distortion patterns.
""" anyplot.ai
map-projections: World Map with Different Projections
Library: plotly 6.7.0 | Python 3.13.13
Quality: 88/100 | Updated: 2026-05-23
"""

import os

import plotly.graph_objects as go
from plotly.subplots import make_subplots


# Theme tokens
THEME = os.getenv("ANYPLOT_THEME", "light")
PAGE_BG = "#FAF8F1" if THEME == "light" else "#1A1A17"
INK = "#1A1A17" if THEME == "light" else "#F0EFE8"
INK_SOFT = "#4A4A44" if THEME == "light" else "#B8B7B0"

# Map geographic colors
LAND_COLOR = "#009E73"  # Imprint palette position 1 — consistent across themes
OCEAN_COLOR = "#C8E0F0" if THEME == "light" else "#192632"
COAST_COLOR = "#006B4F" if THEME == "light" else "#00C990"
GRATICULE = "rgba(26,26,23,0.20)" if THEME == "light" else "rgba(240,239,232,0.20)"

# Projections to showcase
projections = [
    {"name": "Mercator", "type": "mercator"},
    {"name": "Robinson", "type": "robinson"},
    {"name": "Mollweide", "type": "mollweide"},
    {"name": "Orthographic", "type": "orthographic"},
    {"name": "Equal Earth", "type": "equal earth"},
    {"name": "Natural Earth", "type": "natural earth"},
]

# Create 2×3 subplot grid of geo maps
fig = make_subplots(
    rows=2,
    cols=3,
    subplot_titles=[p["name"] for p in projections],
    specs=[[{"type": "geo"}, {"type": "geo"}, {"type": "geo"}], [{"type": "geo"}, {"type": "geo"}, {"type": "geo"}]],
    horizontal_spacing=0.02,
    vertical_spacing=0.10,
)

# Add each projection as a geo subplot
for idx, proj in enumerate(projections):
    row = idx // 3 + 1
    col = idx % 3 + 1
    geo_key = f"geo{idx + 1}" if idx > 0 else "geo"

    fig.add_trace(go.Scattergeo(lon=[], lat=[], mode="markers", showlegend=False, geo=geo_key), row=row, col=col)

    fig.update_layout(
        **{
            geo_key: {
                "projection_type": proj["type"],
                "showland": True,
                "landcolor": LAND_COLOR,
                "showocean": True,
                "oceancolor": OCEAN_COLOR,
                "showcoastlines": True,
                "coastlinecolor": COAST_COLOR,
                "coastlinewidth": 1.2,
                "showcountries": True,
                "countrycolor": COAST_COLOR,
                "countrywidth": 0.6,
                "showlakes": True,
                "lakecolor": OCEAN_COLOR,
                "showframe": True,
                "framecolor": INK_SOFT,
                "framewidth": 1,
                "lataxis": {"showgrid": True, "gridcolor": GRATICULE, "gridwidth": 0.8, "dtick": 30},
                "lonaxis": {"showgrid": True, "gridcolor": GRATICULE, "gridwidth": 0.8, "dtick": 30},
                "bgcolor": PAGE_BG,
            }
        }
    )

# Overall layout
fig.update_layout(
    autosize=False,
    title={
        "text": "map-projections · python · plotly · anyplot.ai",
        "font": {"size": 16, "color": INK},
        "x": 0.5,
        "xanchor": "center",
        "y": 0.99,
    },
    showlegend=False,
    paper_bgcolor=PAGE_BG,
    plot_bgcolor=PAGE_BG,
    margin={"l": 80, "r": 40, "t": 80, "b": 60},
)

# Subplot title styling
fig.update_annotations(font={"size": 12, "color": INK_SOFT})

# Save
fig.write_image(f"plot-{THEME}.png", width=800, height=450, scale=4)
fig.write_html(f"plot-{THEME}.html", include_plotlyjs="cdn")
Runnable source as JSON, for any HTTP client: https://api.anyplot.ai/specs/map-projections/plotly/code. Any spec id and library id listed in llms-full.txt fit the same URL shape; every URL below is complete and callable.
{
  "spec_id": "map-projections",
  "language": "python",
  "library": "plotly",
  "page": "https://anyplot.ai/map-projections/python/plotly",
  "hub": "https://anyplot.ai/map-projections",
  "code_json": "https://api.anyplot.ai/specs/map-projections/plotly/code",
  "spec_json": "https://api.anyplot.ai/specs/map-projections",
  "render_light_png": "https://storage.googleapis.com/anyplot-images/plots/map-projections/python/plotly/plot-light.png",
  "render_dark_png": "https://storage.googleapis.com/anyplot-images/plots/map-projections/python/plotly/plot-dark.png",
  "interactive_light_html": "https://storage.googleapis.com/anyplot-images/plots/map-projections/python/plotly/plot-light.html",
  "interactive_dark_html": "https://storage.googleapis.com/anyplot-images/plots/map-projections/python/plotly/plot-dark.html",
  "quality_score": 88.0,
  "license": "MIT",
  "guide": "https://anyplot.ai/llms.txt"
}
Part of World Map with Different Projections on anyplot.ai.