The same plot in 14 other libraries — JavaScript: Chart.js, D3.js, Apache ECharts, Highcharts; Python: Altair, Bokeh, lets-plot, Matplotlib, Plotly, plotnine, Pygal, Seaborn; R: ggplot2; Julia: Makie.jl. Compare all 15 side by side: World Map with Different Projections in Python, R, Julia and JavaScript.
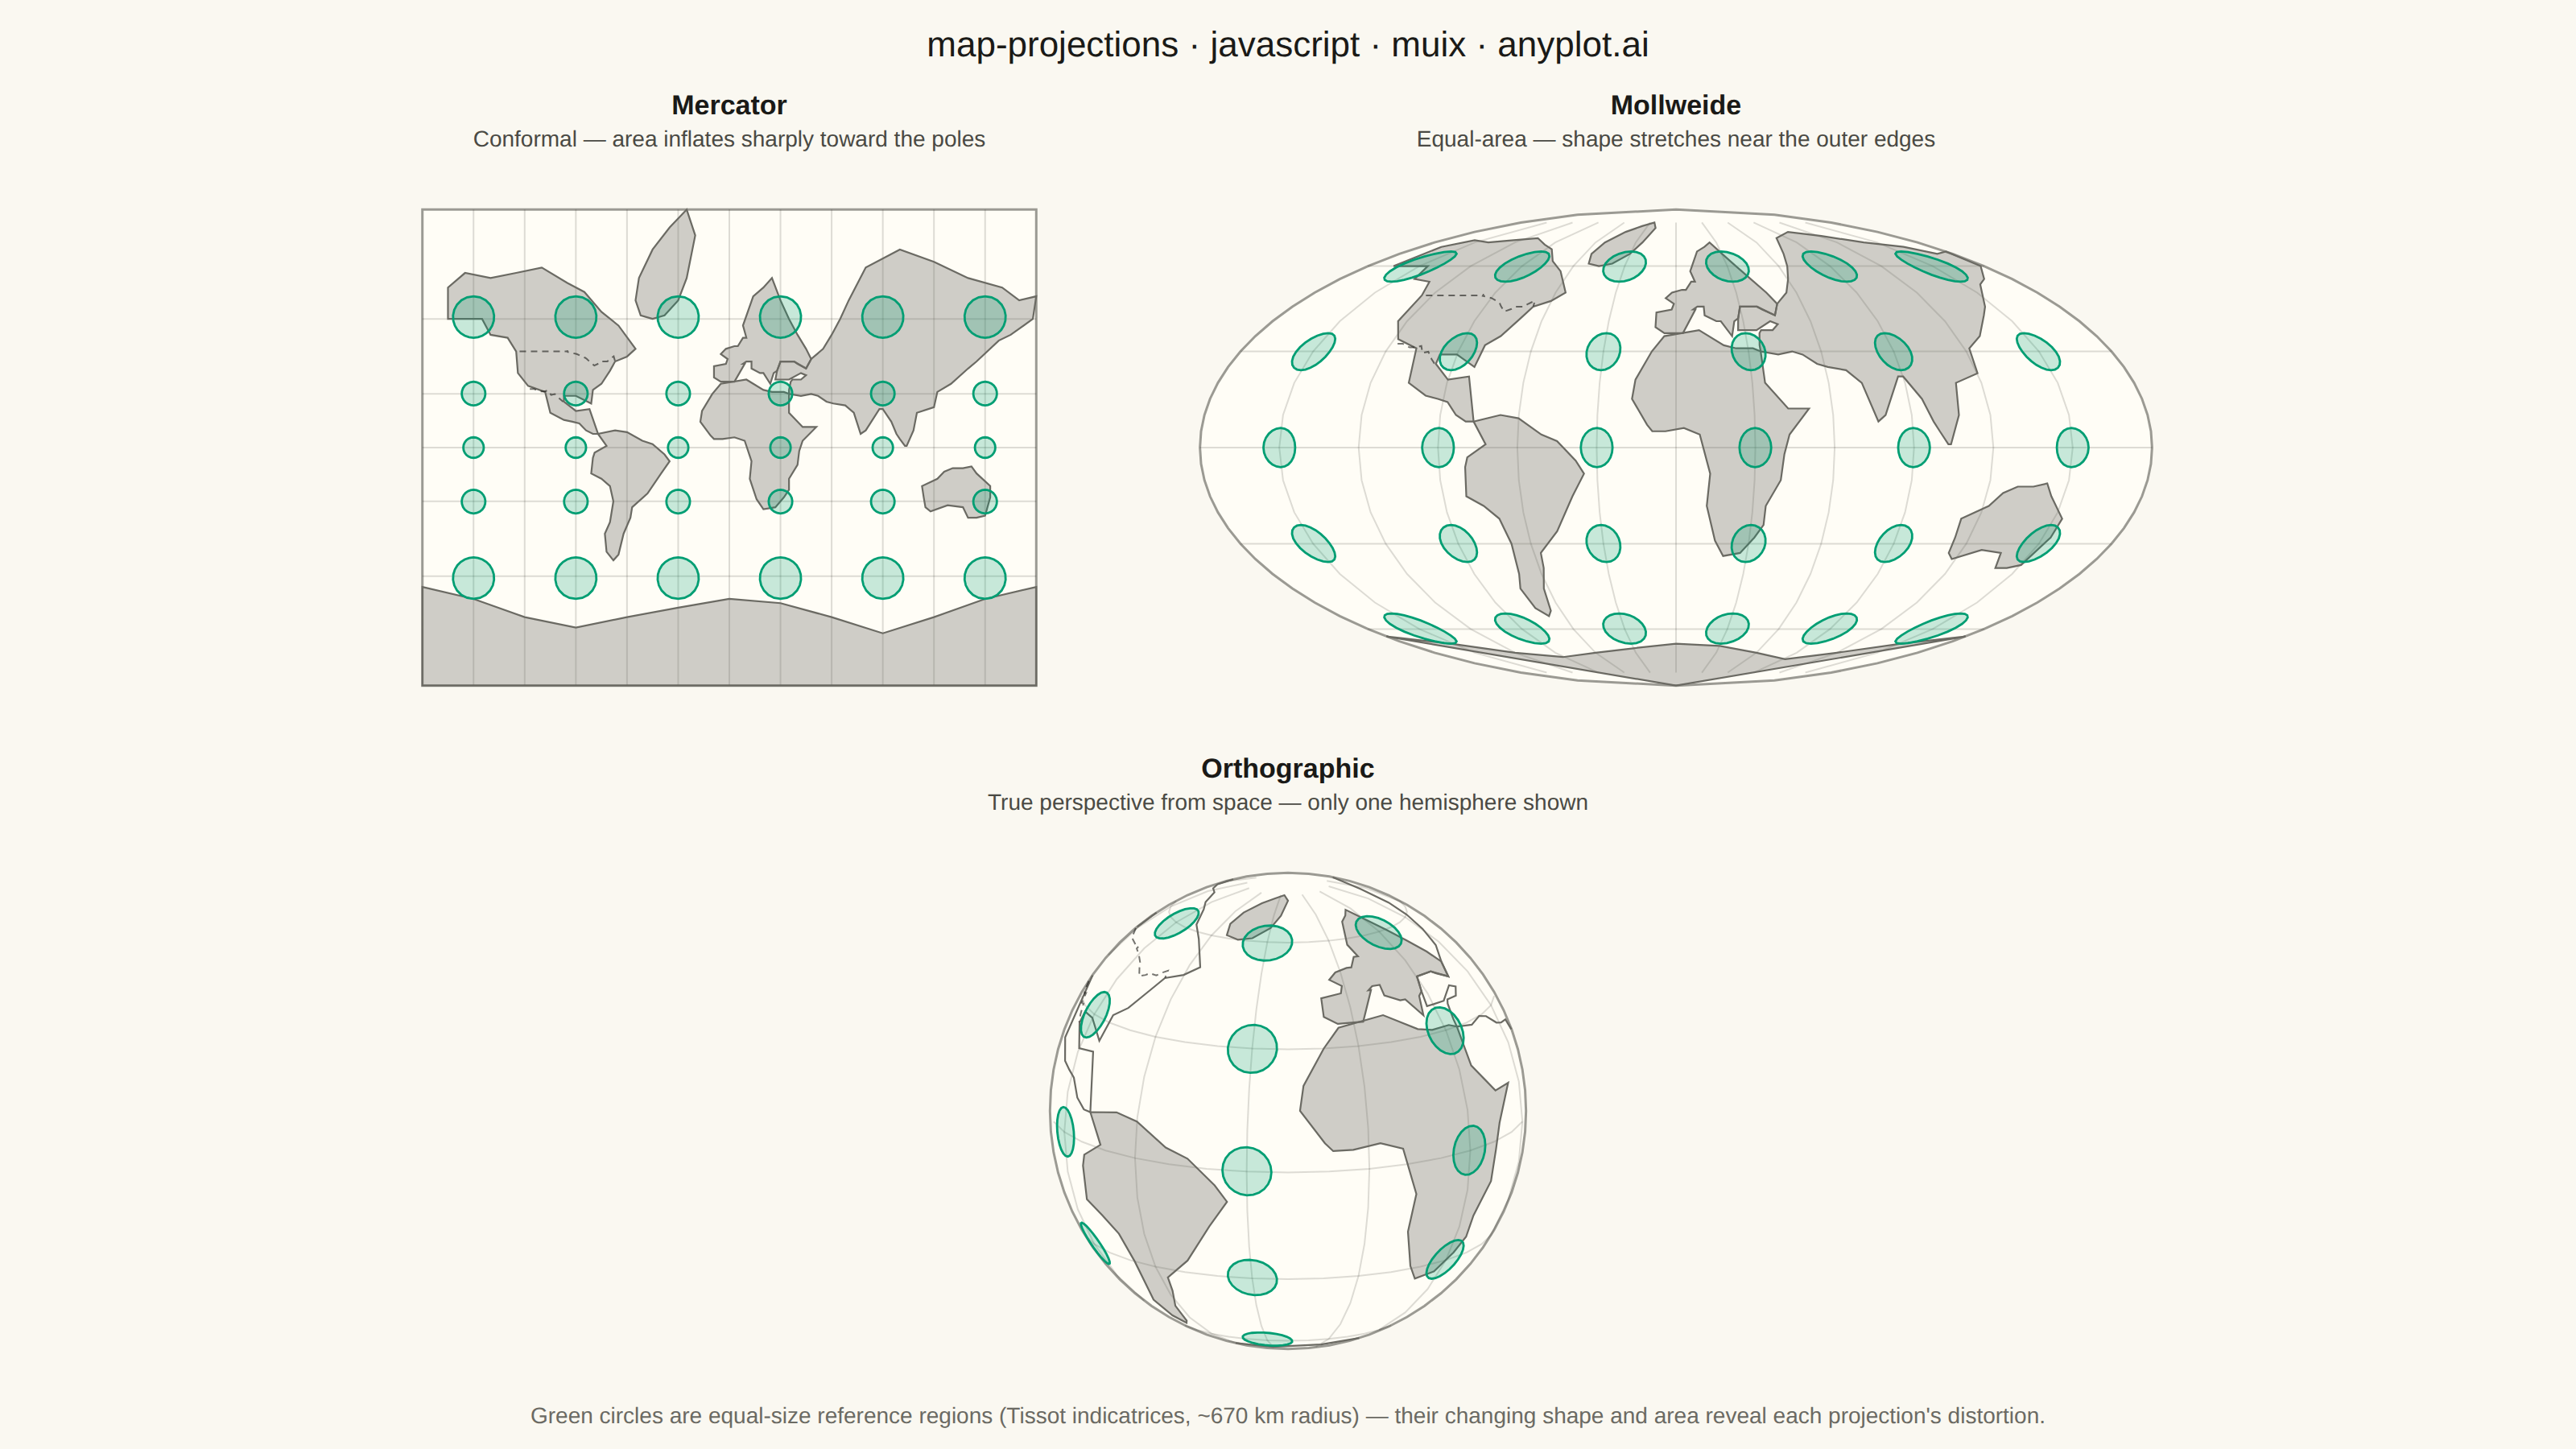
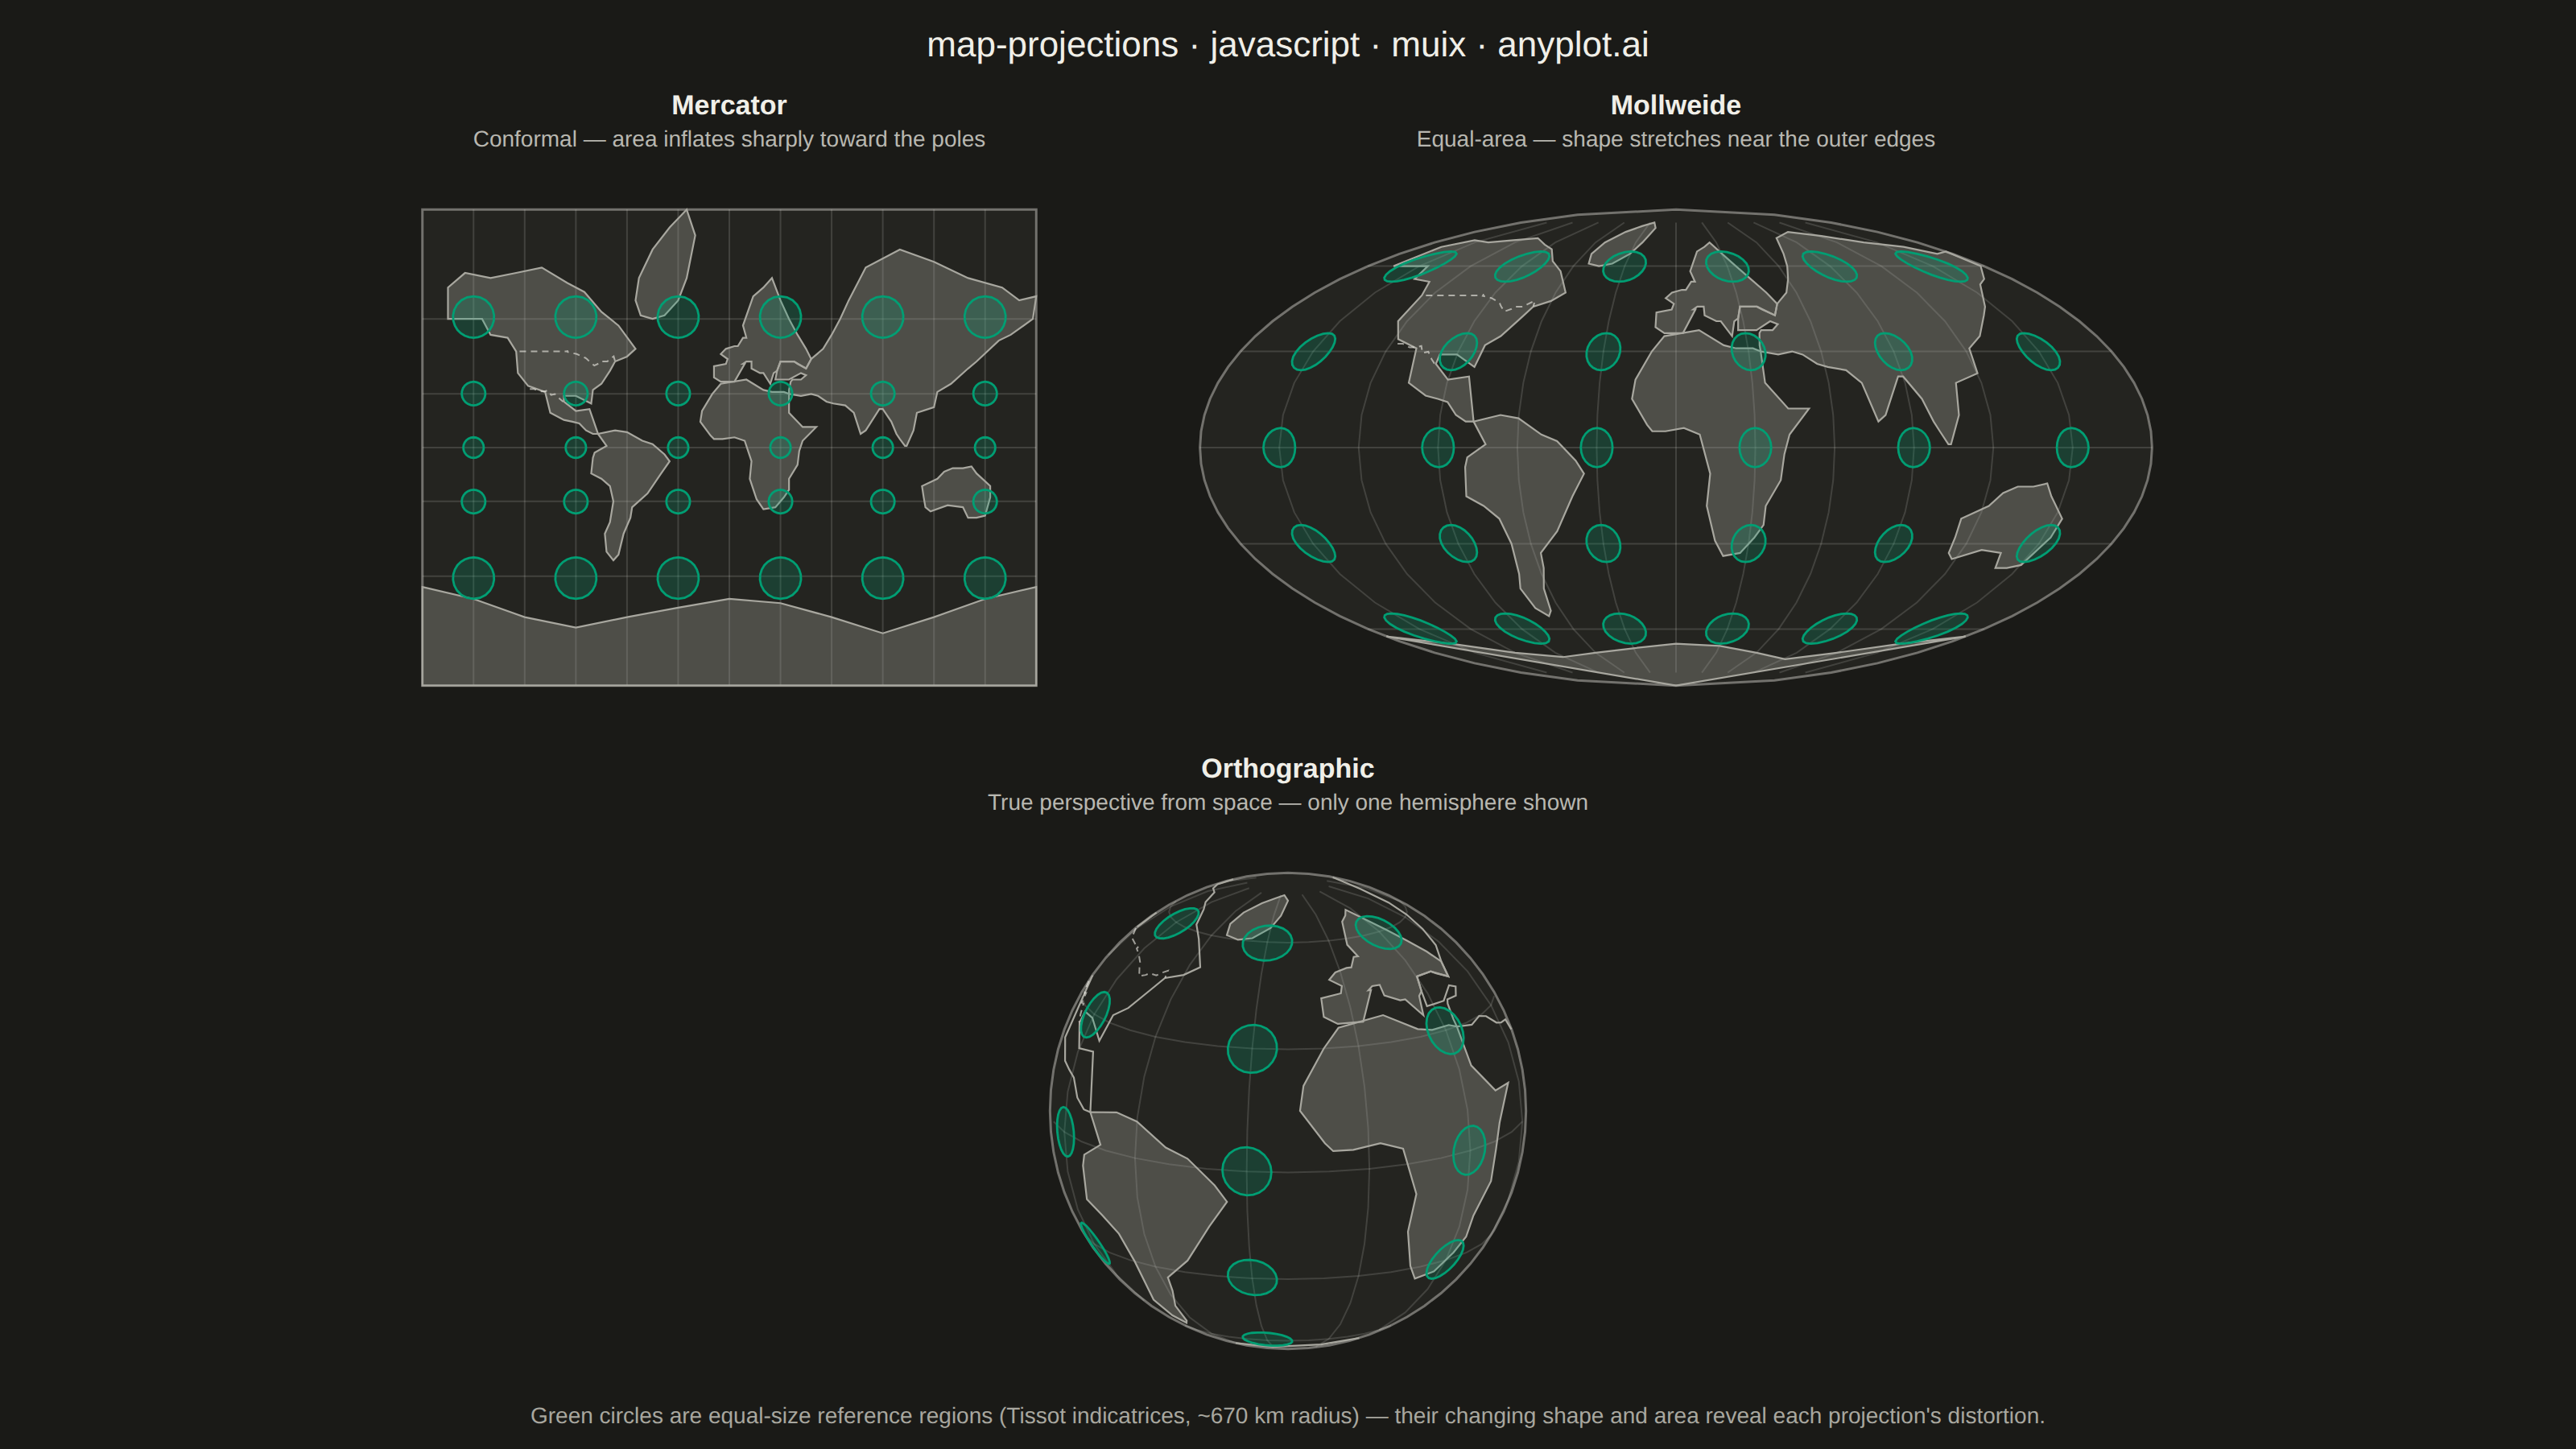
A world map demonstrating different cartographic projections and their distortion characteristics. This visualization showcases how the same geographic data appears under various map projections (Mercator, Robinson, Mollweide, Orthographic, etc.), revealing how each projection preserves or distorts area, shape, distance, or direction. The plot includes graticule (latitude/longitude grid lines) and optionally Tissot indicatrices to illustrate projection distortion patterns.
// anyplot.ai
// map-projections: World Map with Different Projections
// Library: muix 7.29.1 | JavaScript 22.23.2
// Quality: 85/100 | Created: 2026-08-26
//# anyplot-orientation: landscape
// anyplot.ai
// map-projections: World Map with Different Projections
// Library: MUI X Charts | React | Node 22
// License: @mui/x-charts — MIT (community). Pro/Premium are out of scope.
// Quality: pending | Created: 2026-08-26
import { ChartContainer } from "@mui/x-charts/ChartContainer";
import { useXScale, useYScale } from "@mui/x-charts/hooks";
const t = window.ANYPLOT_TOKENS;
const THEME = window.ANYPLOT_THEME === "dark" ? "dark" : "light";
// The community @mui/x-charts token set exposes ink/inkSoft but not a
// separate "muted" anchor — derive it locally (same hex the style guide
// assigns to the tertiary-text / muted-anchor role) for land fill + captions.
const INK_MUTED = THEME === "dark" ? "#A8A79F" : "#6B6A63";
const TITLE = "map-projections · javascript · muix · anyplot.ai";
// --- Simplified world outline (in-memory, deterministic; ~200 hand-traced
// vertices, not survey-accurate). @mui/x-charts has no polygon/basemap
// primitive, so continents are plain [lon, lat] point lists that we project
// ourselves and hand to a MUI X ChartContainer purely for its linear pixel
// scale + theming — the same "custom SVG overlay over a chart coordinate
// system" technique used for the connection-lines and geographic-hexbin maps,
// applied through three different non-linear projection functions instead of
// one flat equirectangular one. --------------------------------------------
const CONTINENTS = [
{
name: "North America",
points: [
[-165, 68], [-165, 60], [-145, 60], [-140, 55], [-130, 54], [-125, 49],
[-124, 40], [-118, 34], [-108, 31], [-105, 20], [-97, 16], [-92, 15],
[-88, 14], [-84, 10], [-80, 8], [-77, 8], [-82, 22], [-90, 21],
[-97, 26], [-97, 29], [-90, 29], [-81, 25], [-80, 32], [-75, 35],
[-70, 41], [-67, 45], [-60, 47], [-55, 50], [-65, 58], [-75, 62],
[-85, 67], [-95, 69], [-110, 72], [-125, 71], [-140, 70], [-155, 71],
[-165, 68],
],
},
{
name: "Greenland",
points: [
[-45, 60], [-52, 61], [-55, 65], [-53, 70], [-45, 75], [-35, 78],
[-25, 80], [-20, 77], [-25, 70], [-30, 65], [-38, 61], [-45, 60],
],
},
{
name: "South America",
points: [
[-77, 8], [-72, 1], [-79, -3], [-80, -6], [-81, -15], [-75, -18],
[-70, -22], [-68, -30], [-70, -40], [-73, -45], [-72, -52], [-68, -55],
[-65, -53], [-62, -45], [-58, -38], [-57, -33], [-48, -26], [-40, -15],
[-35, -8], [-38, -4], [-45, 2], [-51, 4], [-60, 9], [-67, 10], [-77, 8],
],
},
{
name: "Africa",
points: [
[-17, 15], [-16, 21], [-10, 30], [-5, 35], [10, 37], [20, 32],
[25, 31], [32, 31], [35, 30], [35, 20], [43, 12], [51, 12], [43, 4],
[41, -2], [40, -10], [35, -18], [35, -24], [32, -28], [27, -33],
[20, -34], [16, -29], [12, -18], [13, -8], [9, 4], [3, 6], [-4, 5],
[-9, 5], [-11, 7], [-17, 15],
],
},
{
name: "Europe",
points: [
[-9, 43], [-9, 38], [-5, 36], [3, 36], [9, 44], [8, 44], [10, 45],
[13, 45], [13, 42], [18, 40], [20, 40], [24, 35], [26, 40], [28, 41],
[30, 45], [38, 45], [40, 44], [45, 42], [48, 46], [45, 50], [40, 55],
[35, 60], [30, 65], [25, 70], [20, 68], [14, 66], [8, 58], [10, 54],
[8, 54], [5, 51], [3, 51], [-2, 50], [-5, 48], [-1, 46], [-2, 44],
[-9, 43],
],
},
{
name: "Asia",
points: [
[30, 45], [38, 45], [45, 42], [48, 46], [55, 50], [60, 55], [65, 60],
[70, 65], [80, 72], [100, 75], [120, 73], [140, 70], [160, 68],
[170, 65], [180, 66], [178, 60], [165, 55], [158, 53], [145, 45],
[140, 42], [130, 35], [122, 31], [120, 23], [110, 20], [108, 10],
[104, 1], [103, 1], [100, 5], [98, 8], [95, 15], [90, 22], [88, 22],
[80, 10], [77, 8], [73, 20], [68, 24], [61, 25], [57, 26], [52, 29],
[48, 30], [42, 29], [35, 30], [35, 32], [36, 36], [37, 37], [42, 37],
[45, 39], [42, 40], [35, 37], [30, 37], [27, 37], [28, 41], [30, 45],
],
},
{
name: "Australia",
points: [
[113, -22], [114, -28], [115, -33], [118, -35], [128, -32], [137, -33],
[140, -38], [145, -38], [150, -37], [153, -28], [153, -22], [145, -15],
[142, -11], [137, -12], [131, -12], [126, -14], [122, -18], [113, -22],
],
},
{
name: "Antarctica",
points: [
[-180, -63], [-150, -66], [-120, -70], [-90, -72], [-60, -70],
[-30, -68], [0, -66], [30, -67], [60, -70], [90, -73], [120, -70],
[150, -66], [180, -63], [180, -90], [-180, -90], [-180, -63],
],
},
];
// A few well-known, non-disputed border lines (not a full country layer --
// @mui/x-charts has no geo primitive and hand-tracing all ~200 country
// borders accurately/neutrally is out of scope) to partially answer the
// spec's "country borders" ask without risking disputed-boundary inaccuracy.
const COUNTRY_BORDERS = [
{
// US-Canada: Pacific coast along the 49th parallel, then the Great
// Lakes / St. Lawrence corridor to the Atlantic.
points: [
[-123, 49], [-110, 49], [-95, 49], [-95, 49.4], [-94.8, 48.8], [-89.5, 48],
[-84.5, 46.5], [-83.5, 46], [-82.5, 45.3], [-79.2, 43.3], [-76.5, 44.2],
[-75.3, 45], [-71.5, 45], [-70.3, 45.9], [-67.8, 47.1], [-67, 45.1],
],
},
{
// US-Mexico: Pacific coast to the Gulf of Mexico, roughly the Rio Grande.
points: [
[-117, 32.5], [-114.8, 32.5], [-111, 31.3], [-108.2, 31.3], [-106.5, 31.8],
[-104.5, 29.5], [-102.3, 29.9], [-99.5, 27.5], [-97.5, 26],
],
},
];
const MERIDIANS = [-150, -120, -90, -60, -30, 0, 30, 60, 90, 120, 150];
const PARALLELS = [-60, -30, 0, 30, 60];
const TISSOT_LATS = [-60, -30, 0, 30, 60];
const TISSOT_LONS = [-150, -90, -30, 30, 90, 150];
const TISSOT_RHO_DEG = 6; // angular radius of each reference circle on the sphere
// --- Spherical helpers -------------------------------------------------------
function toRad(deg) {
return (deg * Math.PI) / 180;
}
// Destination point at bearing/angular-distance from a lat/lon origin
// (great-circle "direct" formula) — used to trace Tissot indicatrix circles.
function destPoint(lonDeg, latDeg, bearingRad, rhoRad) {
const lat1 = toRad(latDeg);
const lon1 = toRad(lonDeg);
const lat2 = Math.asin(
Math.sin(lat1) * Math.cos(rhoRad) + Math.cos(lat1) * Math.sin(rhoRad) * Math.cos(bearingRad),
);
const lon2 =
lon1 +
Math.atan2(
Math.sin(bearingRad) * Math.sin(rhoRad) * Math.cos(lat1),
Math.cos(rhoRad) - Math.sin(lat1) * Math.sin(lat2),
);
const lonDeg2 = ((((lon2 * 180) / Math.PI) + 540) % 360) - 180;
return [lonDeg2, (lat2 * 180) / Math.PI];
}
function tissotCircle(lonDeg, latDeg, rhoDeg, n) {
const rhoRad = toRad(rhoDeg);
const pts = [];
for (let i = 0; i <= n; i += 1) {
pts.push(destPoint(lonDeg, latDeg, (i / n) * 2 * Math.PI, rhoRad));
}
return pts;
}
// --- Projections: [lon, lat] in degrees -> [X, Y] in projection units, or
// null when the point falls on the far side of the globe (orthographic). ---
const MERC_LAT_CLIP = 80;
function projMercator([lon, lat]) {
const clat = Math.max(-MERC_LAT_CLIP, Math.min(MERC_LAT_CLIP, lat));
return [toRad(lon), Math.log(Math.tan(Math.PI / 4 + toRad(clat) / 2))];
}
function mollweideTheta(latRad) {
if (Math.abs(Math.abs(latRad) - Math.PI / 2) < 1e-9) return Math.sign(latRad) * (Math.PI / 2);
let theta = latRad;
for (let i = 0; i < 10; i += 1) {
const denom = 2 + 2 * Math.cos(2 * theta);
if (Math.abs(denom) < 1e-9) break;
theta -= (2 * theta + Math.sin(2 * theta) - Math.PI * Math.sin(latRad)) / denom;
}
return theta;
}
function projMollweide([lon, lat]) {
const theta = mollweideTheta(toRad(lat));
const x = ((2 * Math.SQRT2) / Math.PI) * toRad(lon) * Math.cos(theta);
const y = Math.SQRT2 * Math.sin(theta);
return [x, y];
}
const ORTHO_LON0 = -20;
const ORTHO_LAT0 = 15;
function projOrthographic([lon, lat]) {
const latR = toRad(lat);
const lonR = toRad(lon);
const lat0R = toRad(ORTHO_LAT0);
const lon0R = toRad(ORTHO_LON0);
const cosc = Math.sin(lat0R) * Math.sin(latR) + Math.cos(lat0R) * Math.cos(latR) * Math.cos(lonR - lon0R);
if (cosc < 0.001) return null;
const x = Math.cos(latR) * Math.sin(lonR - lon0R);
const y = Math.cos(lat0R) * Math.sin(latR) - Math.sin(lat0R) * Math.cos(latR) * Math.cos(lonR - lon0R);
return [x, y];
}
const PROJECTIONS = [
{
key: "mercator",
name: "Mercator",
subtitle: "Conformal — area inflates sharply toward the poles",
project: projMercator,
},
{
key: "mollweide",
name: "Mollweide",
subtitle: "Equal-area — shape stretches near the outer edges",
project: projMollweide,
},
{
key: "orthographic",
name: "Orthographic",
subtitle: "True perspective from space — only one hemisphere shown",
project: projOrthographic,
},
];
// Split a [lon, lat] polyline into runs of consecutively-projectable points,
// breaking wherever the projection hides a point (orthographic far side).
function toRuns(points, projFn) {
const runs = [];
let current = [];
points.forEach((p) => {
const proj = projFn(p);
if (proj) {
current.push(proj);
} else if (current.length > 1) {
runs.push(current);
current = [];
} else {
current = [];
}
});
if (current.length > 1) runs.push(current);
return runs;
}
function boundaryFor(config) {
if (config.key === "orthographic") {
const pts = [];
for (let i = 0; i <= 72; i += 1) {
const a = (i / 72) * 2 * Math.PI;
pts.push([Math.cos(a), Math.sin(a)]);
}
return pts;
}
if (config.key === "mollweide") {
const pts = [];
for (let lat = 90; lat >= -90; lat -= 5) pts.push(projMollweide([180, lat]));
for (let lat = -90; lat <= 90; lat += 5) pts.push(projMollweide([-180, lat]));
return pts;
}
const [x0, yTop] = projMercator([-180, MERC_LAT_CLIP]);
const [x1, yBottom] = projMercator([180, -MERC_LAT_CLIP]);
return [
[x0, yTop],
[x1, yTop],
[x1, yBottom],
[x0, yBottom],
];
}
function buildProjectionData(config) {
const projFn = config.project;
const boundary = boundaryFor(config);
const continents = CONTINENTS.map((c) => {
const runs = toRuns(c.points, projFn);
const closed = runs.length === 1 && runs[0].length === c.points.length;
return { runs, closed };
});
const graticule = [];
MERIDIANS.forEach((lon) => {
const pts = [];
for (let lat = -80; lat <= 80; lat += 10) pts.push([lon, lat]);
graticule.push(toRuns(pts, projFn));
});
PARALLELS.forEach((lat) => {
const pts = [];
for (let lon = -180; lon <= 180; lon += 10) pts.push([lon, lat]);
graticule.push(toRuns(pts, projFn));
});
const tissots = [];
TISSOT_LATS.forEach((lat) => {
TISSOT_LONS.forEach((lon) => {
if (!projFn([lon, lat])) return; // center on the hidden side — skip
const circlePts = tissotCircle(lon, lat, TISSOT_RHO_DEG, 24);
const runs = toRuns(circlePts, projFn);
if (runs.length === 1 && runs[0].length === circlePts.length) tissots.push(runs[0]);
});
});
const borders = COUNTRY_BORDERS.map((b) => toRuns(b.points, projFn));
return { boundary, continents, graticule, tissots, borders };
}
function bboxOf(points) {
const xs = points.map((p) => p[0]);
const ys = points.map((p) => p[1]);
return { minX: Math.min(...xs), maxX: Math.max(...xs), minY: Math.min(...ys), maxY: Math.max(...ys) };
}
// Natural width:height ratio of a projection's own outline (e.g. Mercator's
// clipped rectangle, Mollweide's wide ellipse, Orthographic's circle) --
// used to size each panel to its projection instead of forcing every panel
// into one shared box aspect.
function boundaryAspect(config) {
const { minX, maxX, minY, maxY } = bboxOf(boundaryFor(config));
return (maxX - minX) / (maxY - minY);
}
// Fit a data range into a pixel box, expanding the shorter axis so a true
// circle (orthographic) is never rendered as an ellipse by unequal scaling.
function fitDomain(minX, maxX, minY, maxY, boxW, boxH, padFrac) {
const midX = (minX + maxX) / 2;
const midY = (minY + maxY) / 2;
const boxAspect = boxW / boxH;
const dataAspect = (maxX - minX) / (maxY - minY);
let halfW;
let halfH;
if (dataAspect > boxAspect) {
halfW = (maxX - minX) / 2 / (1 - 2 * padFrac);
halfH = halfW / boxAspect;
} else {
halfH = (maxY - minY) / 2 / (1 - 2 * padFrac);
halfW = halfH * boxAspect;
}
return { min: [midX - halfW, midY - halfH], max: [midX + halfW, midY + halfH] };
}
function pathFromRuns(runs, closed) {
return runs
.filter((run) => run.length > 1)
.map((run) => {
const d = run.map((p, i) => `${i === 0 ? "M" : "L"} ${p[0].toFixed(2)},${p[1].toFixed(2)}`).join(" ");
return closed ? `${d} Z` : d;
})
.join(" ");
}
// --- Overlay: reads the ChartContainer's own linear scale, so every path
// lands in the right pixel spot for this panel's projection. ----------------
function GeoOverlay({ data }) {
const xScale = useXScale();
const yScale = useYScale();
const toPx = (p) => [xScale(p[0]), yScale(p[1])];
const boundaryPx = data.boundary.map(toPx);
return (
<g>
<path
d={pathFromRuns([boundaryPx], true)}
fill={t.elevatedBg}
stroke={t.inkSoft}
strokeOpacity={0.55}
strokeWidth={1.5}
/>
{data.graticule.map((runs, i) => (
<path
// eslint-disable-next-line react/no-array-index-key
key={`grid-${i}`}
d={pathFromRuns(runs.map((run) => run.map(toPx)), false)}
fill="none"
stroke={t.grid}
strokeWidth={1}
/>
))}
{data.continents.map((c) => (
<path
key={c.name}
d={pathFromRuns(
c.runs.map((run) => run.map(toPx)),
c.closed,
)}
fill={c.closed ? INK_MUTED : "none"}
fillOpacity={0.32}
stroke={INK_MUTED}
strokeWidth={1.1}
/>
))}
{data.borders.map((runs, i) => (
<path
// eslint-disable-next-line react/no-array-index-key
key={`border-${i}`}
d={pathFromRuns(runs.map((run) => run.map(toPx)), false)}
fill="none"
stroke={t.ink}
strokeOpacity={0.6}
strokeWidth={1}
strokeDasharray="4 3"
/>
))}
{data.tissots.map((run, i) => (
<path
// eslint-disable-next-line react/no-array-index-key
key={`tissot-${i}`}
d={pathFromRuns([run.map(toPx)], true)}
fill={t.palette[0]}
fillOpacity={0.22}
stroke={t.palette[0]}
strokeWidth={1.4}
/>
))}
</g>
);
}
function ProjectionPanel({ config, width, mapAreaH, headerH }) {
const data = buildProjectionData(config);
const { minX, maxX, minY, maxY } = bboxOf(data.boundary);
const domain = fitDomain(minX, maxX, minY, maxY, width, mapAreaH, 0.06);
return (
<div style={{ width, display: "flex", flexDirection: "column", alignItems: "center" }}>
<div style={{ height: headerH, textAlign: "center" }}>
<div style={{ fontSize: 17, fontWeight: 600, color: t.ink }}>{config.name}</div>
<div style={{ fontSize: 14, color: t.inkSoft, marginTop: 2 }}>{config.subtitle}</div>
</div>
<ChartContainer
width={width}
height={mapAreaH}
margin={{ top: 0, right: 0, bottom: 0, left: 0 }}
series={[]}
skipAnimation
disableAxisListener
xAxis={[{ scaleType: "linear", min: domain.min[0], max: domain.max[0] }]}
yAxis={[{ scaleType: "linear", min: domain.min[1], max: domain.max[1] }]}
>
<GeoOverlay data={data} />
</ChartContainer>
</div>
);
}
// --- Chart (default-exported component — the harness mounts it) -------------
export default function Chart() {
const { width: W, height: H } = window.ANYPLOT_SIZE;
const TITLE_H = 56;
const CAPTION_H = 42;
const OUTER_PAD = 24;
const GAP = 22;
const PANEL_HEADER_H = 54;
const MIN_PANEL_W = 460; // keeps the longest one-line subtitle from wrapping
// A single 3-across row starves every panel of height: world maps are wide
// (~1.3-2:1), so at a third of the canvas width none of them come close to
// needing the full leftover row height, leaving 40%+ of the canvas as a
// dead band below the maps (VQ-05). Two rows (2 + 1) roughly double the
// width each panel gets, which is exactly what wide-format maps need to
// grow into the available height instead of leaving it blank.
const ROWS = [PROJECTIONS.slice(0, 2), PROJECTIONS.slice(2)];
const panelsRowH = H - TITLE_H - CAPTION_H;
const rowGap = GAP;
const mapAreaH = (panelsRowH - (ROWS.length - 1) * rowGap - ROWS.length * PANEL_HEADER_H) / ROWS.length;
// Size each panel to its own projection's natural aspect (rather than one
// shared box) so the wide Mollweide ellipse and the near-square
// Orthographic globe both fill their frame without internal letterboxing.
const panelWidth = (config) => Math.max(MIN_PANEL_W, mapAreaH * boundaryAspect(config));
const availableW = W - 2 * OUTER_PAD;
const maxRowW = Math.max(...ROWS.map((row) => row.reduce((sum, c) => sum + panelWidth(c), 0) + (row.length - 1) * GAP));
const widthScale = maxRowW > availableW ? availableW / maxRowW : 1;
return (
<div style={{ width: W, height: H, display: "flex", flexDirection: "column" }}>
<div style={{ height: TITLE_H, display: "flex", alignItems: "center", justifyContent: "center" }}>
<span style={{ fontSize: 22, fontWeight: 500, color: t.ink }}>{TITLE}</span>
</div>
<div style={{ height: panelsRowH, display: "flex", flexDirection: "column", gap: rowGap }}>
{ROWS.map((row) => (
<div
key={row.map((c) => c.key).join("-")}
style={{
height: PANEL_HEADER_H + mapAreaH,
display: "flex",
flexDirection: "row",
justifyContent: "center",
gap: GAP,
}}
>
{row.map((config) => (
<ProjectionPanel
key={config.key}
config={config}
width={panelWidth(config) * widthScale}
mapAreaH={mapAreaH}
headerH={PANEL_HEADER_H}
/>
))}
</div>
))}
</div>
<div style={{ height: CAPTION_H, display: "flex", alignItems: "center", justifyContent: "center" }}>
<span style={{ fontSize: 14, color: INK_MUTED }}>
Green circles are equal-size reference regions (Tissot indicatrices, ~670 km radius) — their changing
shape and area reveal each projection's distortion.
</span>
</div>
</div>
);
}
Runnable source as JSON, for any HTTP client: https://api.anyplot.ai/specs/map-projections/muix/code. Any spec id and library id listed in llms-full.txt fit the same URL shape; every URL below is complete and callable.
{
  "spec_id": "map-projections",
  "language": "javascript",
  "library": "muix",
  "page": "https://anyplot.ai/map-projections/javascript/muix",
  "hub": "https://anyplot.ai/map-projections",
  "code_json": "https://api.anyplot.ai/specs/map-projections/muix/code",
  "spec_json": "https://api.anyplot.ai/specs/map-projections",
  "render_light_png": "https://storage.googleapis.com/anyplot-images/plots/map-projections/javascript/muix/plot-light.png",
  "render_dark_png": "https://storage.googleapis.com/anyplot-images/plots/map-projections/javascript/muix/plot-dark.png",
  "interactive_light_html": "https://storage.googleapis.com/anyplot-images/plots/map-projections/javascript/muix/plot-light.html",
  "interactive_dark_html": "https://storage.googleapis.com/anyplot-images/plots/map-projections/javascript/muix/plot-dark.html",
  "quality_score": 85.0,
  "license": "MIT",
  "guide": "https://anyplot.ai/llms.txt"
}
Part of World Map with Different Projections on anyplot.ai.