The same plot in 14 other libraries — JavaScript: Chart.js, D3.js, Apache ECharts, MUI X Charts; Python: Altair, Bokeh, lets-plot, Matplotlib, Plotly, plotnine, Pygal, Seaborn; R: ggplot2; Julia: Makie.jl. Compare all 15 side by side: World Map with Different Projections in Python, R, Julia and JavaScript.
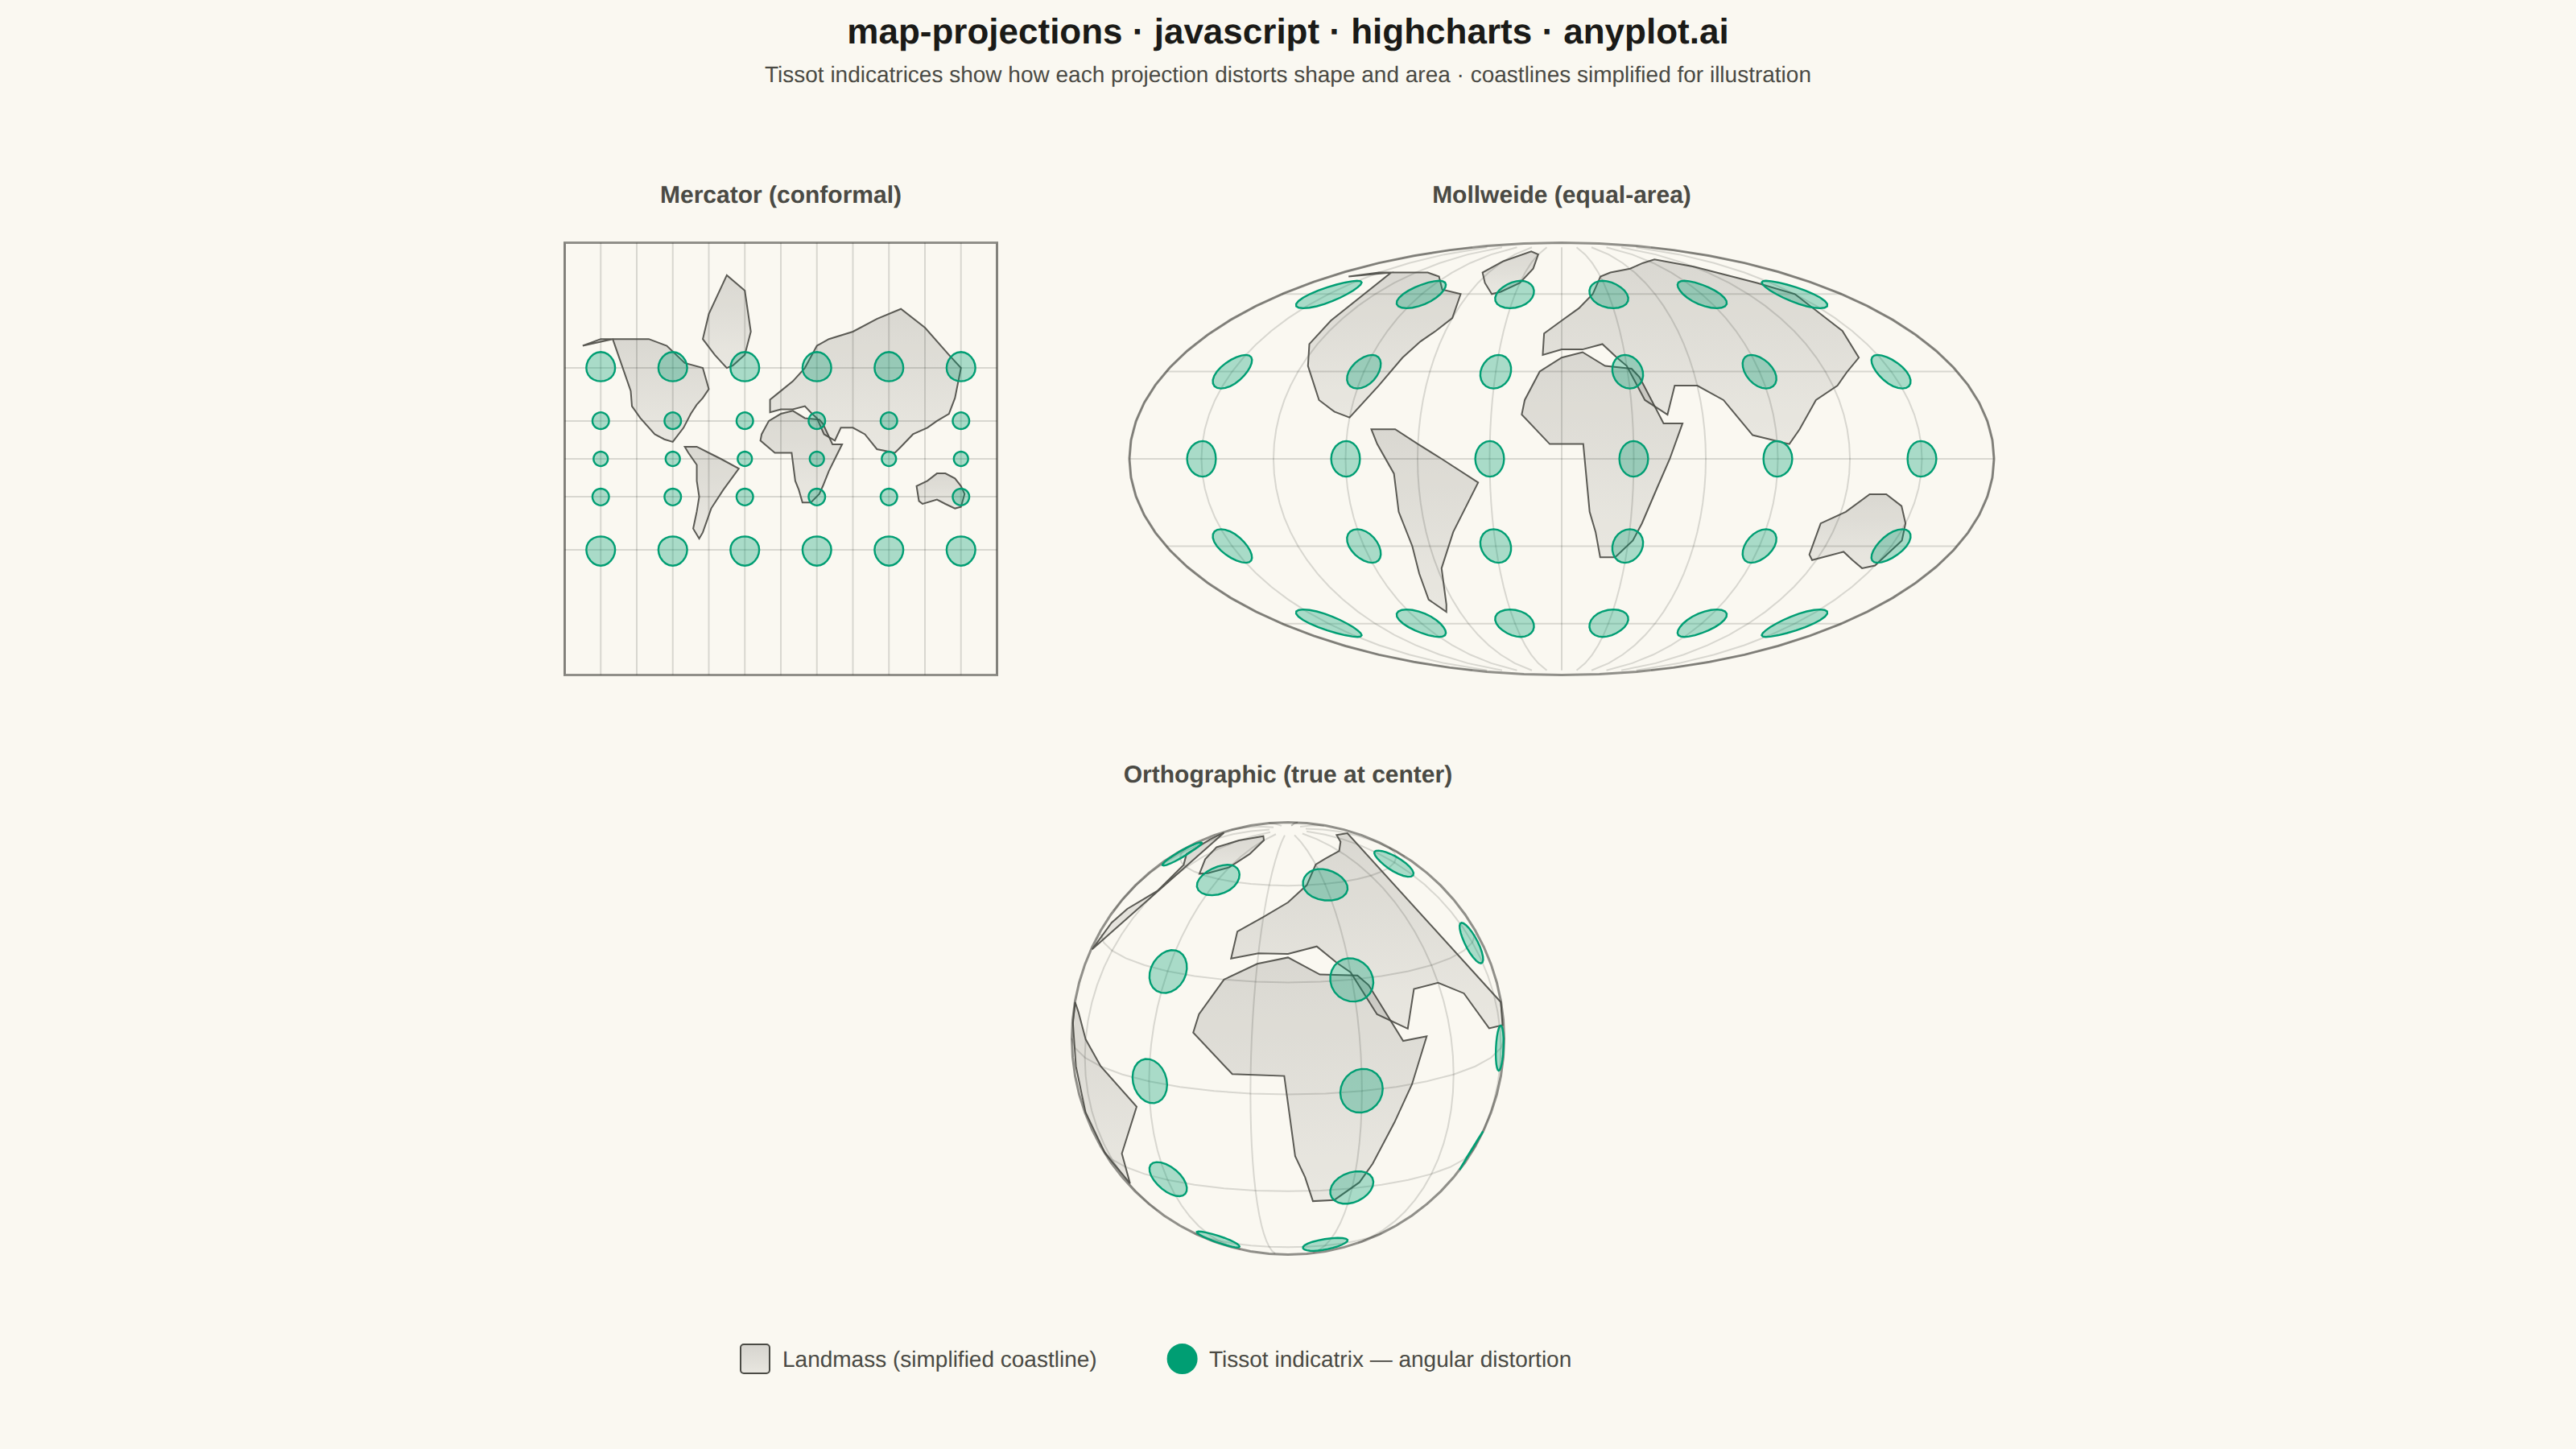
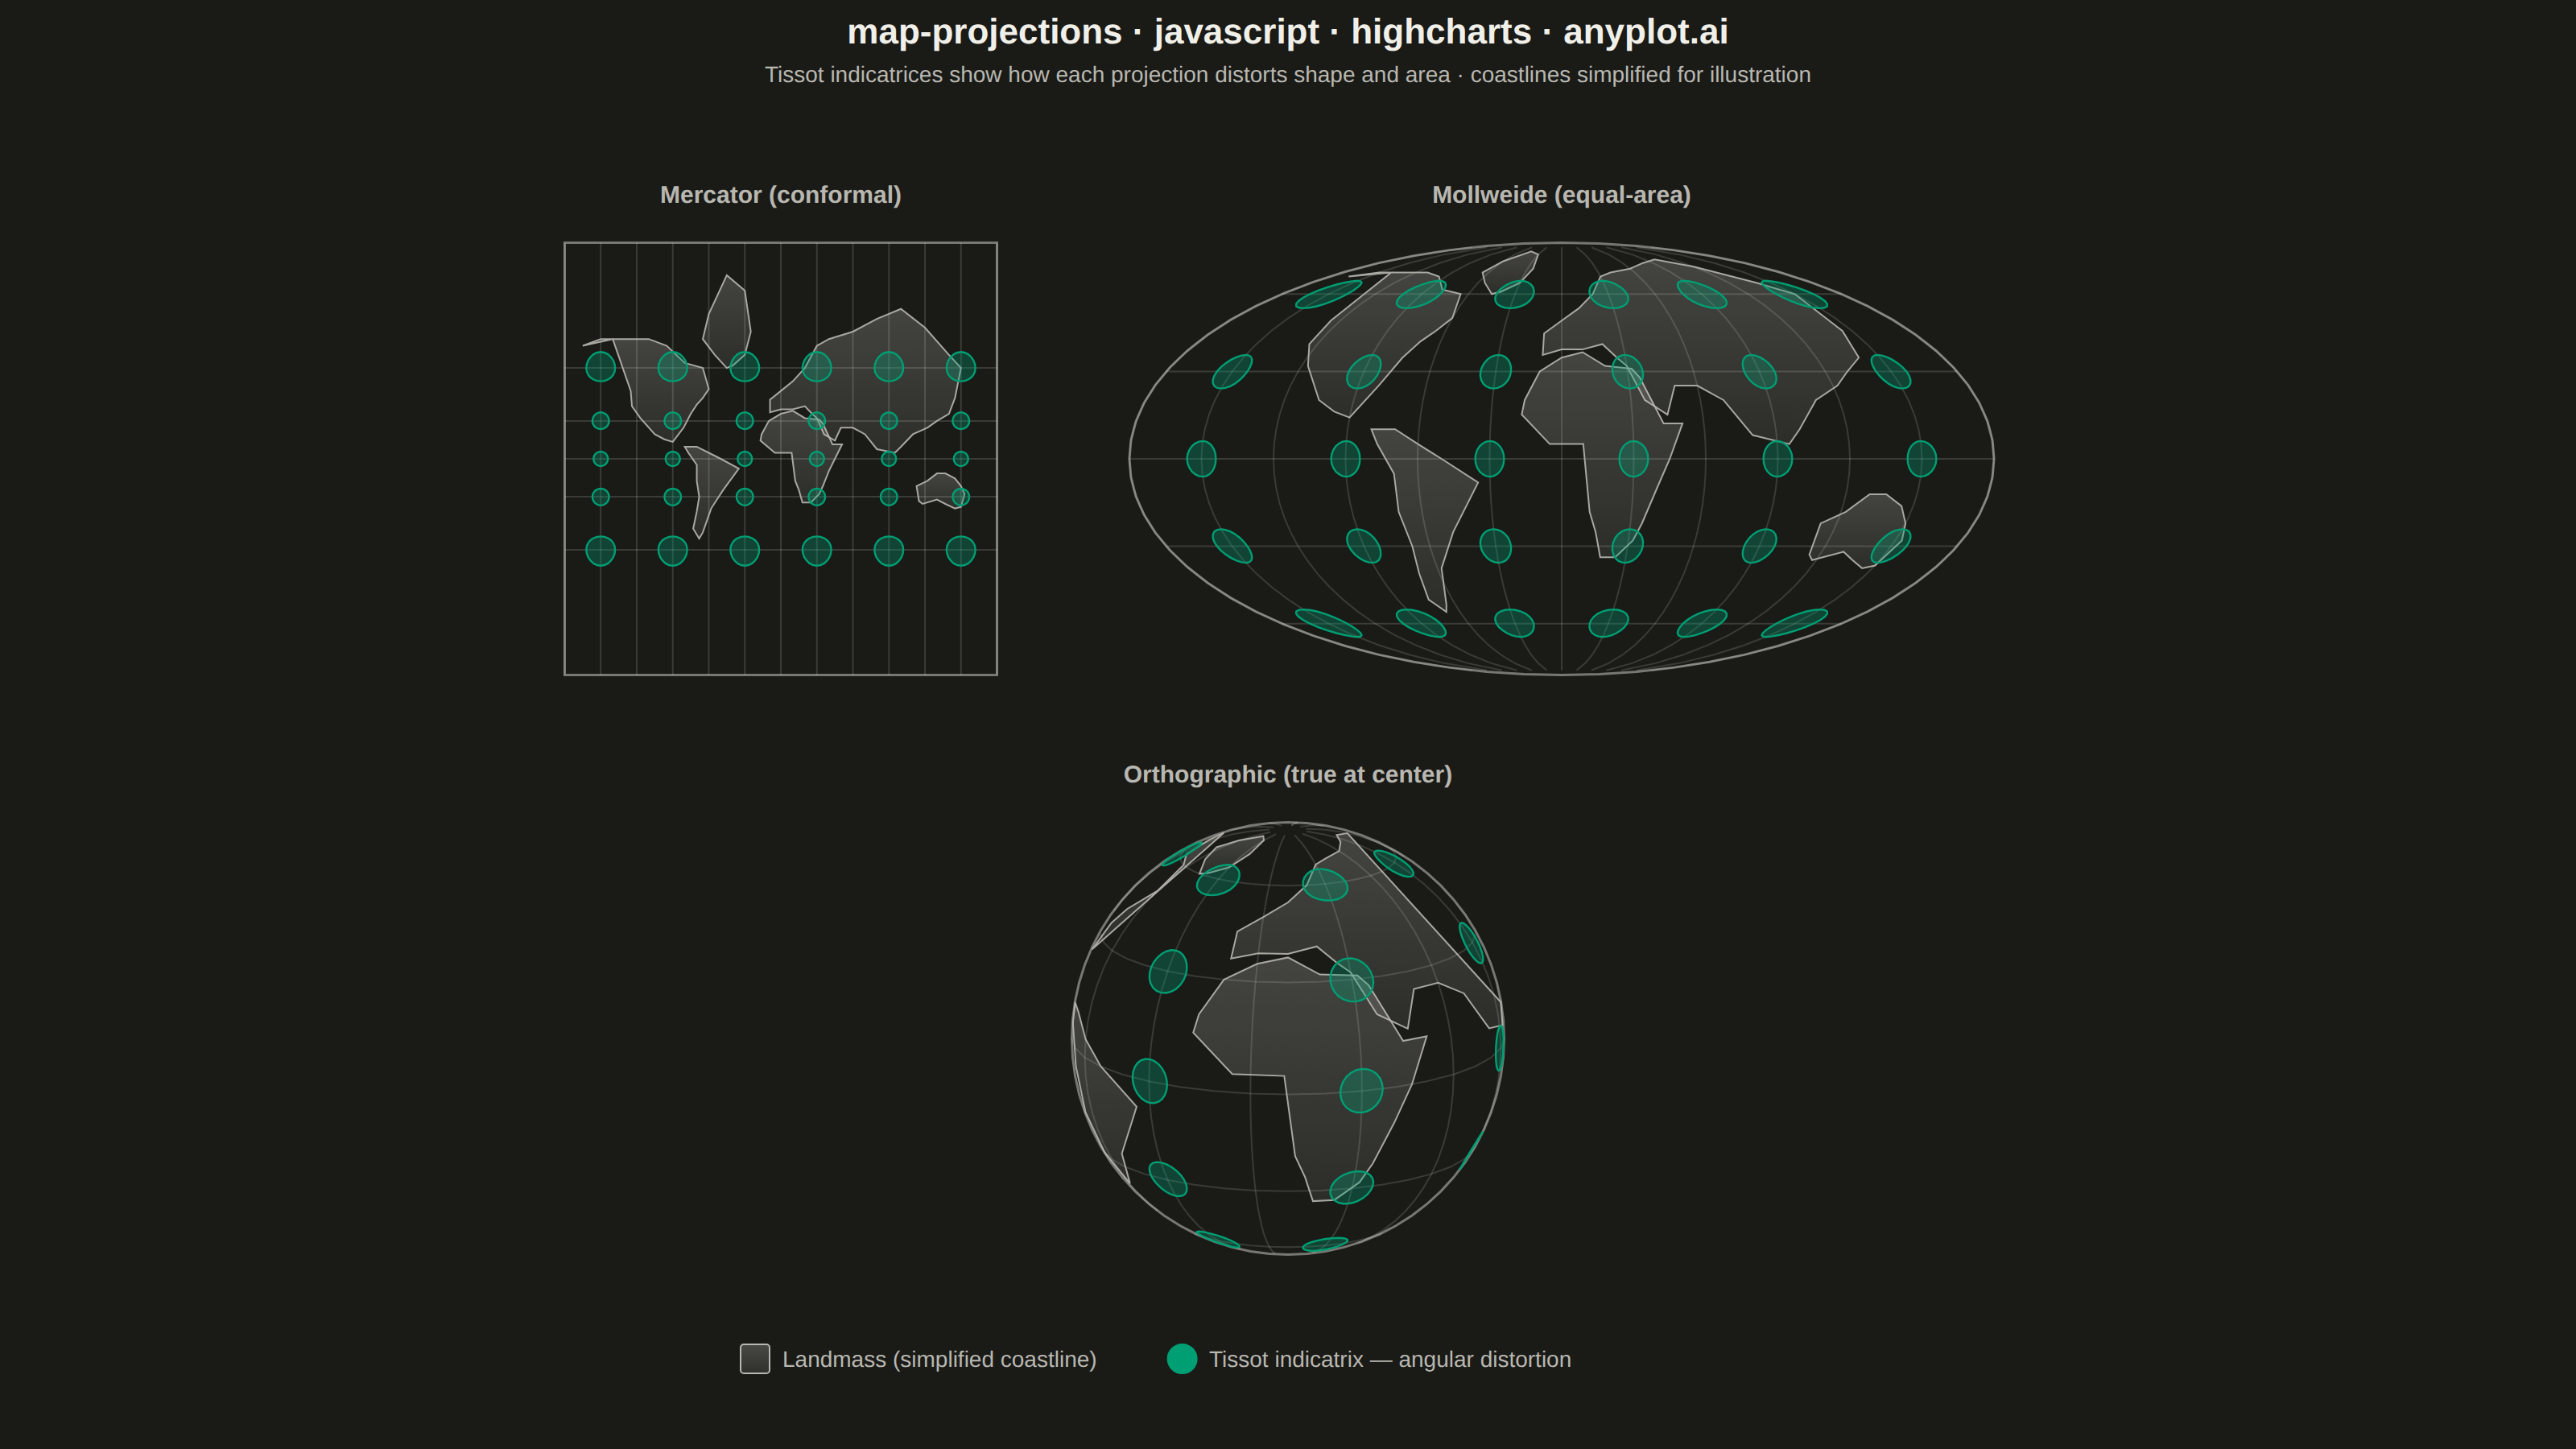
A world map demonstrating different cartographic projections and their distortion characteristics. This visualization showcases how the same geographic data appears under various map projections (Mercator, Robinson, Mollweide, Orthographic, etc.), revealing how each projection preserves or distorts area, shape, distance, or direction. The plot includes graticule (latitude/longitude grid lines) and optionally Tissot indicatrices to illustrate projection distortion patterns.
// anyplot.ai
// map-projections: World Map with Different Projections
// Library: highcharts 12.6.0 | JavaScript 22.23.2
// Quality: 89/100 | Created: 2026-08-26

//# anyplot-orientation: landscape
const t = window.ANYPLOT_TOKENS;
// Subtle top-to-bottom gradient instead of a flat fill — a small texture cue
// that still reads as "neutral land color" per the spec, using a Highcharts
// gradient color object (a renderer-native feature, not a plain SVG attr).
const LAND_FILL = {
  linearGradient: { x1: 0, y1: 0, x2: 0, y2: 1 },
  stops:
    t.theme === "dark"
      ? [
          [0, "rgba(240,239,232,0.22)"],
          [1, "rgba(240,239,232,0.10)"],
        ]
      : [
          [0, "rgba(26,26,23,0.16)"],
          [1, "rgba(26,26,23,0.08)"],
        ],
};

// --- Projections (computed manually) ---------------------------------------
// Only the core Highcharts bundle is loaded (no highmaps / modules — see
// prompts/library/highcharts.md), so there is no Maps coordinate system to
// draw into. Instead the projection math runs here, in plain JS, and the
// result is drawn with the core SVGRenderer (`chart.renderer`), the same
// public API Highcharts itself uses for custom shapes and annotations.

// Mercator: conformal, unbounded area distortion toward the poles.
// Clamped to +/-85 deg — the same clip web-Mercator tiles use, which also
// happens to make the projected extent square.
function mercatorProject(lonDeg, latDeg) {
  const lon = (lonDeg * Math.PI) / 180;
  const lat = (Math.max(-85, Math.min(85, latDeg)) * Math.PI) / 180;
  return [lon, Math.log(Math.tan(Math.PI / 4 + lat / 2))];
}

// Mollweide: pseudocylindrical equal-area projection onto an ellipse. The
// auxiliary angle theta has no closed form — solved with fixed-iteration
// Newton-Raphson (10 steps is stable for all latitudes, no seeded RNG needed).
function mollweideTheta(latRad) {
  if (Math.abs(latRad) >= Math.PI / 2 - 1e-9) return Math.sign(latRad) * (Math.PI / 2);
  let theta = latRad;
  for (let i = 0; i < 10; i++) {
    theta -= (2 * theta + Math.sin(2 * theta) - Math.PI * Math.sin(latRad)) / (2 + 2 * Math.cos(2 * theta));
  }
  return theta;
}
function mollweideProject(lonDeg, latDeg) {
  const lon = (lonDeg * Math.PI) / 180;
  const lat = (latDeg * Math.PI) / 180;
  const theta = mollweideTheta(lat);
  return [((2 * Math.SQRT2) / Math.PI) * lon * Math.cos(theta), Math.SQRT2 * Math.sin(theta)];
}

// Orthographic: azimuthal perspective as seen from infinity — shape and
// scale are only true at the view center, with distortion growing toward the
// limb, and only one hemisphere is visible at all (the far side is behind
// the globe). Centered on the Africa/Europe/Atlantic quadrant so the visible
// hemisphere still carries several recognizable landmasses.
const ORTHO_LON0 = (10 * Math.PI) / 180;
const ORTHO_LAT0 = (15 * Math.PI) / 180;
function orthoVisible(lonDeg, latDeg) {
  const lon = (lonDeg * Math.PI) / 180;
  const lat = (latDeg * Math.PI) / 180;
  return Math.sin(ORTHO_LAT0) * Math.sin(lat) + Math.cos(ORTHO_LAT0) * Math.cos(lat) * Math.cos(lon - ORTHO_LON0) >= 0;
}
function orthoProject(lonDeg, latDeg) {
  const lon = (lonDeg * Math.PI) / 180;
  const lat = (latDeg * Math.PI) / 180;
  return [
    Math.cos(lat) * Math.sin(lon - ORTHO_LON0),
    Math.cos(ORTHO_LAT0) * Math.sin(lat) - Math.sin(ORTHO_LAT0) * Math.cos(lat) * Math.cos(lon - ORTHO_LON0),
  ];
}

// --- Data: simplified continent silhouettes (in-memory, deterministic) -----
// Coarse landmass outlines for illustration, not survey-grade GIS boundaries.
const CONTINENTS = [
  { ring: [[-165, 68], [-140, 70], [-125, 49], [-124, 40], [-117, 32], [-105, 20], [-97, 16], [-90, 14],
           [-81, 25], [-75, 35], [-70, 41], [-65, 45], [-60, 50], [-65, 60], [-80, 62], [-95, 68],
           [-110, 70], [-130, 70], [-150, 70], [-165, 68]] }, // North America
  { ring: [[-80, 10], [-77, 5], [-70, -5], [-70, -18], [-68, -30], [-70, -40], [-73, -50], [-68, -55],
           [-65, -52], [-58, -38], [-48, -25], [-35, -8], [-50, 0], [-60, 5], [-70, 10], [-80, 10]] }, // South America
  { ring: [[-17, 15], [-16, 20], [-10, 30], [0, 35], [10, 37], [20, 32], [32, 31], [35, 28], [43, 12],
           [51, 12], [45, 0], [40, -10], [35, -22], [32, -28], [25, -34], [18, -34], [15, -25], [12, -18],
           [9, 5], [-5, 5], [-17, 15]] }, // Africa
  { ring: [[-9, 36], [-9, 44], [0, 49], [10, 54], [20, 60], [30, 68], [40, 70], [60, 72], [80, 75],
           [100, 77], [120, 73], [140, 65], [150, 60], [145, 45], [140, 35], [130, 30], [122, 25],
           [110, 20], [100, 10], [95, 5], [80, 8], [70, 20], [60, 25], [50, 25], [45, 15], [36, 20],
           [30, 32], [26, 35], [20, 40], [10, 38], [0, 38], [-9, 36]] }, // Eurasia
  { ring: [[113, -22], [115, -33], [118, -35], [130, -32], [137, -35], [145, -38], [150, -37], [153, -28],
           [150, -22], [145, -16], [137, -12], [130, -12], [122, -18], [113, -22]] }, // Australia
  { ring: [[-45, 60], [-55, 65], [-65, 70], [-60, 76], [-45, 82], [-30, 80], [-25, 72], [-30, 65],
           [-40, 61], [-45, 60]] }, // Greenland
];

// Graticule — 30 deg meridians clipped at +/-85, 30 deg parallels, sampled
// densely so curved meridians (Mollweide, Orthographic) render smoothly.
function sampleMeridian(lon, latFrom, latTo, step) {
  const pts = [];
  for (let lat = latFrom; lat < latTo; lat += step) pts.push([lon, lat]);
  pts.push([lon, latTo]);
  return pts;
}
function sampleParallel(lat, lonFrom, lonTo, step) {
  const pts = [];
  for (let lon = lonFrom; lon < lonTo; lon += step) pts.push([lon, lat]);
  pts.push([lonTo, lat]);
  return pts;
}
const GRATICULE_LINES = [];
[-180, -150, -120, -90, -60, -30, 0, 30, 60, 90, 120, 150, 180].forEach((lon) =>
  GRATICULE_LINES.push(sampleMeridian(lon, -85, 85, 5))
);
[-60, -30, 0, 30, 60].forEach((lat) => GRATICULE_LINES.push(sampleParallel(lat, -180, 180, 10)));

// Splits a lon/lat polyline into the runs that pass a pane's visibility test
// (Orthographic only — Mercator/Mollweide show the whole globe, so every
// point is visible there). The far side of the globe projects into the same
// disk as the near side, so a shape crossing the horizon must break into
// separate paths instead of connecting straight across it.
function visibleRuns(pointsLonLat, closed, isVisible) {
  const n = pointsLonLat.length;
  const vis = pointsLonLat.map((p) => isVisible(p[0], p[1]));
  const runs = [];
  let current = [];
  for (let i = 0; i < n; i++) {
    if (vis[i]) current.push(pointsLonLat[i]);
    else if (current.length) {
      runs.push(current);
      current = [];
    }
  }
  if (current.length) runs.push(current);
  if (closed && runs.length > 1 && vis[0] && vis[n - 1]) {
    const first = runs.shift();
    runs[runs.length - 1] = runs[runs.length - 1].concat(first);
  }
  return runs;
}

// Tissot indicatrices — small spherical circles (angular radius 6 deg) at
// graticule intersections, drawn through each projection. A true circle on
// the globe comes out looking different in each projection: that visual
// difference *is* the projection's distortion.
function tissotCircle(lon0, lat0, radiusDeg, steps) {
  const pts = [];
  const cosLat0 = Math.cos((lat0 * Math.PI) / 180);
  for (let i = 0; i <= steps; i++) {
    const bearing = (i / steps) * 2 * Math.PI;
    const lat = lat0 + radiusDeg * Math.cos(bearing);
    const lon = lon0 + (radiusDeg * Math.sin(bearing)) / cosLat0;
    pts.push([lon, lat]);
  }
  return pts;
}
const TISSOT_CENTERS = [];
[-60, -30, 0, 30, 60].forEach((lat) =>
  [-150, -90, -30, 30, 90, 150].forEach((lon) => TISSOT_CENTERS.push([lon, lat]))
);
// Orthographic only shows one hemisphere — pre-filter to centers that are
// actually visible from the chosen viewpoint, so we don't draw circles that
// would be entirely behind the globe.
const ORTHO_TISSOT_CENTERS = TISSOT_CENTERS.filter(([lon, lat]) => orthoVisible(lon, lat));

function buildEllipse(rx, ry, steps) {
  const pts = [];
  for (let i = 0; i <= steps; i++) {
    const angle = (i / steps) * 2 * Math.PI;
    pts.push([rx * Math.cos(angle), ry * Math.sin(angle)]);
  }
  return pts;
}

// --- Pane layout (CSS px, mount is 1600x900) --------------------------------
// Two rows so the full canvas height is used: Mercator + Mollweide share the
// top row (conformal vs. equal-area contrast), Orthographic sits alone below
// (perspective/limb-distortion contrast, and only shows a single hemisphere).
const UNIT = 290;
const ROW_GAP = 50;
const ROW1_TOP = 140;
const ROW2_TOP = 500;
const ROW1_WIDTH = UNIT + ROW_GAP + 2 * UNIT; // Mercator + gap + Mollweide (2x wide)
const ROW1_LEFT = (1600 - ROW1_WIDTH) / 2;
const LAYOUT = {
  mercator: { left: ROW1_LEFT, top: ROW1_TOP, width: UNIT, height: UNIT },
  mollweide: { left: ROW1_LEFT + UNIT + ROW_GAP, top: ROW1_TOP, width: 2 * UNIT, height: UNIT },
  orthographic: { left: (1600 - UNIT) / 2, top: ROW2_TOP, width: UNIT, height: UNIT },
};
const PAD = 0.08;
const MERCATOR_Y_MAX = mercatorProject(0, 85)[1];
const MOLLWEIDE_X_MAX = 2 * Math.SQRT2;
const MOLLWEIDE_Y_MAX = Math.SQRT2;

const PANES = [
  {
    key: "mercator",
    name: "Mercator (conformal)",
    axisIdx: 0,
    ...LAYOUT.mercator,
    project: mercatorProject,
    xMax: Math.PI,
    yMax: MERCATOR_Y_MAX,
    tissotCenters: TISSOT_CENTERS,
    boundaryXY: [
      [-Math.PI, MERCATOR_Y_MAX],
      [Math.PI, MERCATOR_Y_MAX],
      [Math.PI, -MERCATOR_Y_MAX],
      [-Math.PI, -MERCATOR_Y_MAX],
    ],
  },
  {
    key: "mollweide",
    name: "Mollweide (equal-area)",
    axisIdx: 1,
    ...LAYOUT.mollweide,
    project: mollweideProject,
    xMax: MOLLWEIDE_X_MAX,
    yMax: MOLLWEIDE_Y_MAX,
    tissotCenters: TISSOT_CENTERS,
    boundaryXY: buildEllipse(MOLLWEIDE_X_MAX, MOLLWEIDE_Y_MAX, 72),
  },
  {
    key: "orthographic",
    name: "Orthographic (true at center)",
    axisIdx: 2,
    ...LAYOUT.orthographic,
    project: orthoProject,
    visible: orthoVisible,
    xMax: 1,
    yMax: 1,
    tissotCenters: ORTHO_TISSOT_CENTERS,
    boundaryXY: buildEllipse(1, 1, 72),
  },
];

// --- Drawing (core SVGRenderer, run once the chart + axes are ready) -------
function drawPane(chart, pane) {
  const xAxis = chart.xAxis[pane.axisIdx];
  const yAxis = chart.yAxis[pane.axisIdx];
  const renderer = chart.renderer;
  const group = renderer.g("pane-" + pane.key).add();
  group.clip(renderer.clipRect(pane.left, pane.top, pane.width, pane.height));

  function pathFromXY(pointsXY, close) {
    const path = [];
    pointsXY.forEach((p, i) => {
      path.push(i === 0 ? "M" : "L", xAxis.toPixels(p[0], false), yAxis.toPixels(p[1], false));
    });
    if (close) path.push("Z");
    return path;
  }
  // Draws a lon/lat shape, splitting it into visible runs first when the
  // pane only shows one hemisphere (Orthographic).
  function drawShape(pointsLonLat, close, attrs) {
    const runs = pane.visible ? visibleRuns(pointsLonLat, close, pane.visible) : [pointsLonLat];
    runs.forEach((run) => {
      if (run.length < 2) return;
      const xy = run.map((p) => pane.project(p[0], p[1]));
      renderer.path(pathFromXY(xy, close)).attr(attrs).add(group);
    });
  }

  renderer
    .path(pathFromXY(pane.boundaryXY, true))
    .attr({ fill: "none", stroke: t.inkSoft, "stroke-width": 1.5, opacity: 0.6 })
    .add(group);

  GRATICULE_LINES.forEach((line) => {
    drawShape(line, false, { fill: "none", stroke: t.grid, "stroke-width": 1 });
  });

  CONTINENTS.forEach((continent) => {
    drawShape(continent.ring, true, { fill: LAND_FILL, stroke: t.inkSoft, "stroke-width": 1, opacity: 0.9 });
  });

  pane.tissotCenters.forEach(([lon0, lat0]) => {
    drawShape(tissotCircle(lon0, lat0, 6, 24), true, {
      fill: t.palette[0],
      "fill-opacity": 0.32,
      stroke: t.palette[0],
      "stroke-width": 1.2,
    });
  });

  renderer
    .text(pane.name, pane.left + pane.width / 2, pane.top - 14)
    .attr({ align: "center" })
    .css({ color: t.inkSoft, fontSize: "15px", fontWeight: "600" })
    .add();
}

function drawLegend(chart) {
  const renderer = chart.renderer;
  const y = 835;
  let x = 460;
  [
    { shape: "square", swatch: LAND_FILL, stroke: t.inkSoft, label: "Landmass (simplified coastline)" },
    // Drawn with the circle it actually represents (renderer.circle, the
    // same symbol primitive Highcharts uses for point markers) instead of a
    // generic square swatch.
    { shape: "circle", swatch: t.palette[0], stroke: t.palette[0], label: "Tissot indicatrix — angular distortion" },
  ].forEach((item) => {
    if (item.shape === "circle") {
      renderer.circle(x + 9, y + 9, 9).attr({ fill: item.swatch, stroke: item.stroke, "stroke-width": 1 }).add();
    } else {
      renderer.rect(x, y, 18, 18, 2).attr({ fill: item.swatch, stroke: item.stroke, "stroke-width": 1 }).add();
    }
    const label = renderer
      .text(item.label, x + 26, y + 14)
      .css({ color: t.inkSoft, fontSize: "14px" })
      .add();
    x += 26 + label.getBBox().width + 44;
  });
}

// --- Chart -------------------------------------------------------------------
Highcharts.chart("container", {
  chart: {
    type: "scatter",
    backgroundColor: "transparent",
    animation: false,
    spacing: [10, 10, 10, 10],
    style: { fontFamily: "inherit" },
    events: {
      load: function () {
        PANES.forEach((pane) => drawPane(this, pane));
        drawLegend(this);
        window.__anyplotReady = true;
      },
    },
  },
  credits: { enabled: false },
  colors: t.palette,
  title: {
    text: "map-projections · javascript · highcharts · anyplot.ai",
    style: { color: t.ink, fontSize: "22px", fontWeight: "600" },
  },
  subtitle: {
    text: "Tissot indicatrices show how each projection distorts shape and area · coastlines simplified for illustration",
    style: { color: t.inkSoft, fontSize: "14px" },
  },
  xAxis: PANES.map((pane) => ({
    min: -pane.xMax * (1 + PAD),
    max: pane.xMax * (1 + PAD),
    left: pane.left + "px",
    top: pane.top + "px",
    width: pane.width + "px",
    height: pane.height + "px",
    gridLineWidth: 0,
    lineWidth: 0,
    tickLength: 0,
    labels: { enabled: false },
    title: { text: null },
    startOnTick: false,
    endOnTick: false,
  })),
  yAxis: PANES.map((pane) => ({
    min: -pane.yMax * (1 + PAD),
    max: pane.yMax * (1 + PAD),
    left: pane.left + "px",
    top: pane.top + "px",
    width: pane.width + "px",
    height: pane.height + "px",
    gridLineWidth: 0,
    lineWidth: 0,
    tickLength: 0,
    labels: { enabled: false },
    title: { text: null },
    startOnTick: false,
    endOnTick: false,
  })),
  legend: { enabled: false },
  tooltip: { enabled: false },
  plotOptions: { series: { animation: false } },
  series: [{ xAxis: 0, yAxis: 0, data: [] }],
});
Runnable source as JSON, for any HTTP client: https://api.anyplot.ai/specs/map-projections/highcharts/code. Any spec id and library id listed in llms-full.txt fit the same URL shape; every URL below is complete and callable.
{
  "spec_id": "map-projections",
  "language": "javascript",
  "library": "highcharts",
  "page": "https://anyplot.ai/map-projections/javascript/highcharts",
  "hub": "https://anyplot.ai/map-projections",
  "code_json": "https://api.anyplot.ai/specs/map-projections/highcharts/code",
  "spec_json": "https://api.anyplot.ai/specs/map-projections",
  "render_light_png": "https://storage.googleapis.com/anyplot-images/plots/map-projections/javascript/highcharts/plot-light.png",
  "render_dark_png": "https://storage.googleapis.com/anyplot-images/plots/map-projections/javascript/highcharts/plot-dark.png",
  "interactive_light_html": "https://storage.googleapis.com/anyplot-images/plots/map-projections/javascript/highcharts/plot-light.html",
  "interactive_dark_html": "https://storage.googleapis.com/anyplot-images/plots/map-projections/javascript/highcharts/plot-dark.html",
  "quality_score": 89.0,
  "license": "MIT",
  "guide": "https://anyplot.ai/llms.txt"
}
Part of World Map with Different Projections on anyplot.ai.