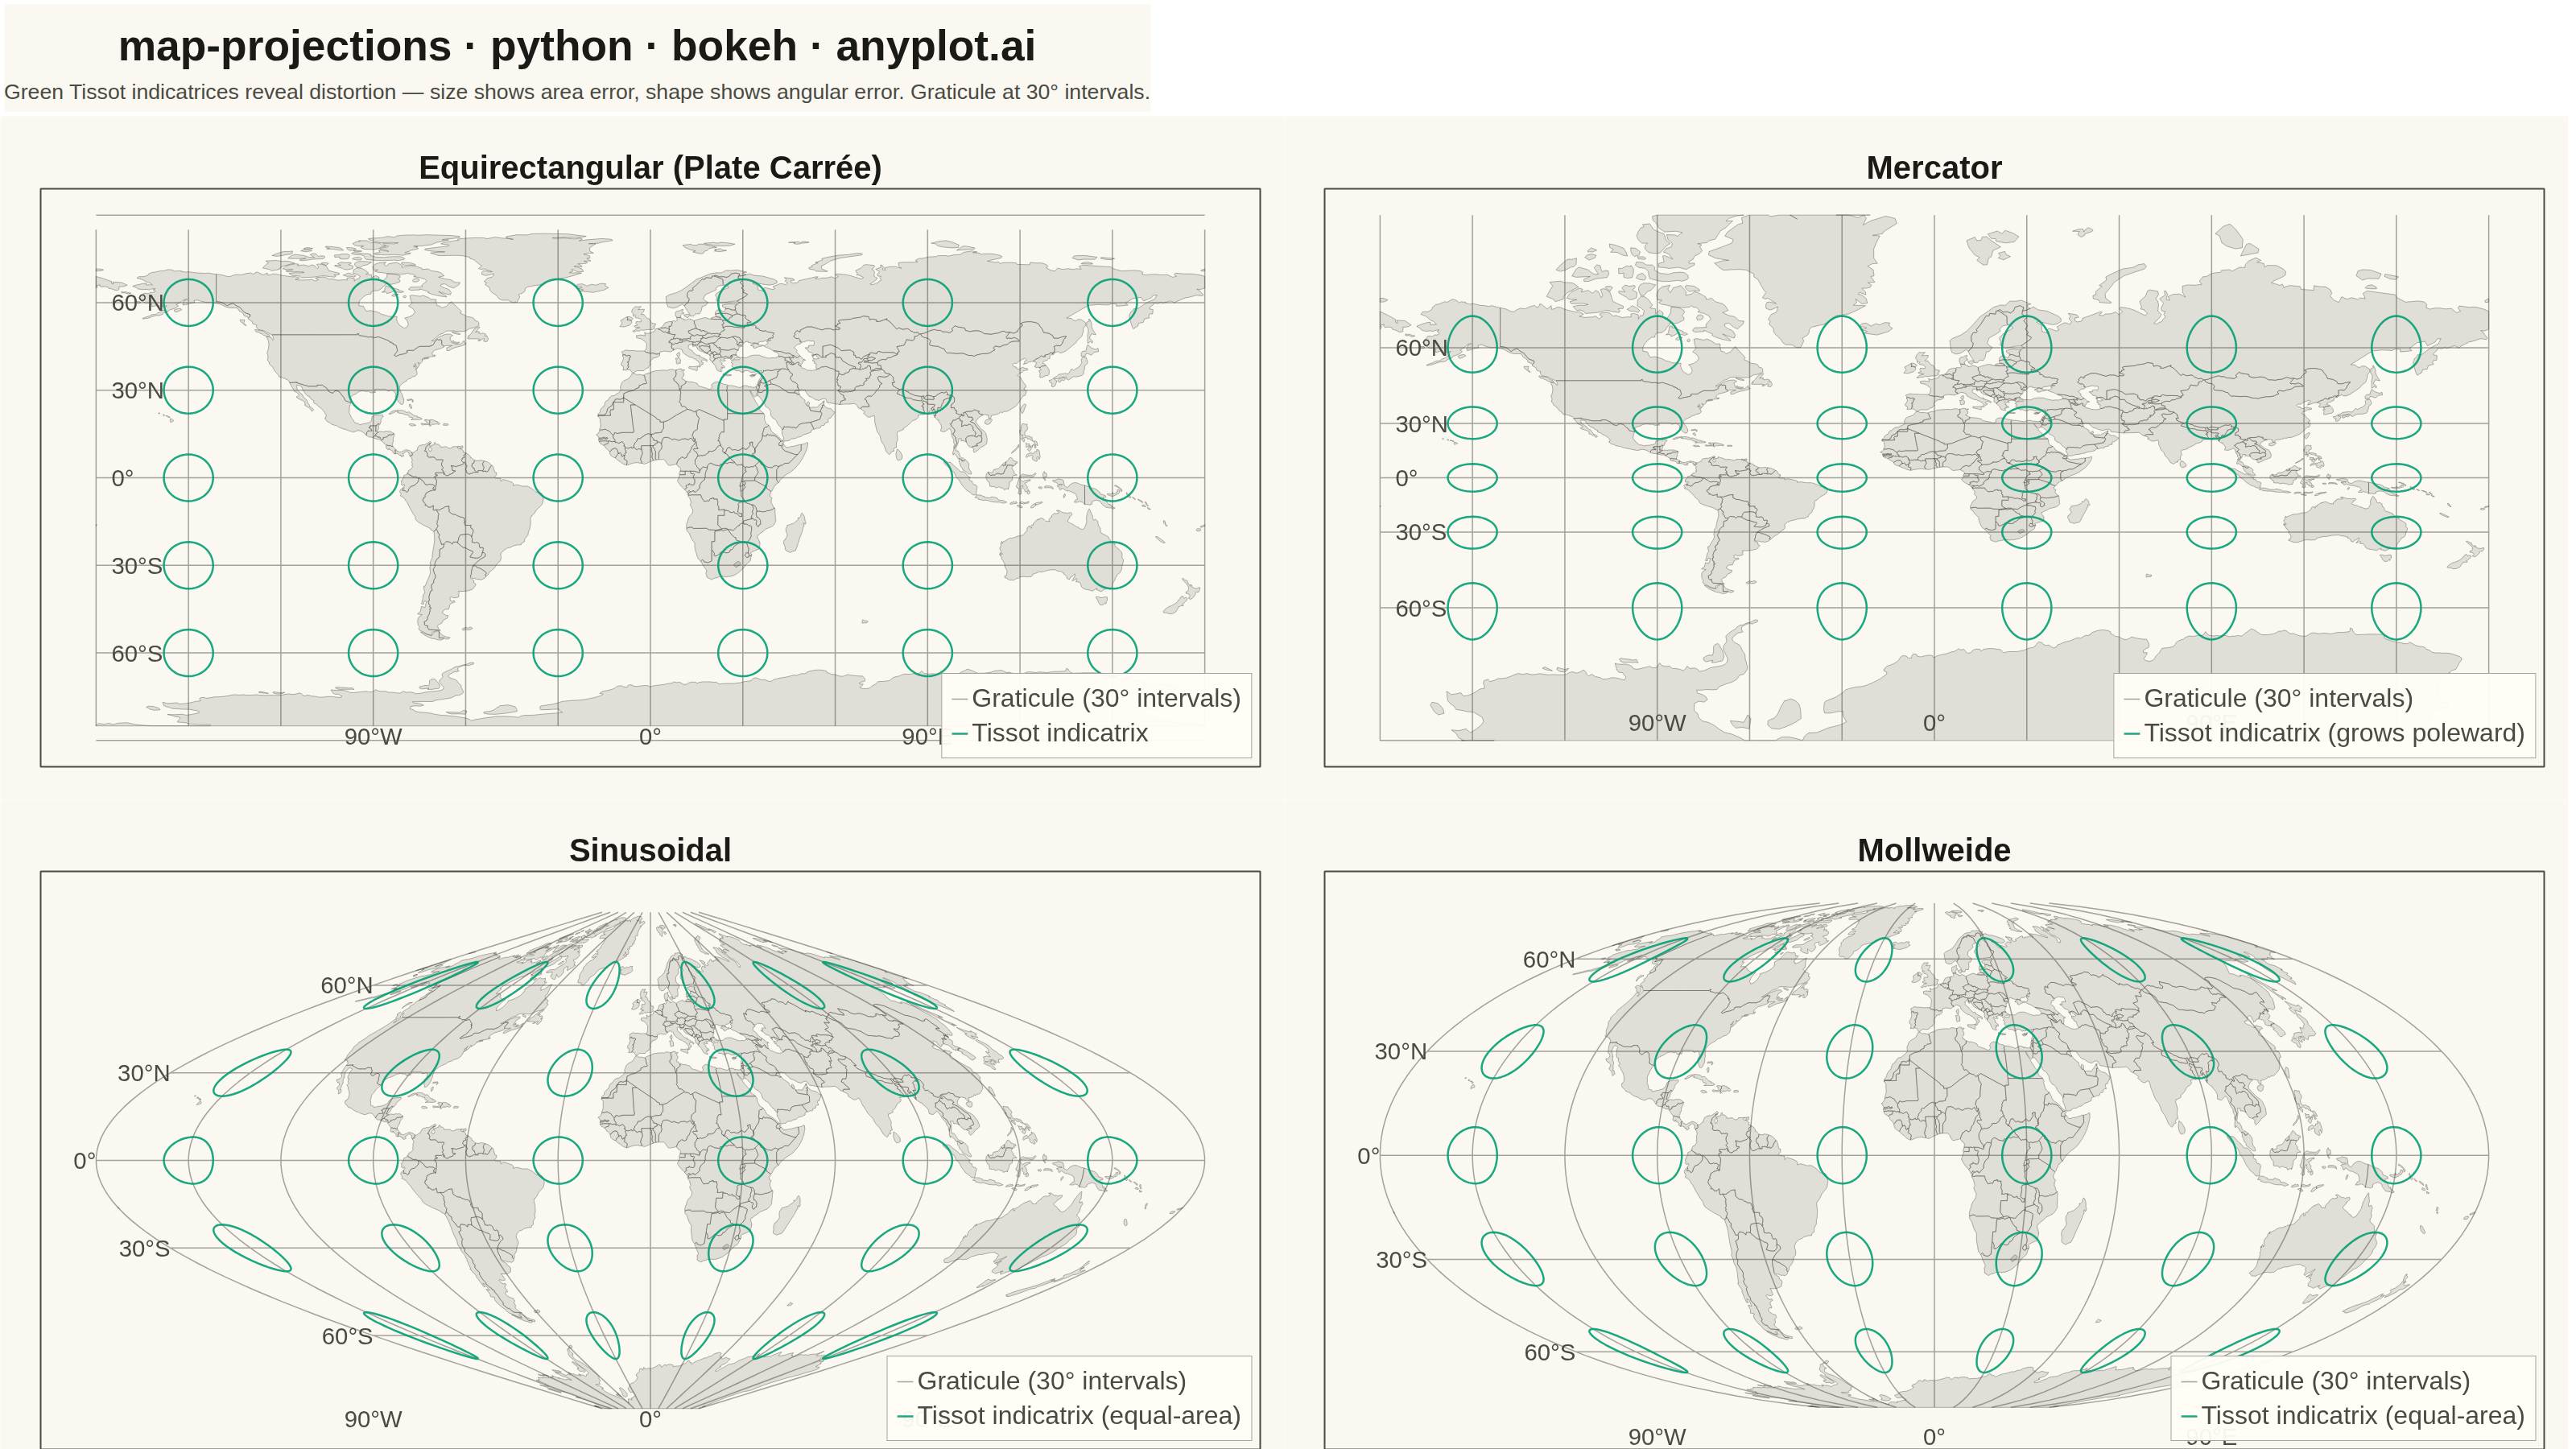
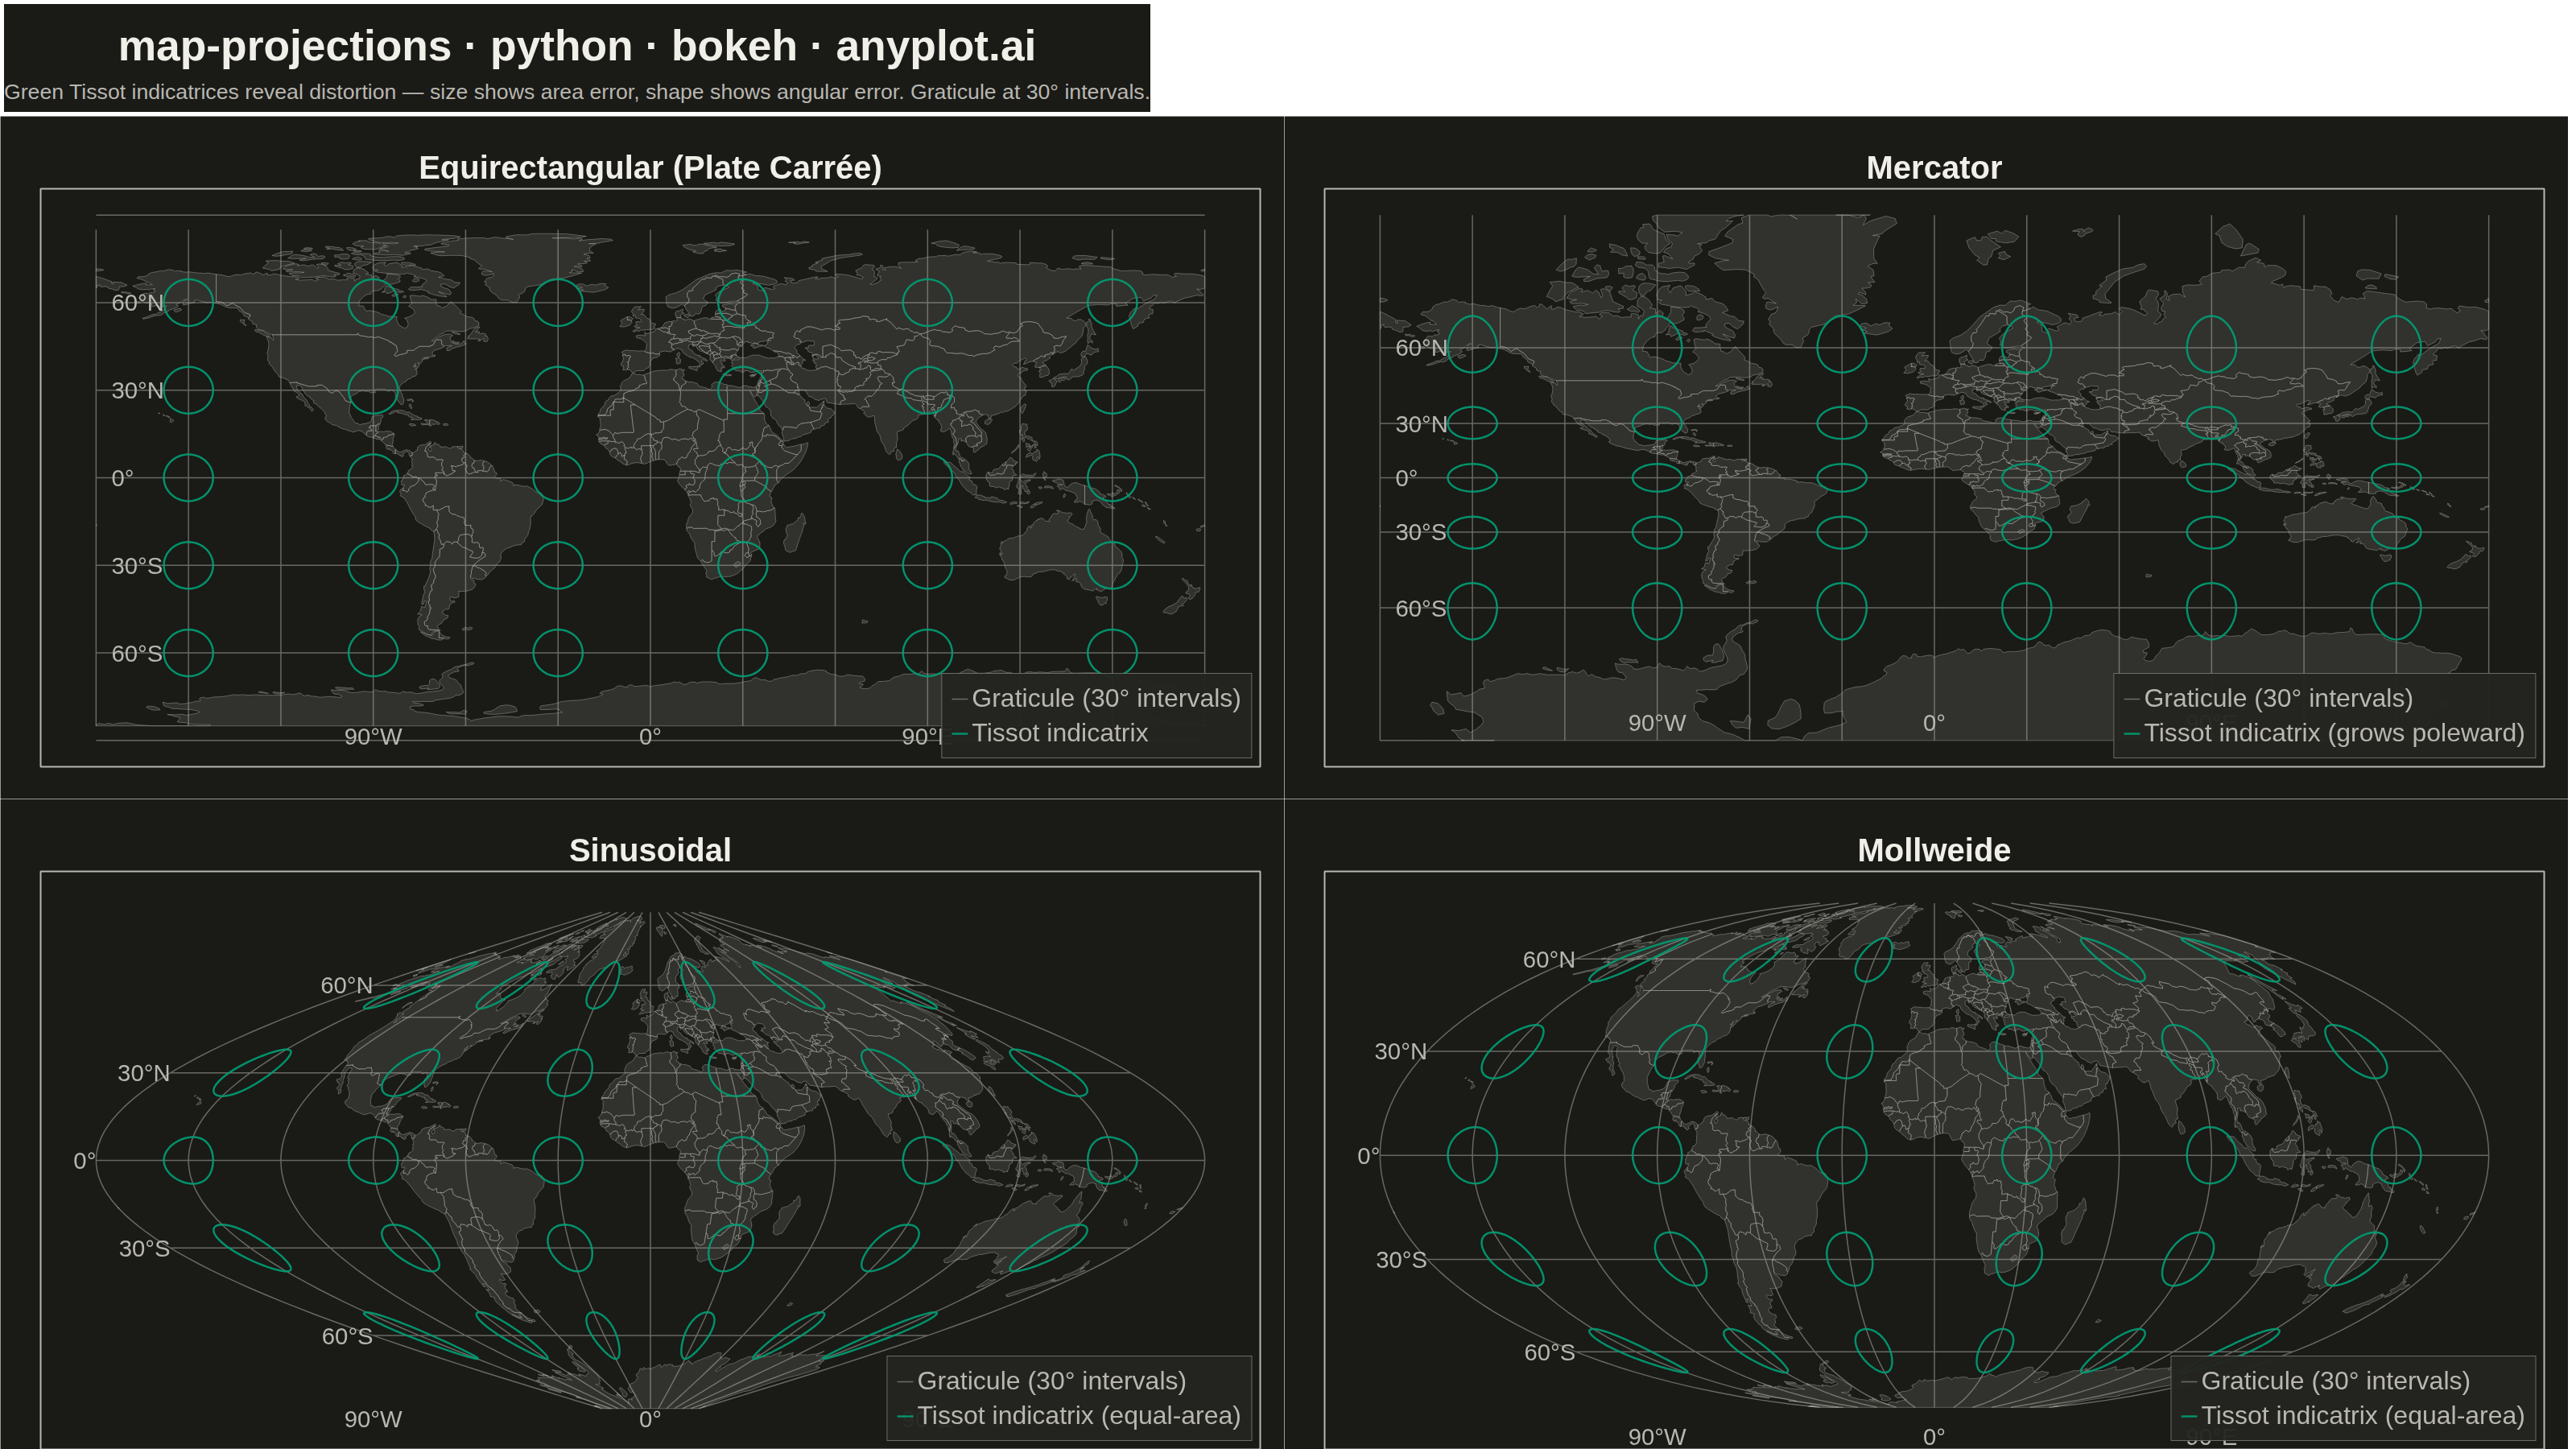
A world map demonstrating different cartographic projections and their distortion characteristics. This visualization showcases how the same geographic data appears under various map projections (Mercator, Robinson, Mollweide, Orthographic, etc.), revealing how each projection preserves or distorts area, shape, distance, or direction. The plot includes graticule (latitude/longitude grid lines) and optionally Tissot indicatrices to illustrate projection distortion patterns.
""" anyplot.ai
map-projections: World Map with Different Projections
Library: bokeh 3.9.0 | Python 3.13.13
Quality: 90/100 | Updated: 2026-05-23
"""

import json
import os
import sys
import time
import urllib.request
from pathlib import Path


# Prevent this file (bokeh.py) from shadowing the installed bokeh package
_this_dir = os.path.dirname(os.path.abspath(__file__))
if _this_dir in sys.path:
    sys.path.remove(_this_dir)

import numpy as np
from bokeh.io import output_file, save
from bokeh.layouts import column, gridplot
from bokeh.models import Div, Legend, LegendItem
from bokeh.plotting import figure
from selenium import webdriver
from selenium.webdriver.chrome.options import Options


np.random.seed(42)

THEME = os.getenv("ANYPLOT_THEME", "light")
PAGE_BG = "#FAF8F1" if THEME == "light" else "#1A1A17"
ELEVATED_BG = "#FFFDF6" if THEME == "light" else "#242420"
INK = "#1A1A17" if THEME == "light" else "#F0EFE8"
INK_SOFT = "#4A4A44" if THEME == "light" else "#B8B7B0"
BRAND = "#009E73"

# --- Natural Earth 110m country outlines ---
_NE_URL = (
    "https://raw.githubusercontent.com/nvkelso/natural-earth-vector/master/geojson/ne_110m_admin_0_countries.geojson"
)
_NE_CACHE = Path(__file__).parent / "countries_110m.json"
if not _NE_CACHE.exists():
    with urllib.request.urlopen(_NE_URL, timeout=30) as _r:
        _NE_CACHE.write_bytes(_r.read())
with _NE_CACHE.open() as _f:
    _WORLD = json.load(_f)

# Extract outer rings from every polygon / sub-polygon
_rings = []
for _feat in _WORLD["features"]:
    _g = _feat["geometry"]
    if _g["type"] == "Polygon":
        _outer = [_g["coordinates"][0]]
    else:  # MultiPolygon
        _outer = [_poly[0] for _poly in _g["coordinates"]]
    for _ring in _outer:
        _rings.append((np.array([p[0] for p in _ring], dtype=float), np.array([p[1] for p in _ring], dtype=float)))


def _moll_theta(lat_r):
    """Mollweide auxiliary angle via Newton's method."""
    th = np.asarray(lat_r, dtype=float).copy()
    lr = np.asarray(lat_r, dtype=float)
    for _ in range(12):
        th += -(2 * th + np.sin(2 * th) - np.pi * np.sin(lr)) / (2 + 2 * np.cos(2 * th) + 1e-12)
    return th


def _country_patches_equirect(lat_clip=85.0):
    xs, ys = [], []
    for lons_d, lats_d in _rings:
        xs.append(np.radians(lons_d).tolist())
        ys.append(np.radians(np.clip(lats_d, -lat_clip, lat_clip)).tolist())
    return xs, ys


def _country_patches_mercator(lat_clip=82.0):
    xs, ys = [], []
    for lons_d, lats_d in _rings:
        lr = np.clip(np.radians(lats_d), np.radians(-lat_clip), np.radians(lat_clip))
        lr = np.clip(lr, -np.pi / 2 * 0.97, np.pi / 2 * 0.97)
        xs.append(np.radians(lons_d).tolist())
        ys.append(np.log(np.tan(np.pi / 4 + lr / 2)).tolist())
    return xs, ys


def _country_patches_sinusoidal(lat_clip=85.0):
    xs, ys = [], []
    for lons_d, lats_d in _rings:
        lr = np.radians(np.clip(lats_d, -lat_clip, lat_clip))
        xs.append((np.radians(lons_d) * np.cos(lr)).tolist())
        ys.append(lr.tolist())
    return xs, ys


def _country_patches_mollweide(lat_clip=85.0):
    xs, ys = [], []
    for lons_d, lats_d in _rings:
        lr = np.radians(np.clip(lats_d, -lat_clip, lat_clip))
        th = _moll_theta(lr)
        xs.append(((2 * np.sqrt(2) / np.pi) * np.radians(lons_d) * np.cos(th)).tolist())
        ys.append((np.sqrt(2) * np.sin(th)).tolist())
    return xs, ys


c1_xs, c1_ys = _country_patches_equirect()
c2_xs, c2_ys = _country_patches_mercator()
c3_xs, c3_ys = _country_patches_sinusoidal()
c4_xs, c4_ys = _country_patches_mollweide()

# Graticule intervals and Tissot positions
lats_deg = np.arange(-90, 91, 30)
lons_deg = np.arange(-180, 181, 30)
tissot_lats = [-60, -30, 0, 30, 60]
tissot_lons = [-150, -90, -30, 30, 90, 150]
tissot_r = 8  # degrees

PANEL_W = 1595
PANEL_H = 848

# =============================================================================
# PANEL 1: Equirectangular (Plate Carrée)
# =============================================================================

grat1_x, grat1_y = [], []
for lon_d in lons_deg:
    lats = np.linspace(-85, 85, 80)
    grat1_x.extend(np.radians(np.full_like(lats, lon_d)).tolist() + [np.nan])
    grat1_y.extend(np.radians(lats).tolist() + [np.nan])
for lat_d in lats_deg:
    lons = np.linspace(-180, 180, 160)
    grat1_x.extend(np.radians(lons).tolist() + [np.nan])
    grat1_y.extend(np.radians(np.full_like(lons, lat_d)).tolist() + [np.nan])

tissot1_x, tissot1_y = [], []
for lat_d in tissot_lats:
    for lon_d in tissot_lons:
        a = np.linspace(0, 2 * np.pi, 50)
        clons = lon_d + tissot_r * np.cos(a)
        clats = np.clip(lat_d + tissot_r * np.sin(a), -85, 85)
        tissot1_x.extend(np.radians(clons).tolist() + [np.nan])
        tissot1_y.extend(np.radians(clats).tolist() + [np.nan])

p1 = figure(
    width=PANEL_W,
    height=PANEL_H,
    title="Equirectangular (Plate Carrée)",
    toolbar_location=None,
    min_border_left=50,
    min_border_right=30,
    min_border_top=90,
    min_border_bottom=40,
)
p1.background_fill_color = PAGE_BG
p1.border_fill_color = PAGE_BG
p1.outline_line_color = INK_SOFT
p1.outline_line_width = 2
p1.title.text_color = INK
p1.title.text_font_size = "30pt"
p1.title.text_font_style = "bold"
p1.title.align = "center"
p1.xaxis.visible = False
p1.yaxis.visible = False
p1.xgrid.visible = False
p1.ygrid.visible = False

p1.patches(
    xs=c1_xs, ys=c1_ys, fill_color=INK_SOFT, fill_alpha=0.15, line_color=INK_SOFT, line_width=0.7, line_alpha=0.6
)
grat1 = p1.line(x=grat1_x, y=grat1_y, line_color=INK_SOFT, line_width=1.5, line_alpha=0.5)
tissot1 = p1.line(x=tissot1_x, y=tissot1_y, line_color=BRAND, line_width=2.5, line_alpha=0.9)

# Lat/lon labels
p1.text(
    x=[np.radians(-175)] * 5,
    y=[np.radians(d) for _, d in [("60°N", 60), ("30°N", 30), ("0°", 0), ("30°S", -30), ("60°S", -60)]],
    text=["60°N", "30°N", "0°", "30°S", "60°S"],
    text_color=INK_SOFT,
    text_font_size="22pt",
    text_align="left",
    text_baseline="middle",
)
p1.text(
    x=[np.radians(d) for _, d in [("90°W", -90), ("0°", 0), ("90°E", 90)]],
    y=[np.radians(-84)] * 3,
    text=["90°W", "0°", "90°E"],
    text_color=INK_SOFT,
    text_font_size="22pt",
    text_align="center",
    text_baseline="top",
)

legend1 = Legend(
    items=[
        LegendItem(label="Graticule (30° intervals)", renderers=[grat1]),
        LegendItem(label="Tissot indicatrix", renderers=[tissot1]),
    ],
    location="bottom_right",
    label_text_font_size="24pt",
    label_text_color=INK_SOFT,
    background_fill_color=ELEVATED_BG,
    border_line_color=INK_SOFT,
    spacing=6,
    padding=12,
)
p1.add_layout(legend1)

# =============================================================================
# PANEL 2: Mercator
# =============================================================================

grat2_x, grat2_y = [], []
for lon_d in lons_deg:
    lats = np.linspace(-82, 82, 80)
    lat_clipped = np.clip(np.radians(lats), -np.pi / 2 * 0.99, np.pi / 2 * 0.99)
    grat2_x.extend(np.radians(np.full_like(lats, lon_d)).tolist() + [np.nan])
    grat2_y.extend(np.log(np.tan(np.pi / 4 + lat_clipped / 2)).tolist() + [np.nan])
for lat_d in np.arange(-60, 61, 30):
    lons = np.linspace(-180, 180, 160)
    lat_clipped = np.clip(np.radians(lat_d), -np.pi / 2 * 0.99, np.pi / 2 * 0.99)
    y_val = np.log(np.tan(np.pi / 4 + lat_clipped / 2))
    grat2_x.extend(np.radians(lons).tolist() + [np.nan])
    grat2_y.extend(np.full(160, y_val).tolist() + [np.nan])

tissot2_x, tissot2_y = [], []
for lat_d in [-60, -30, 0, 30, 60]:
    for lon_d in tissot_lons:
        a = np.linspace(0, 2 * np.pi, 50)
        clons = lon_d + tissot_r * np.cos(a)
        clats = np.clip(lat_d + tissot_r * np.sin(a), -82, 82)
        lat_clipped2 = np.clip(np.radians(clats), -np.pi / 2 * 0.99, np.pi / 2 * 0.99)
        tissot2_x.extend(np.radians(clons).tolist() + [np.nan])
        tissot2_y.extend(np.log(np.tan(np.pi / 4 + lat_clipped2 / 2)).tolist() + [np.nan])

p2 = figure(
    width=PANEL_W,
    height=PANEL_H,
    title="Mercator",
    toolbar_location=None,
    min_border_left=50,
    min_border_right=30,
    min_border_top=90,
    min_border_bottom=40,
)
p2.background_fill_color = PAGE_BG
p2.border_fill_color = PAGE_BG
p2.outline_line_color = INK_SOFT
p2.outline_line_width = 2
p2.title.text_color = INK
p2.title.text_font_size = "30pt"
p2.title.text_font_style = "bold"
p2.title.align = "center"
p2.xaxis.visible = False
p2.yaxis.visible = False
p2.xgrid.visible = False
p2.ygrid.visible = False

p2.patches(
    xs=c2_xs, ys=c2_ys, fill_color=INK_SOFT, fill_alpha=0.15, line_color=INK_SOFT, line_width=0.7, line_alpha=0.6
)
grat2 = p2.line(x=grat2_x, y=grat2_y, line_color=INK_SOFT, line_width=1.5, line_alpha=0.5)
tissot2 = p2.line(x=tissot2_x, y=tissot2_y, line_color=BRAND, line_width=2.5, line_alpha=0.9)

merc_y_labels = [
    np.log(np.tan(np.pi / 4 + np.clip(np.radians(d), -np.pi / 2 * 0.99, np.pi / 2 * 0.99) / 2))
    for _, d in [("60°N", 60), ("30°N", 30), ("0°", 0), ("30°S", -30), ("60°S", -60)]
]
p2.text(
    x=[np.radians(-175)] * 5,
    y=merc_y_labels,
    text=["60°N", "30°N", "0°", "30°S", "60°S"],
    text_color=INK_SOFT,
    text_font_size="22pt",
    text_align="left",
    text_baseline="middle",
)
merc_y_bottom = np.log(np.tan(np.pi / 4 + np.clip(np.radians(-79), -np.pi / 2 * 0.99, np.pi / 2 * 0.99) / 2))
p2.text(
    x=[np.radians(d) for _, d in [("90°W", -90), ("0°", 0), ("90°E", 90)]],
    y=[merc_y_bottom] * 3,
    text=["90°W", "0°", "90°E"],
    text_color=INK_SOFT,
    text_font_size="22pt",
    text_align="center",
    text_baseline="top",
)

legend2 = Legend(
    items=[
        LegendItem(label="Graticule (30° intervals)", renderers=[grat2]),
        LegendItem(label="Tissot indicatrix (grows poleward)", renderers=[tissot2]),
    ],
    location="bottom_right",
    label_text_font_size="24pt",
    label_text_color=INK_SOFT,
    background_fill_color=ELEVATED_BG,
    border_line_color=INK_SOFT,
    spacing=6,
    padding=12,
)
p2.add_layout(legend2)

# =============================================================================
# PANEL 3: Sinusoidal
# =============================================================================

grat3_x, grat3_y = [], []
for lon_d in lons_deg:
    lats = np.linspace(-85, 85, 80)
    lrs = np.radians(lats)
    grat3_x.extend((np.radians(lon_d) * np.cos(lrs)).tolist() + [np.nan])
    grat3_y.extend(lrs.tolist() + [np.nan])
for lat_d in lats_deg:
    lons = np.linspace(-180, 180, 160)
    lr = np.radians(lat_d)
    grat3_x.extend((np.radians(lons) * np.cos(lr)).tolist() + [np.nan])
    grat3_y.extend(np.full(160, lr).tolist() + [np.nan])

tissot3_x, tissot3_y = [], []
for lat_d in tissot_lats:
    for lon_d in tissot_lons:
        a = np.linspace(0, 2 * np.pi, 50)
        clons = lon_d + tissot_r * np.cos(a)
        clats = np.clip(lat_d + tissot_r * np.sin(a), -85, 85)
        lrs = np.radians(clats)
        tissot3_x.extend((np.radians(clons) * np.cos(lrs)).tolist() + [np.nan])
        tissot3_y.extend(lrs.tolist() + [np.nan])

p3 = figure(
    width=PANEL_W,
    height=PANEL_H,
    title="Sinusoidal",
    toolbar_location=None,
    min_border_left=50,
    min_border_right=30,
    min_border_top=90,
    min_border_bottom=40,
)
p3.background_fill_color = PAGE_BG
p3.border_fill_color = PAGE_BG
p3.outline_line_color = INK_SOFT
p3.outline_line_width = 2
p3.title.text_color = INK
p3.title.text_font_size = "30pt"
p3.title.text_font_style = "bold"
p3.title.align = "center"
p3.xaxis.visible = False
p3.yaxis.visible = False
p3.xgrid.visible = False
p3.ygrid.visible = False

p3.patches(
    xs=c3_xs, ys=c3_ys, fill_color=INK_SOFT, fill_alpha=0.15, line_color=INK_SOFT, line_width=0.7, line_alpha=0.6
)
grat3 = p3.line(x=grat3_x, y=grat3_y, line_color=INK_SOFT, line_width=1.5, line_alpha=0.5)
tissot3 = p3.line(x=tissot3_x, y=tissot3_y, line_color=BRAND, line_width=2.5, line_alpha=0.9)

# Lat labels (left edge of each parallel)
sin_edge_x = [
    np.radians(-180) * np.cos(np.radians(d))
    for _, d in [("60°N", 60), ("30°N", 30), ("0°", 0), ("30°S", -30), ("60°S", -60)]
]
sin_edge_y = [np.radians(d) for _, d in [("60°N", 60), ("30°N", 30), ("0°", 0), ("30°S", -30), ("60°S", -60)]]
p3.text(
    x=sin_edge_x,
    y=sin_edge_y,
    text=["60°N", "30°N", "0°", "30°S", "60°S"],
    text_color=INK_SOFT,
    text_font_size="22pt",
    text_align="right",
    text_baseline="middle",
)
# Lon labels along the equator (widest part of sinusoidal projection)
p3.text(
    x=[np.radians(d) for _, d in [("90°W", -90), ("0°", 0), ("90°E", 90)]],
    y=[np.radians(-84)] * 3,
    text=["90°W", "0°", "90°E"],
    text_color=INK_SOFT,
    text_font_size="22pt",
    text_align="center",
    text_baseline="top",
)

legend3 = Legend(
    items=[
        LegendItem(label="Graticule (30° intervals)", renderers=[grat3]),
        LegendItem(label="Tissot indicatrix (equal-area)", renderers=[tissot3]),
    ],
    location="bottom_right",
    label_text_font_size="24pt",
    label_text_color=INK_SOFT,
    background_fill_color=ELEVATED_BG,
    border_line_color=INK_SOFT,
    spacing=6,
    padding=12,
)
p3.add_layout(legend3)

# =============================================================================
# PANEL 4: Mollweide
# =============================================================================

grat4_x, grat4_y = [], []
for lon_d in lons_deg:
    lats = np.linspace(-85, 85, 80)
    lat_rad = np.radians(lats)
    theta = lat_rad.copy()
    for _ in range(12):
        theta += -(2 * theta + np.sin(2 * theta) - np.pi * np.sin(lat_rad)) / (2 + 2 * np.cos(2 * theta) + 1e-12)
    grat4_x.extend(((2 * np.sqrt(2) / np.pi) * np.radians(lon_d) * np.cos(theta)).tolist() + [np.nan])
    grat4_y.extend((np.sqrt(2) * np.sin(theta)).tolist() + [np.nan])
for lat_d in lats_deg:
    lons = np.linspace(-180, 180, 160)
    lat_rad = np.full(160, np.radians(lat_d))
    theta = lat_rad.copy()
    for _ in range(12):
        theta += -(2 * theta + np.sin(2 * theta) - np.pi * np.sin(lat_rad)) / (2 + 2 * np.cos(2 * theta) + 1e-12)
    grat4_x.extend(((2 * np.sqrt(2) / np.pi) * np.radians(lons) * np.cos(theta)).tolist() + [np.nan])
    grat4_y.extend((np.sqrt(2) * np.sin(theta)).tolist() + [np.nan])

tissot4_x, tissot4_y = [], []
for lat_d in tissot_lats:
    for lon_d in tissot_lons:
        a = np.linspace(0, 2 * np.pi, 50)
        clons = lon_d + tissot_r * np.cos(a)
        clats = np.clip(lat_d + tissot_r * np.sin(a), -85, 85)
        lat_rad = np.radians(clats)
        theta = lat_rad.copy()
        for _ in range(12):
            theta += -(2 * theta + np.sin(2 * theta) - np.pi * np.sin(lat_rad)) / (2 + 2 * np.cos(2 * theta) + 1e-12)
        tissot4_x.extend(((2 * np.sqrt(2) / np.pi) * np.radians(clons) * np.cos(theta)).tolist() + [np.nan])
        tissot4_y.extend((np.sqrt(2) * np.sin(theta)).tolist() + [np.nan])

p4 = figure(
    width=PANEL_W,
    height=PANEL_H,
    title="Mollweide",
    toolbar_location=None,
    min_border_left=50,
    min_border_right=30,
    min_border_top=90,
    min_border_bottom=40,
)
p4.background_fill_color = PAGE_BG
p4.border_fill_color = PAGE_BG
p4.outline_line_color = INK_SOFT
p4.outline_line_width = 2
p4.title.text_color = INK
p4.title.text_font_size = "30pt"
p4.title.text_font_style = "bold"
p4.title.align = "center"
p4.xaxis.visible = False
p4.yaxis.visible = False
p4.xgrid.visible = False
p4.ygrid.visible = False

p4.patches(
    xs=c4_xs, ys=c4_ys, fill_color=INK_SOFT, fill_alpha=0.15, line_color=INK_SOFT, line_width=0.7, line_alpha=0.6
)
grat4 = p4.line(x=grat4_x, y=grat4_y, line_color=INK_SOFT, line_width=1.5, line_alpha=0.5)
tissot4 = p4.line(x=tissot4_x, y=tissot4_y, line_color=BRAND, line_width=2.5, line_alpha=0.9)

# Lat labels at the left edge of the Mollweide ellipse
moll_edge_x, moll_edge_y = [], []
for lat_val in [60, 30, 0, -30, -60]:
    lr = np.array([np.radians(lat_val)])
    th = lr.copy()
    for _ in range(12):
        th += -(2 * th + np.sin(2 * th) - np.pi * np.sin(lr)) / (2 + 2 * np.cos(2 * th) + 1e-12)
    moll_edge_x.append(float((2 * np.sqrt(2) / np.pi) * np.radians(-180) * np.cos(th)[0]))
    moll_edge_y.append(float(np.sqrt(2) * np.sin(th)[0]))

p4.text(
    x=moll_edge_x,
    y=moll_edge_y,
    text=["60°N", "30°N", "0°", "30°S", "60°S"],
    text_color=INK_SOFT,
    text_font_size="22pt",
    text_align="right",
    text_baseline="middle",
)
# Lon labels along the equatorial axis (widest row of the Mollweide ellipse)
_moll_lon_x = [(2 * np.sqrt(2) / np.pi) * np.radians(d) for d in [-90, 0, 90]]
p4.text(
    x=_moll_lon_x,
    y=[-1.47, -1.47, -1.47],
    text=["90°W", "0°", "90°E"],
    text_color=INK_SOFT,
    text_font_size="22pt",
    text_align="center",
    text_baseline="top",
)

legend4 = Legend(
    items=[
        LegendItem(label="Graticule (30° intervals)", renderers=[grat4]),
        LegendItem(label="Tissot indicatrix (equal-area)", renderers=[tissot4]),
    ],
    location="bottom_right",
    label_text_font_size="24pt",
    label_text_color=INK_SOFT,
    background_fill_color=ELEVATED_BG,
    border_line_color=INK_SOFT,
    spacing=6,
    padding=12,
)
p4.add_layout(legend4)

# =============================================================================
# Layout and save
# =============================================================================

grid = gridplot([[p1, p2], [p3, p4]], merge_tools=False, toolbar_location=None)

title_div = Div(
    text=(
        f"<style>body,html{{background:{PAGE_BG};margin:0;padding:0;}}</style>"
        f"<div style='background:{PAGE_BG};text-align:center;padding:14px 0 6px 0;"
        f"font-family:sans-serif;'>"
        f"<span style='font-size:40pt;font-weight:bold;color:{INK};'>"
        f"map-projections · python · bokeh · anyplot.ai</span><br>"
        f"<span style='font-size:20pt;color:{INK_SOFT};'>"
        f"Green Tissot indicatrices reveal distortion — size shows area error, "
        f"shape shows angular error. Graticule at 30° intervals.</span></div>"
    ),
    width=3200,
)

layout = column(title_div, grid, spacing=0)

output_file(f"plot-{THEME}.html")
save(layout)

W, H = 3200, 1800
WIN_H = H + 200
opts = Options()
for arg in (
    "--headless=new",
    "--no-sandbox",
    "--disable-dev-shm-usage",
    "--disable-gpu",
    f"--window-size={W},{WIN_H}",
    "--hide-scrollbars",
    "--force-device-scale-factor=1",
):
    opts.add_argument(arg)
driver = webdriver.Chrome(options=opts)
driver.set_window_size(W, WIN_H)
driver.get(f"file://{Path(f'plot-{THEME}.html').resolve()}")
time.sleep(3)
driver.save_screenshot(f"plot-{THEME}.png")
driver.quit()

# Crop / pad to exactly 3200×1800
from PIL import Image as _PILImage


_img = _PILImage.open(f"plot-{THEME}.png")
_iw, _ih = _img.size
if _iw != W or _ih != H:
    _canvas = _PILImage.new("RGB", (W, H), PAGE_BG)
    _canvas.paste(_img.crop((0, 0, min(_iw, W), min(_ih, H))), (0, 0))
    _canvas.save(f"plot-{THEME}.png")
Runnable source as JSON, for any HTTP client: https://api.anyplot.ai/specs/map-projections/bokeh/code. Any spec id and library id listed in llms-full.txt fit the same URL shape; every URL below is complete and callable.
{
  "spec_id": "map-projections",
  "language": "python",
  "library": "bokeh",
  "page": "https://anyplot.ai/map-projections/python/bokeh",
  "hub": "https://anyplot.ai/map-projections",
  "code_json": "https://api.anyplot.ai/specs/map-projections/bokeh/code",
  "spec_json": "https://api.anyplot.ai/specs/map-projections",
  "render_light_png": "https://storage.googleapis.com/anyplot-images/plots/map-projections/python/bokeh/plot-light.png",
  "render_dark_png": "https://storage.googleapis.com/anyplot-images/plots/map-projections/python/bokeh/plot-dark.png",
  "interactive_light_html": "https://storage.googleapis.com/anyplot-images/plots/map-projections/python/bokeh/plot-light.html",
  "interactive_dark_html": "https://storage.googleapis.com/anyplot-images/plots/map-projections/python/bokeh/plot-dark.html",
  "quality_score": 90.0,
  "license": "MIT",
  "guide": "https://anyplot.ai/llms.txt"
}
Part of World Map with Different Projections on anyplot.ai.