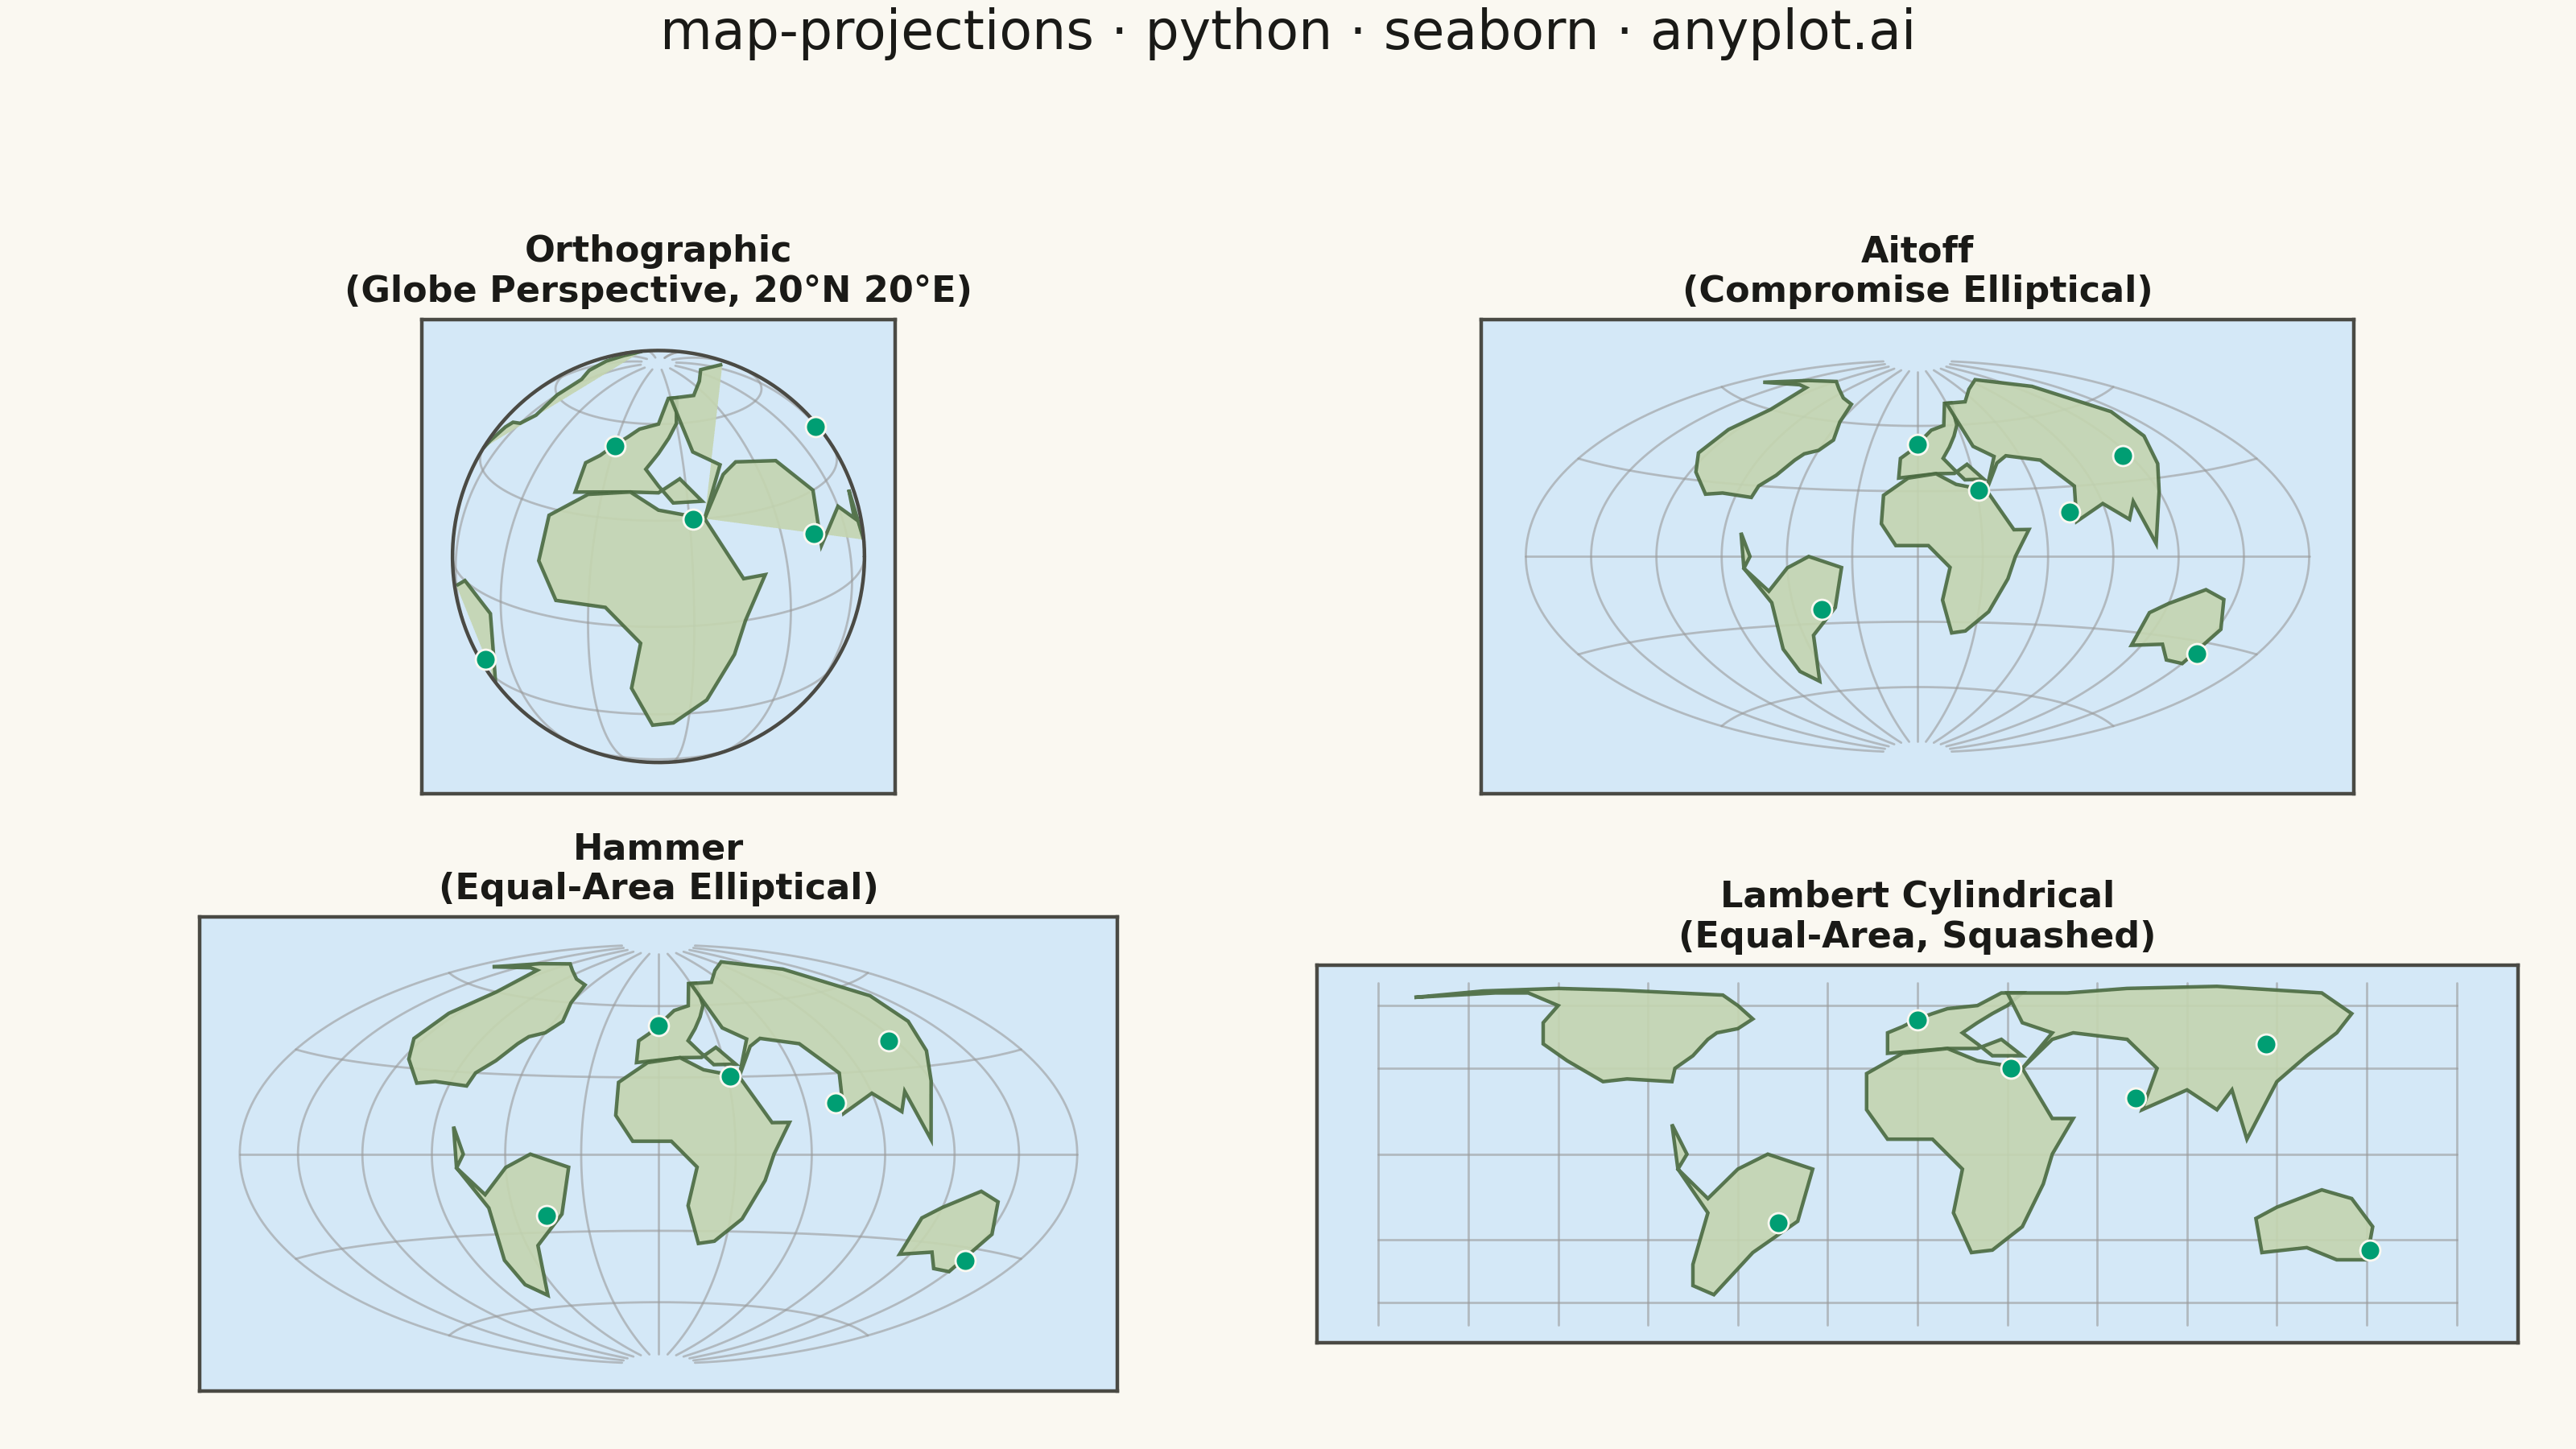
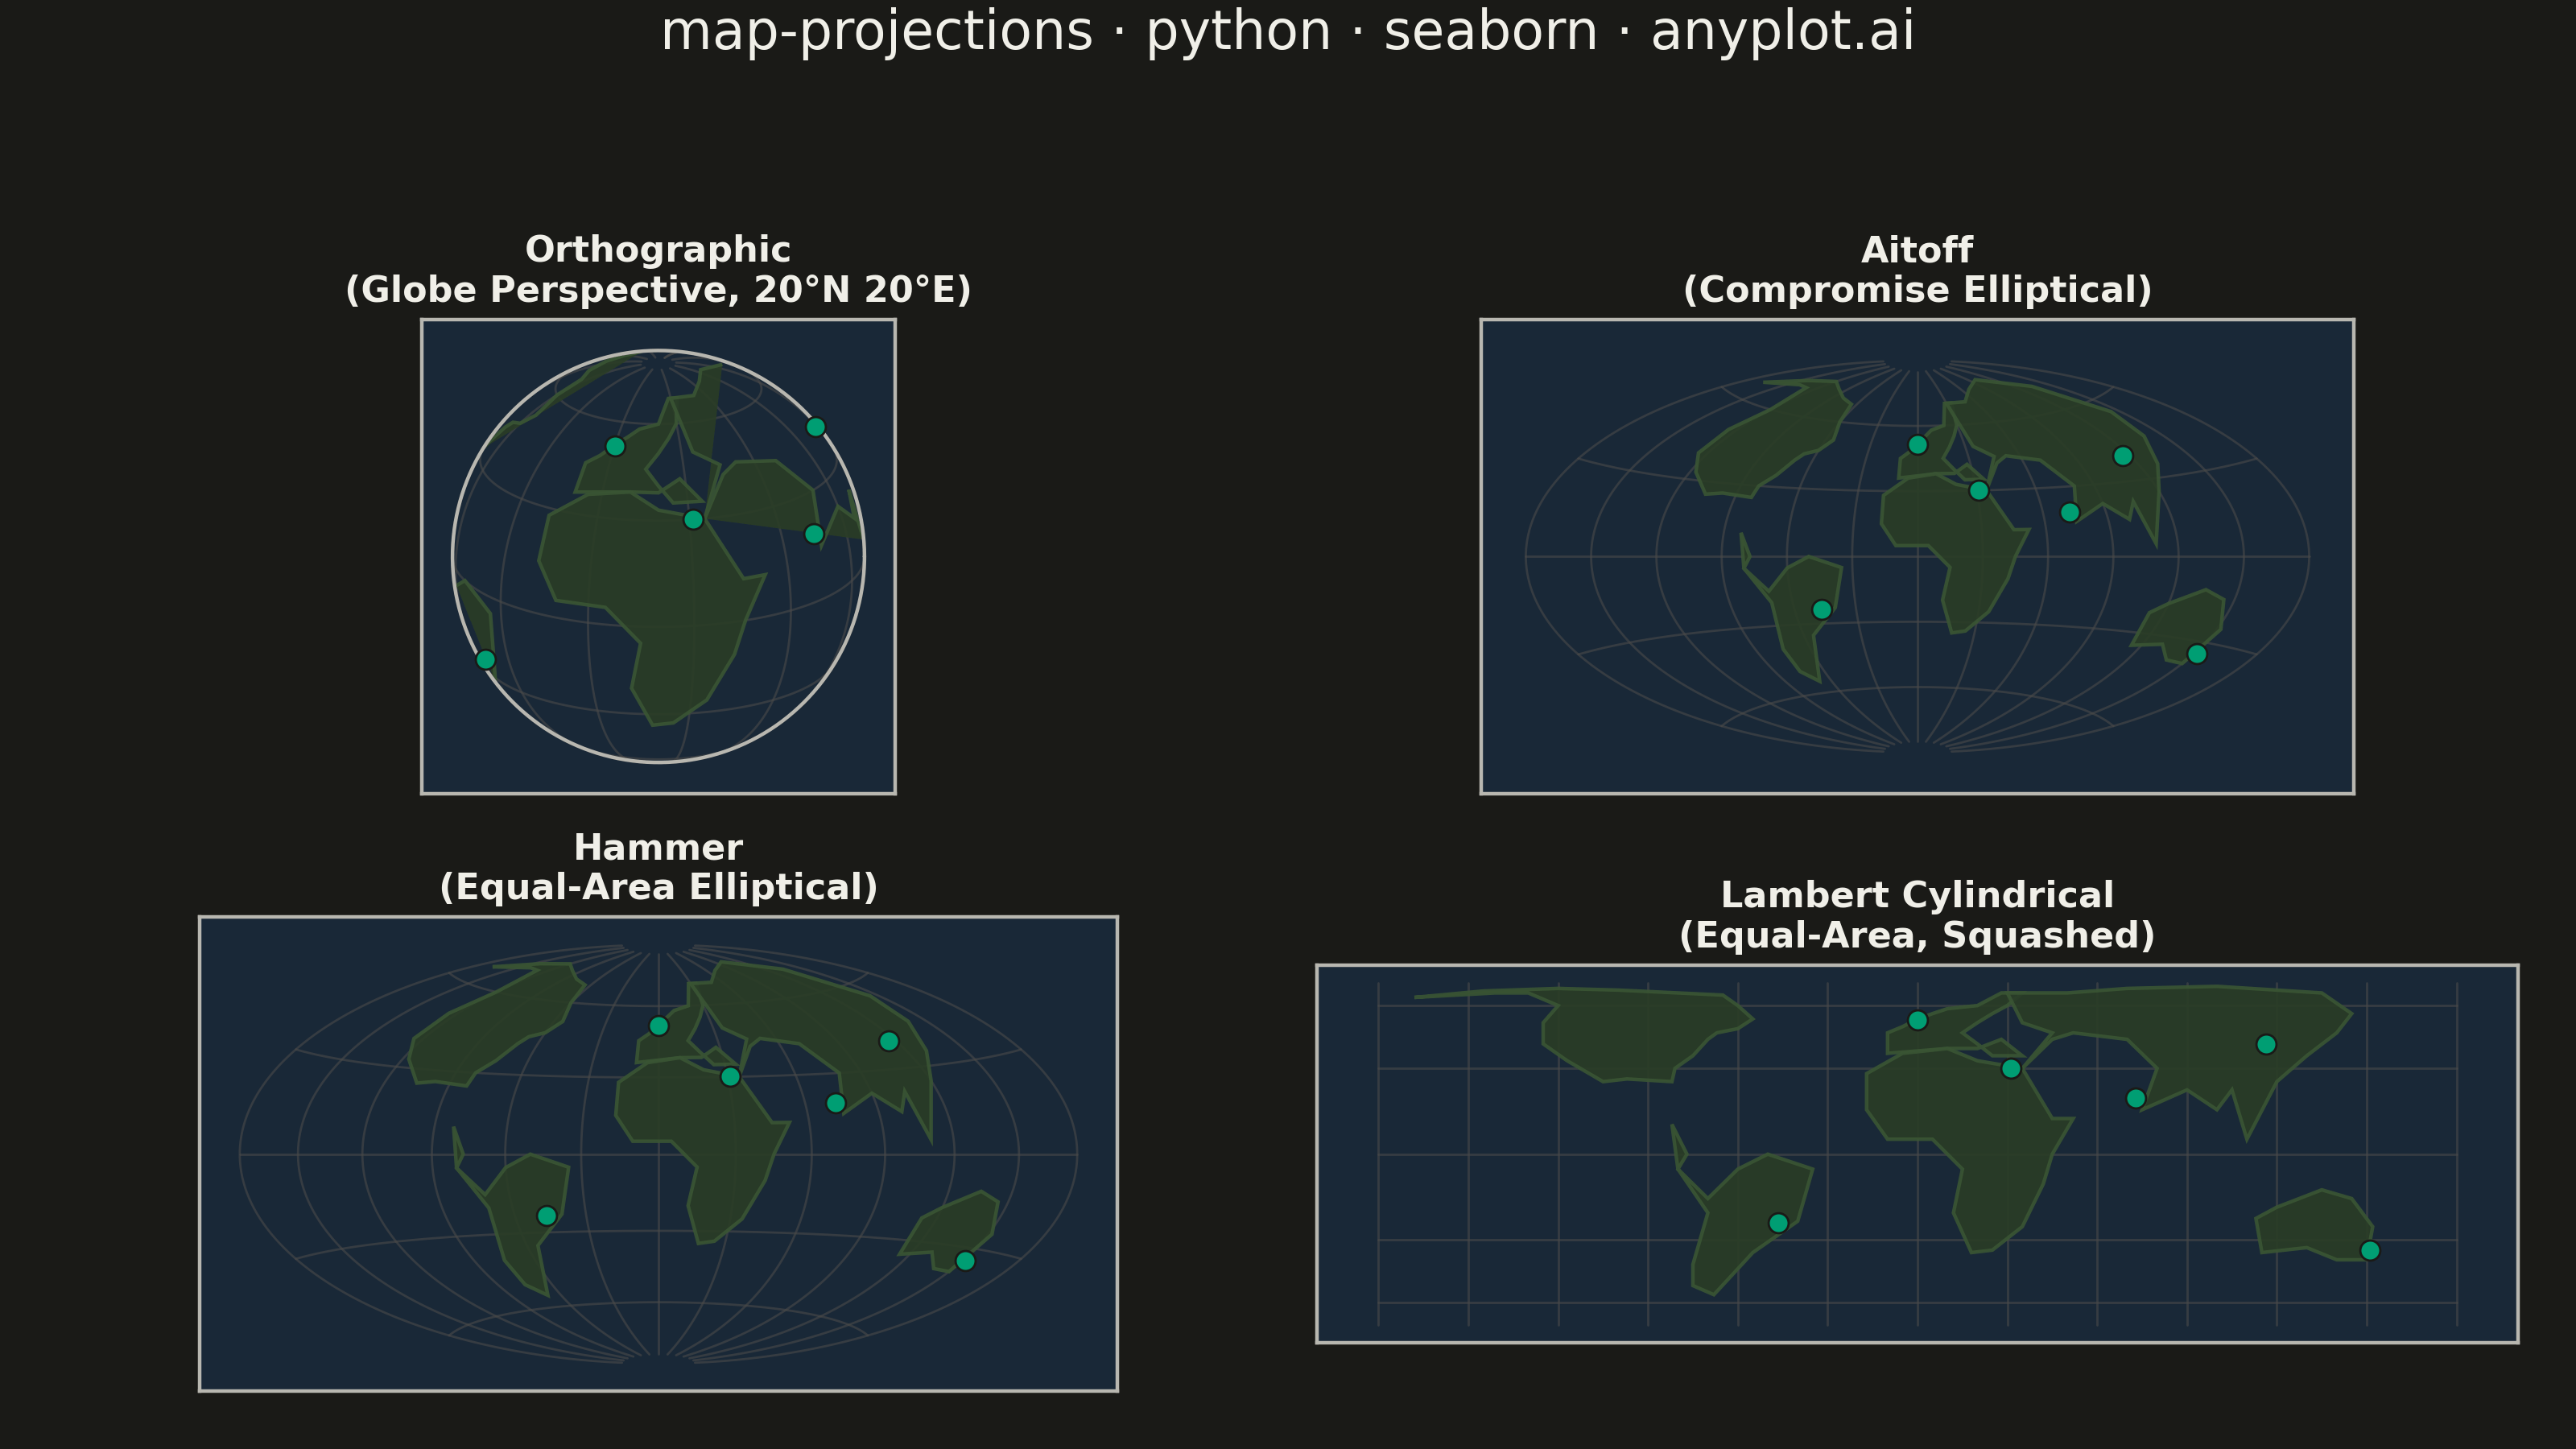
A world map demonstrating different cartographic projections and their distortion characteristics. This visualization showcases how the same geographic data appears under various map projections (Mercator, Robinson, Mollweide, Orthographic, etc.), revealing how each projection preserves or distorts area, shape, distance, or direction. The plot includes graticule (latitude/longitude grid lines) and optionally Tissot indicatrices to illustrate projection distortion patterns.
""" anyplot.ai
map-projections: World Map with Different Projections
Library: seaborn 0.13.2 | Python 3.13.13
Quality: 85/100 | Updated: 2026-05-23
"""

import json
import os
import urllib.request

import matplotlib.pyplot as plt
import numpy as np
import pandas as pd
import seaborn as sns


# Theme tokens
THEME = os.getenv("ANYPLOT_THEME", "light")
PAGE_BG = "#FAF8F1" if THEME == "light" else "#1A1A17"
ELEVATED_BG = "#FFFDF6" if THEME == "light" else "#242420"
INK = "#1A1A17" if THEME == "light" else "#F0EFE8"
INK_SOFT = "#4A4A44" if THEME == "light" else "#B8B7B0"

# Geographic semantic colors (theme-adaptive)
OCEAN = "#D4E8F7" if THEME == "light" else "#192837"
LAND = "#C4D5B0" if THEME == "light" else "#2A3D26"
LAND_EDGE = "#4A6A40" if THEME == "light" else "#3A5534"
GRID = "#9A9A9A" if THEME == "light" else "#4A4A4A"

sns.set_theme(
    style="white",
    rc={
        "figure.facecolor": PAGE_BG,
        "axes.facecolor": OCEAN,
        "axes.edgecolor": INK_SOFT,
        "text.color": INK,
        "xtick.color": INK_SOFT,
        "ytick.color": INK_SOFT,
    },
)

# Load Natural Earth 110m country boundaries (~177 countries)
_NE_URL = (
    "https://raw.githubusercontent.com/nvkelso/natural-earth-vector/master/geojson/ne_110m_admin_0_countries.geojson"
)
with urllib.request.urlopen(_NE_URL, timeout=20) as _resp:
    _geojson = json.loads(_resp.read())

# Extract outer rings for each country polygon
country_rings = []
for _feat in _geojson["features"]:
    _geom = _feat["geometry"]
    if _geom["type"] == "Polygon":
        country_rings.append(np.array(_geom["coordinates"][0]))
    elif _geom["type"] == "MultiPolygon":
        for _poly in _geom["coordinates"]:
            country_rings.append(np.array(_poly[0]))

# Major city reference points for seaborn scatterplot layer
cities = pd.DataFrame(
    {
        "name": ["London", "São Paulo", "Mumbai", "Cairo", "Beijing", "Sydney"],
        "lon": [0.1, -46.6, 72.8, 31.2, 116.4, 151.2],
        "lat": [51.5, -23.5, 19.1, 30.1, 39.9, -33.9],
    }
)


def project(lons, lats, proj):
    lons = np.asarray(lons, dtype=float)
    lats = np.asarray(lats, dtype=float)
    lr = np.radians(lons)
    pr = np.radians(lats)

    if proj == "orthographic":
        # Perspective from space, centered 20°N 20°E (Europe/Africa/Asia view)
        p0, l0 = np.radians(20.0), np.radians(20.0)
        cos_c = np.sin(p0) * np.sin(pr) + np.cos(p0) * np.cos(pr) * np.cos(lr - l0)
        x = np.cos(pr) * np.sin(lr - l0)
        y = np.cos(p0) * np.sin(pr) - np.sin(p0) * np.cos(pr) * np.cos(lr - l0)
        x = np.where(cos_c >= 0, x, np.nan)
        y = np.where(cos_c >= 0, y, np.nan)

    elif proj == "aitoff":
        # Compromise elliptical — full globe, balanced distortion
        alpha = np.arccos(np.clip(np.cos(pr) * np.cos(lr / 2), -1.0, 1.0))
        sin_a = np.sin(alpha)
        k = np.where(sin_a < 1e-10, 1.0, alpha / sin_a)
        x = 2 * k * np.cos(pr) * np.sin(lr / 2)
        y = k * np.sin(pr)

    elif proj == "hammer":
        # Equal-area elliptical (Hammer–Aitoff)
        z = np.sqrt(1 + np.cos(pr) * np.cos(lr / 2))
        x = 2 * np.sqrt(2) * np.cos(pr) * np.sin(lr / 2) / z
        y = np.sqrt(2) * np.sin(pr) / z

    else:  # lambert_cylindrical — equal-area, strongly squashed poles
        x = lr
        y = np.sin(pr)

    return x, y


# Projection configurations
proj_configs = [
    ("orthographic", "Orthographic\n(Globe Perspective, 20°N 20°E)", (-1.15, 1.15), (-1.15, 1.15)),
    ("aitoff", "Aitoff\n(Compromise Elliptical)", (-3.5, 3.5), (-1.9, 1.9)),
    ("hammer", "Hammer\n(Equal-Area Elliptical)", (-3.1, 3.1), (-1.6, 1.6)),
    ("lambert_cylindrical", "Lambert Cylindrical\n(Equal-Area, Squashed)", (-3.5, 3.5), (-1.1, 1.1)),
]

fig, axes = plt.subplots(2, 2, figsize=(8, 4.5), dpi=400, facecolor=PAGE_BG)
axes = axes.flatten()

for idx, (proj_key, title, xlim, ylim) in enumerate(proj_configs):
    ax = axes[idx]
    ax.set_facecolor(OCEAN)

    # Graticule: meridians every 30°
    for lon in range(-180, 181, 30):
        lts = np.linspace(-85, 85, 120)
        xs, ys = project(np.full_like(lts, float(lon)), lts, proj_key)
        ax.plot(xs, ys, color=GRID, linewidth=0.5, alpha=0.6)

    # Graticule: parallels every 30°
    for lat in range(-60, 61, 30):
        lns = np.linspace(-180, 180, 300)
        xs, ys = project(lns, np.full_like(lns, float(lat)), proj_key)
        ax.plot(xs, ys, color=GRID, linewidth=0.5, alpha=0.6)

    # Country boundaries (~177 countries) — fills land, edges form country borders
    for ring in country_rings:
        lons_c, lats_c = ring[:, 0], ring[:, 1]
        xs, ys = project(lons_c, lats_c, proj_key)
        if (~np.isnan(xs)).sum() >= 3:
            ax.fill(xs, ys, color=LAND, edgecolor=LAND_EDGE, linewidth=0.4, alpha=0.9, zorder=2)

    # Horizon circle for orthographic
    if proj_key == "orthographic":
        t = np.linspace(0, 2 * np.pi, 360)
        ax.plot(np.cos(t), np.sin(t), color=INK_SOFT, linewidth=0.8, zorder=5)

    # City reference dots — seaborn scatterplot layer; s=70 for 6 sparse points
    cx, cy = project(cities["lon"].values, cities["lat"].values, proj_key)
    city_df = pd.DataFrame({"x": cx, "y": cy})
    visible = ~np.isnan(cx)
    if visible.any():
        sns.scatterplot(
            data=city_df[visible],
            x="x",
            y="y",
            color="#009E73",
            s=70,
            marker="o",
            edgecolor=PAGE_BG,
            linewidth=0.5,
            legend=False,
            zorder=6,
            ax=ax,
        )

    ax.set_xlim(xlim)
    ax.set_ylim(ylim)
    ax.set_aspect("equal")
    ax.set_xticks([])
    ax.set_yticks([])
    ax.set_xlabel("")
    ax.set_ylabel("")
    ax.set_title(title, fontsize=8, fontweight="bold", color=INK, pad=4)
    for spine in ax.spines.values():
        spine.set_edgecolor(INK_SOFT)
        spine.set_linewidth(0.8)

fig.suptitle("map-projections · python · seaborn · anyplot.ai", fontsize=12, fontweight="medium", color=INK, y=0.995)

plt.tight_layout(rect=[0, 0, 1, 0.955])
plt.savefig(f"plot-{THEME}.png", dpi=400, facecolor=PAGE_BG)
plt.close()
Runnable source as JSON, for any HTTP client: https://api.anyplot.ai/specs/map-projections/seaborn/code. Any spec id and library id listed in llms-full.txt fit the same URL shape; every URL below is complete and callable.
{
  "spec_id": "map-projections",
  "language": "python",
  "library": "seaborn",
  "page": "https://anyplot.ai/map-projections/python/seaborn",
  "hub": "https://anyplot.ai/map-projections",
  "code_json": "https://api.anyplot.ai/specs/map-projections/seaborn/code",
  "spec_json": "https://api.anyplot.ai/specs/map-projections",
  "render_light_png": "https://storage.googleapis.com/anyplot-images/plots/map-projections/python/seaborn/plot-light.png",
  "render_dark_png": "https://storage.googleapis.com/anyplot-images/plots/map-projections/python/seaborn/plot-dark.png",
  "quality_score": 85.0,
  "license": "MIT",
  "guide": "https://anyplot.ai/llms.txt"
}
Part of World Map with Different Projections on anyplot.ai.