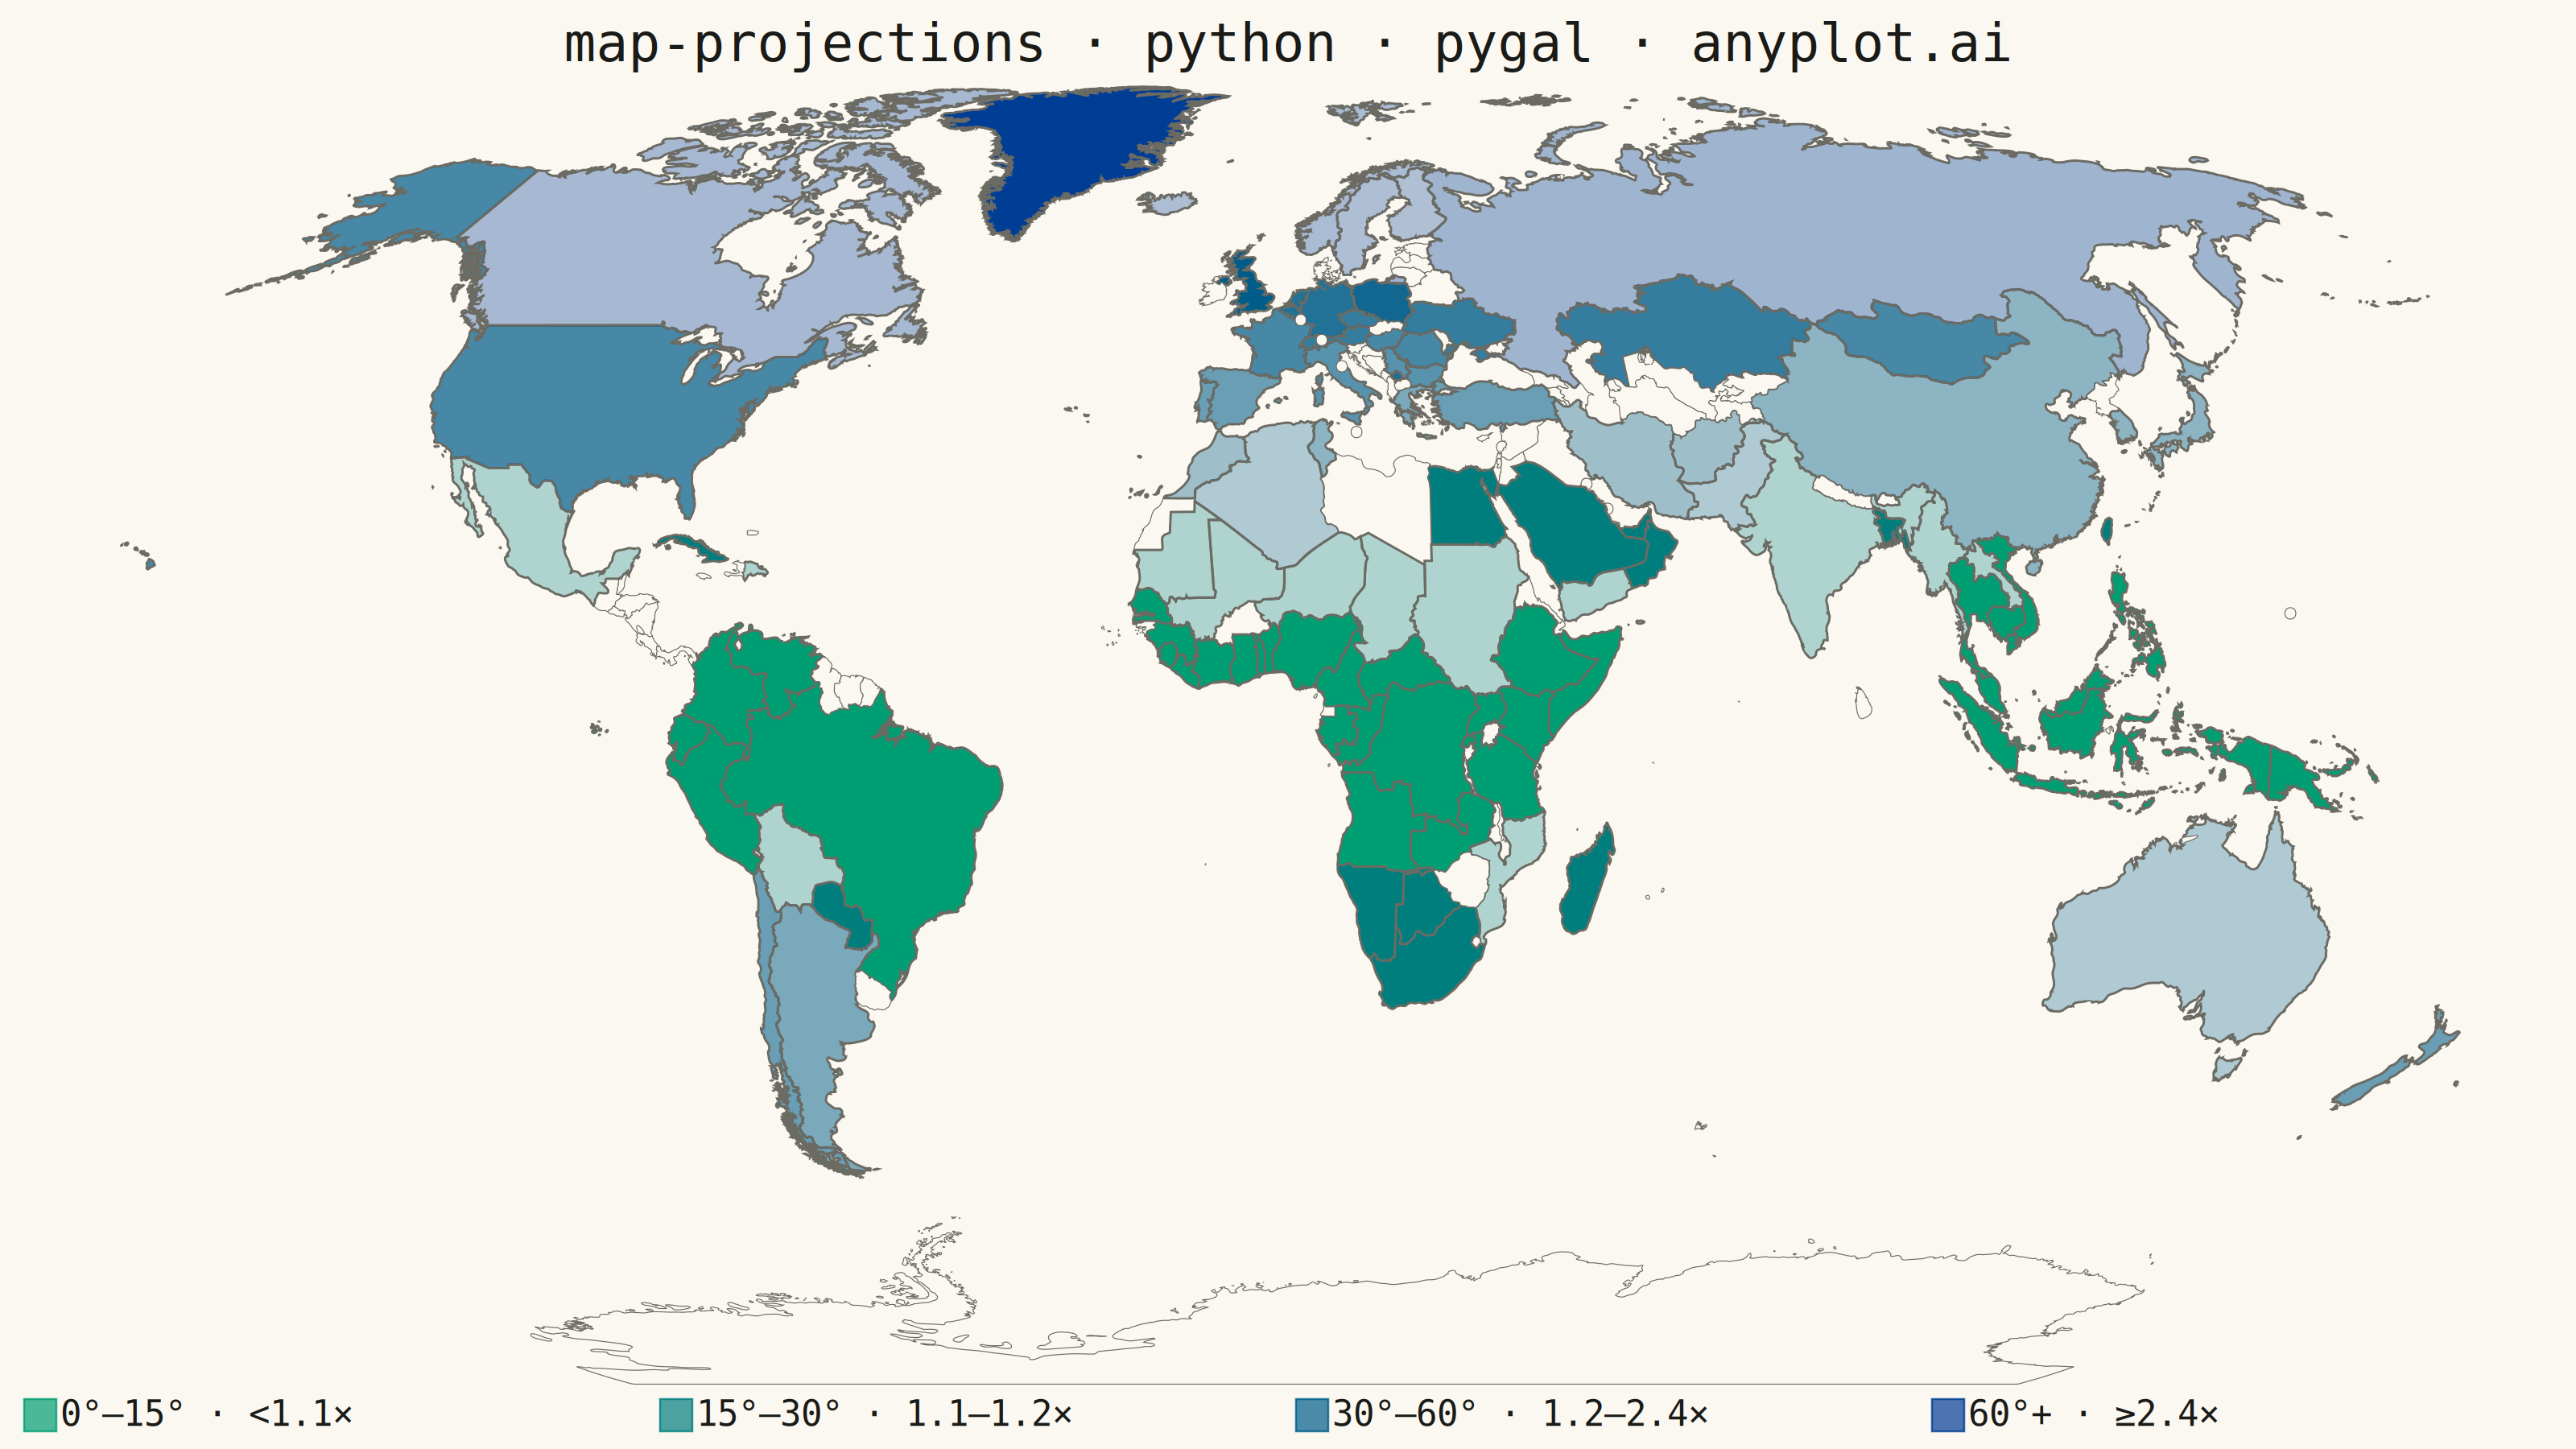
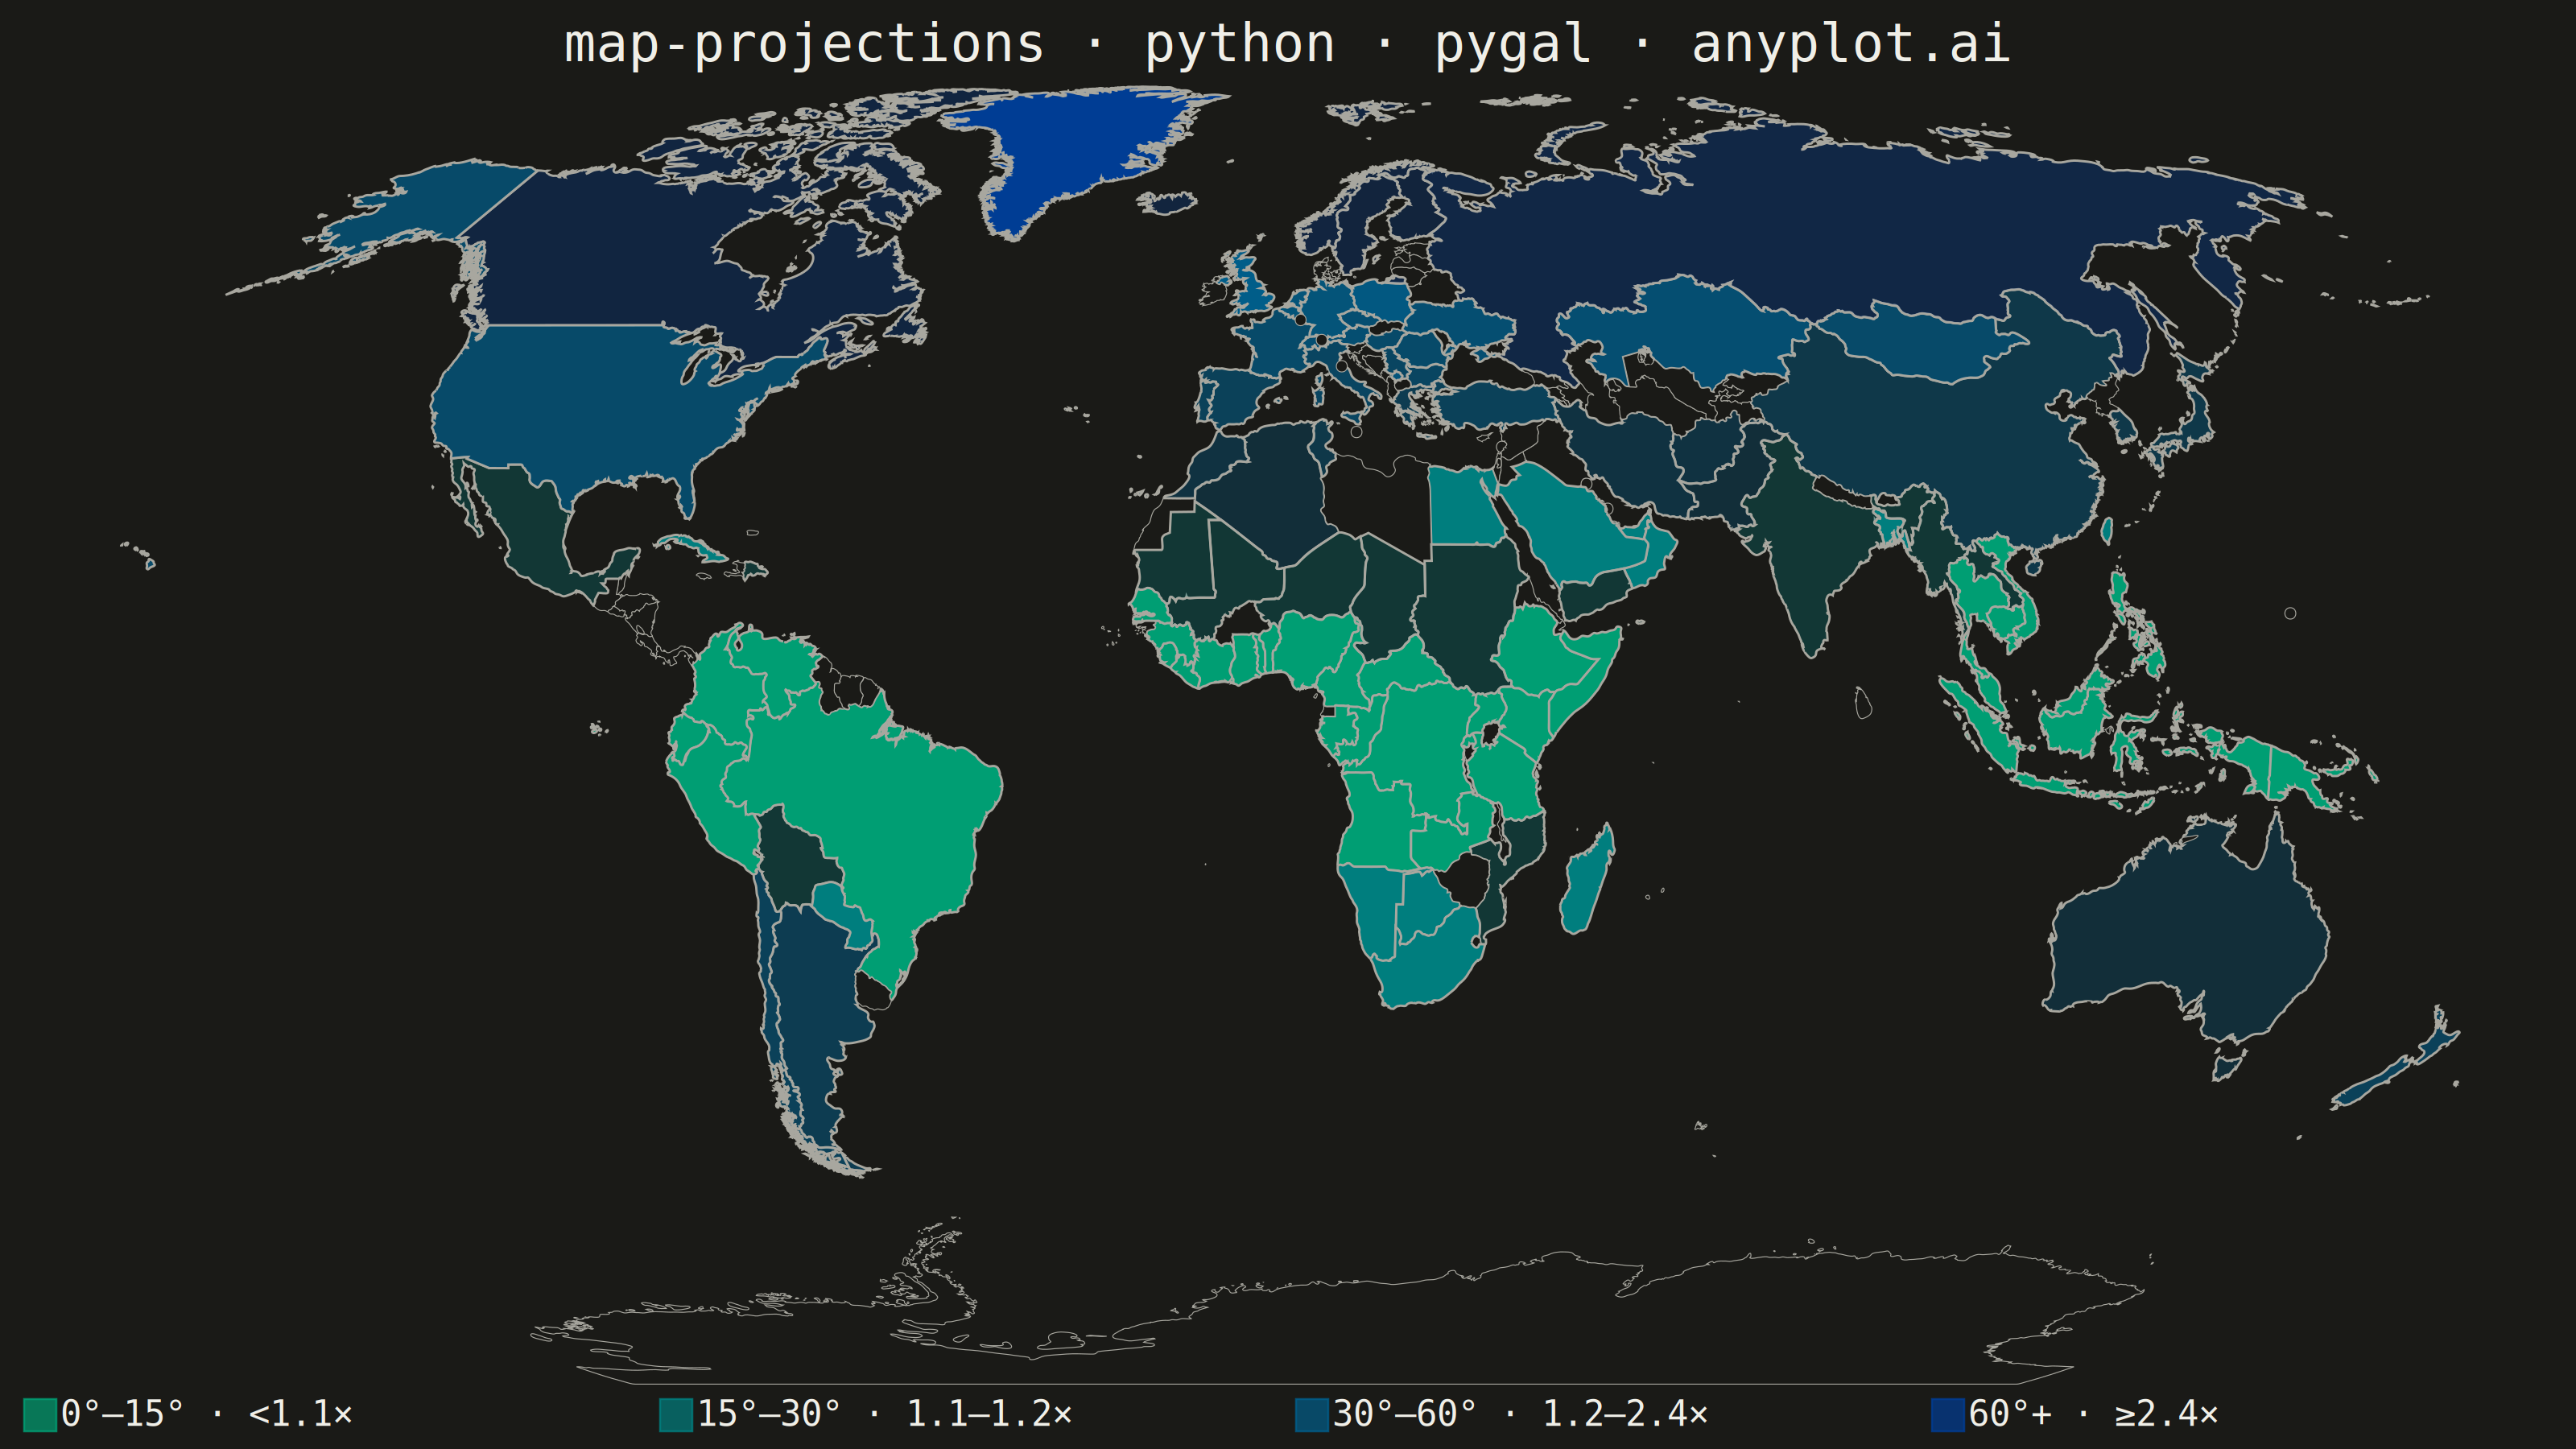
A world map demonstrating different cartographic projections and their distortion characteristics. This visualization showcases how the same geographic data appears under various map projections (Mercator, Robinson, Mollweide, Orthographic, etc.), revealing how each projection preserves or distorts area, shape, distance, or direction. The plot includes graticule (latitude/longitude grid lines) and optionally Tissot indicatrices to illustrate projection distortion patterns.
""" anyplot.ai
map-projections: World Map with Different Projections
Library: pygal 3.1.0 | Python 3.13.13
Quality: 83/100 | Updated: 2026-05-23
"""

import os
import sys


# Remove this script's own directory from sys.path so 'pygal.py' doesn't shadow
# the installed pygal package (a Python gotcha when the file shares a package name)
_here = os.path.dirname(os.path.abspath(__file__))
sys.path = [p for p in sys.path if os.path.abspath(p or ".") != _here]

from pygal.style import Style
from pygal_maps_world.maps import World


THEME = os.getenv("ANYPLOT_THEME", "light")
PAGE_BG = "#FAF8F1" if THEME == "light" else "#1A1A17"
INK = "#1A1A17" if THEME == "light" else "#F0EFE8"
INK_MUTED = "#6B6A63" if THEME == "light" else "#A8A79F"

# anyplot_seq (4 stops, brand green → dark azure): maps equatorial→polar distortion
ZONE_COLORS = ("#009E73", "#007E7E", "#005D89", "#003D94")

# Mercator distortion factor (≈ sec²φ, i.e. area exaggeration vs true size)
# 1.0 = accurate at equator; higher = more bloated toward the poles in Mercator
country_distortion = {
    # ---- Polar zone (≥2.4×): extreme Mercator distortion ----
    "gl": 14.3,  # Greenland ~72°N
    "ru": 3.5,  # Russia ~61°N
    "ca": 3.0,  # Canada ~60°N
    "no": 2.8,  # Norway ~65°N
    "is": 2.6,  # Iceland ~65°N
    "se": 2.5,  # Sweden ~60°N
    "fi": 2.4,  # Finland ~64°N
    # ---- Temperate zone (1.2–2.4×): significant distortion ----
    "gb": 2.3,  # United Kingdom ~54°N
    "pl": 2.2,  # Poland ~52°N
    "be": 2.1,  # Belgium ~51°N
    "nl": 2.1,  # Netherlands ~52°N
    "de": 2.1,  # Germany ~51°N
    "cz": 2.0,  # Czech Republic ~50°N
    "at": 2.0,  # Austria ~47°N
    "ch": 2.0,  # Switzerland ~47°N
    "ua": 2.0,  # Ukraine ~49°N
    "kz": 2.0,  # Kazakhstan ~48°N
    "hu": 1.9,  # Hungary ~47°N
    "ro": 1.9,  # Romania ~46°N
    "fr": 1.9,  # France ~46°N
    "us": 1.9,  # United States ~38°N
    "mn": 1.9,  # Mongolia ~46°N
    "it": 1.8,  # Italy ~42°N
    "rs": 1.8,  # Serbia ~44°N
    "bg": 1.8,  # Bulgaria ~43°N
    "cl": 1.7,  # Chile ~-36°S
    "nz": 1.7,  # New Zealand ~-42°S
    "es": 1.7,  # Spain ~40°N
    "pt": 1.7,  # Portugal ~39°N
    "tr": 1.7,  # Turkey ~39°N
    "ar": 1.6,  # Argentina ~-38°S
    "gr": 1.6,  # Greece ~39°N
    "kr": 1.5,  # South Korea ~37°N
    "jp": 1.5,  # Japan ~37°N
    "tn": 1.5,  # Tunisia ~34°N
    "cn": 1.5,  # China ~37°N
    "ir": 1.4,  # Iran ~32°N
    "af": 1.4,  # Afghanistan ~33°N
    "ma": 1.4,  # Morocco ~32°N
    "au": 1.3,  # Australia ~-27°S
    "pk": 1.3,  # Pakistan ~30°N
    "dz": 1.3,  # Algeria ~28°N
    # ---- Subtropical zone (1.1–1.2×): moderate distortion ----
    "eg": 1.15,  # Egypt ~26°N
    "sa": 1.15,  # Saudi Arabia ~24°N
    "ae": 1.15,  # UAE ~24°N
    "om": 1.15,  # Oman ~22°N
    "tw": 1.15,  # Taiwan ~24°N
    "bd": 1.15,  # Bangladesh ~24°N
    "cu": 1.15,  # Cuba ~22°N
    "py": 1.15,  # Paraguay ~-23°S
    "mg": 1.15,  # Madagascar ~-20°S
    "na": 1.15,  # Namibia ~-22°S
    "bw": 1.15,  # Botswana ~-22°S
    "za": 1.15,  # South Africa ~-29°S
    "mx": 1.1,  # Mexico ~23°N
    "in": 1.1,  # India ~21°N
    "mm": 1.1,  # Myanmar ~17°N
    "la": 1.1,  # Laos ~18°N
    "sd": 1.1,  # Sudan ~16°N
    "ne": 1.1,  # Niger ~17°N
    "ml": 1.1,  # Mali ~17°N
    "mr": 1.1,  # Mauritania ~20°N
    "td": 1.1,  # Chad ~15°N
    "ye": 1.1,  # Yemen ~16°N
    "mz": 1.1,  # Mozambique ~-18°S
    "bo": 1.1,  # Bolivia ~-17°S
    "do": 1.1,  # Dominican Rep. ~19°N
    # ---- Equatorial zone (<1.1×): minimal distortion ----
    "br": 1.0,  # Brazil
    "co": 1.0,  # Colombia
    "ve": 1.0,  # Venezuela
    "pe": 1.0,  # Peru
    "ec": 1.0,  # Ecuador
    "ng": 1.0,  # Nigeria
    "cd": 1.0,  # DR Congo
    "ao": 1.0,  # Angola
    "cm": 1.0,  # Cameroon
    "cg": 1.0,  # Rep. of Congo
    "ga": 1.0,  # Gabon
    "cf": 1.0,  # Central African Rep.
    "et": 1.0,  # Ethiopia
    "ke": 1.0,  # Kenya
    "tz": 1.0,  # Tanzania
    "ug": 1.0,  # Uganda
    "ss": 1.0,  # South Sudan
    "so": 1.0,  # Somalia
    "rw": 1.0,  # Rwanda
    "zm": 1.0,  # Zambia
    "gh": 1.0,  # Ghana
    "ci": 1.0,  # Côte d'Ivoire
    "sn": 1.0,  # Senegal
    "gn": 1.0,  # Guinea
    "sl": 1.0,  # Sierra Leone
    "lr": 1.0,  # Liberia
    "tg": 1.0,  # Togo
    "bj": 1.0,  # Benin
    "id": 1.0,  # Indonesia
    "my": 1.0,  # Malaysia
    "ph": 1.0,  # Philippines
    "th": 1.0,  # Thailand
    "vn": 1.0,  # Vietnam
    "kh": 1.0,  # Cambodia
    "pg": 1.0,  # Papua New Guinea
}

equatorial_zone = {k: v for k, v in country_distortion.items() if v < 1.1}
subtropical_zone = {k: v for k, v in country_distortion.items() if 1.1 <= v < 1.2}
temperate_zone = {k: v for k, v in country_distortion.items() if 1.2 <= v < 2.4}
polar_zone = {k: v for k, v in country_distortion.items() if v >= 2.4}

custom_style = Style(
    background=PAGE_BG,
    plot_background=PAGE_BG,
    foreground=INK,
    foreground_strong=INK,
    foreground_subtle=INK_MUTED,
    colors=ZONE_COLORS,
    title_font_size=66,
    label_font_size=56,
    major_label_font_size=44,
    legend_font_size=44,
    value_font_size=36,
    stroke_width=2.5,
)

worldmap = World(
    style=custom_style,
    width=3200,
    height=1800,
    title="map-projections · python · pygal · anyplot.ai",
    show_legend=True,
    legend_at_bottom=True,
    legend_at_bottom_columns=4,
    legend_box_size=40,
    print_values=False,
    print_labels=False,
)

# Zones ordered equatorial→polar so ZONE_COLORS maps low→high distortion
# Labels shortened to prevent truncation in pygal's SVG renderer
worldmap.add("0°–15° · <1.1×", equatorial_zone)
worldmap.add("15°–30° · 1.1–1.2×", subtropical_zone)
worldmap.add("30°–60° · 1.2–2.4×", temperate_zone)
worldmap.add("60°+ · ≥2.4×", polar_zone)

worldmap.render_to_png(f"plot-{THEME}.png")
with open(f"plot-{THEME}.html", "wb") as f:
    f.write(worldmap.render())
Runnable source as JSON, for any HTTP client: https://api.anyplot.ai/specs/map-projections/pygal/code. Any spec id and library id listed in llms-full.txt fit the same URL shape; every URL below is complete and callable.
{
  "spec_id": "map-projections",
  "language": "python",
  "library": "pygal",
  "page": "https://anyplot.ai/map-projections/python/pygal",
  "hub": "https://anyplot.ai/map-projections",
  "code_json": "https://api.anyplot.ai/specs/map-projections/pygal/code",
  "spec_json": "https://api.anyplot.ai/specs/map-projections",
  "render_light_png": "https://storage.googleapis.com/anyplot-images/plots/map-projections/python/pygal/plot-light.png",
  "render_dark_png": "https://storage.googleapis.com/anyplot-images/plots/map-projections/python/pygal/plot-dark.png",
  "interactive_light_html": "https://storage.googleapis.com/anyplot-images/plots/map-projections/python/pygal/plot-light.html",
  "interactive_dark_html": "https://storage.googleapis.com/anyplot-images/plots/map-projections/python/pygal/plot-dark.html",
  "quality_score": 83.0,
  "license": "MIT",
  "guide": "https://anyplot.ai/llms.txt"
}
Part of World Map with Different Projections on anyplot.ai.