The same plot in 14 other libraries — JavaScript: Chart.js, Apache ECharts, Highcharts, MUI X Charts; Python: Altair, Bokeh, lets-plot, Matplotlib, Plotly, plotnine, Pygal, Seaborn; R: ggplot2; Julia: Makie.jl. Compare all 15 side by side: World Map with Different Projections in Python, R, Julia and JavaScript.
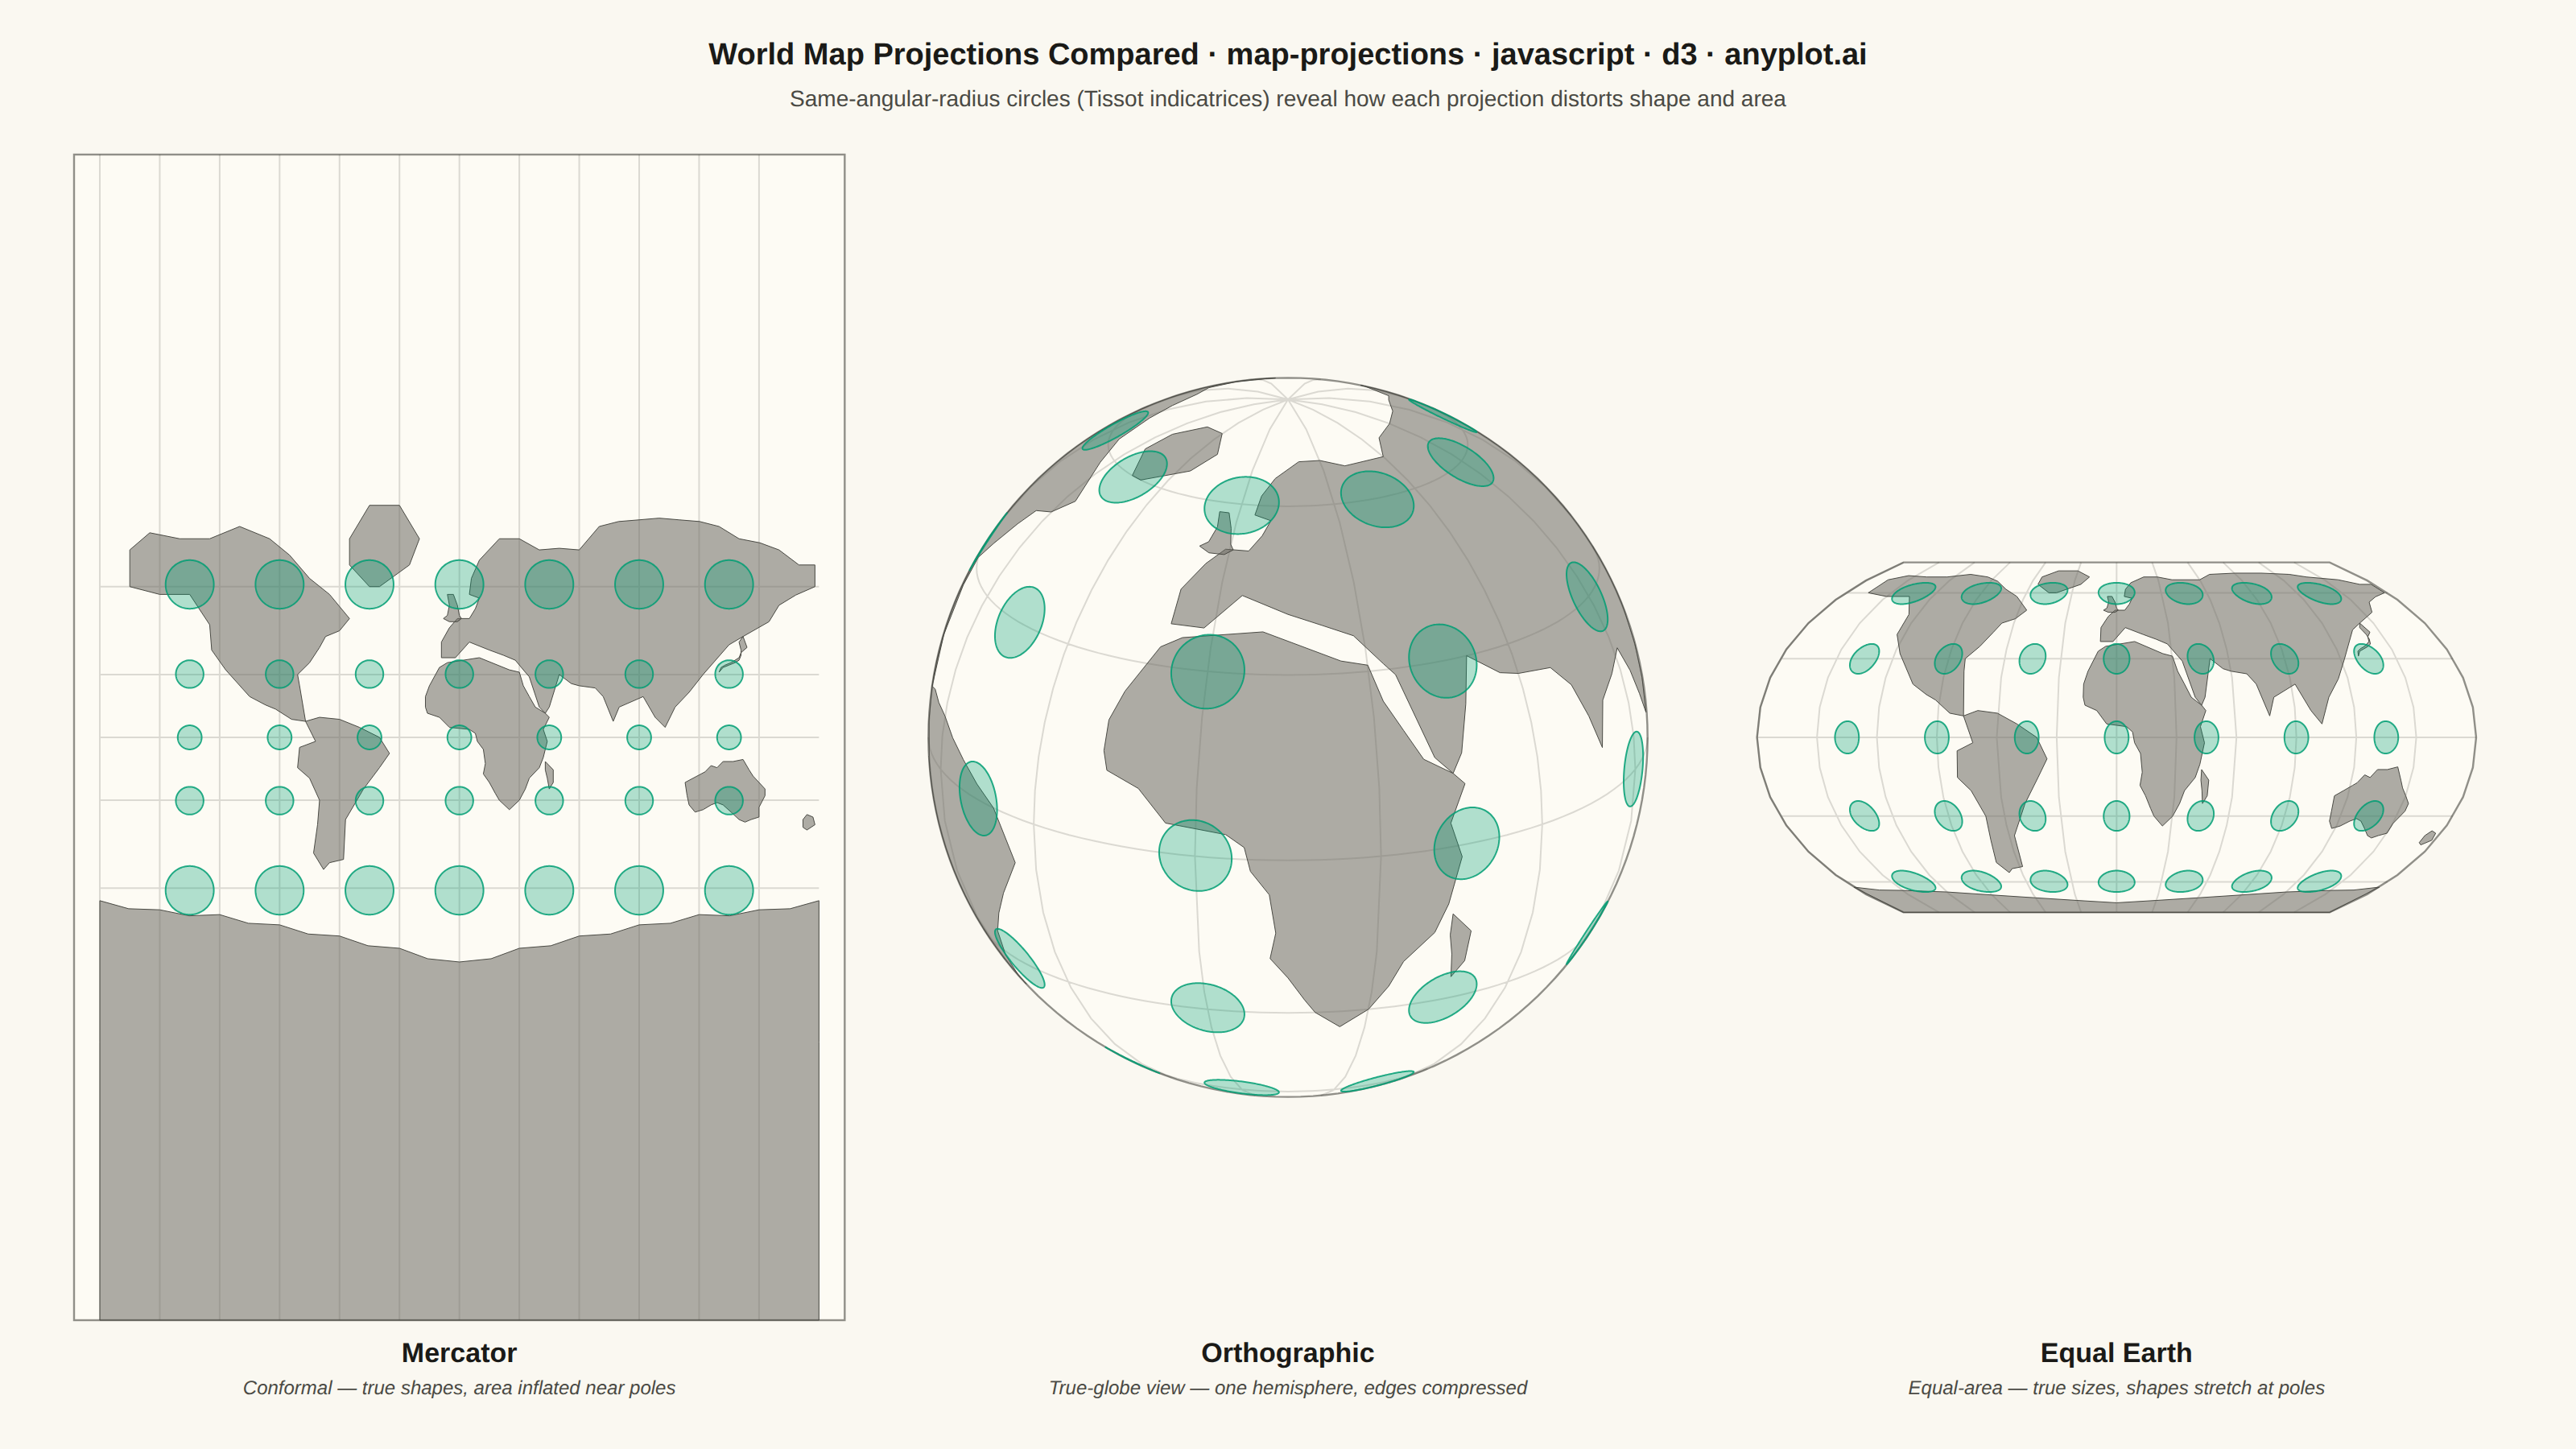
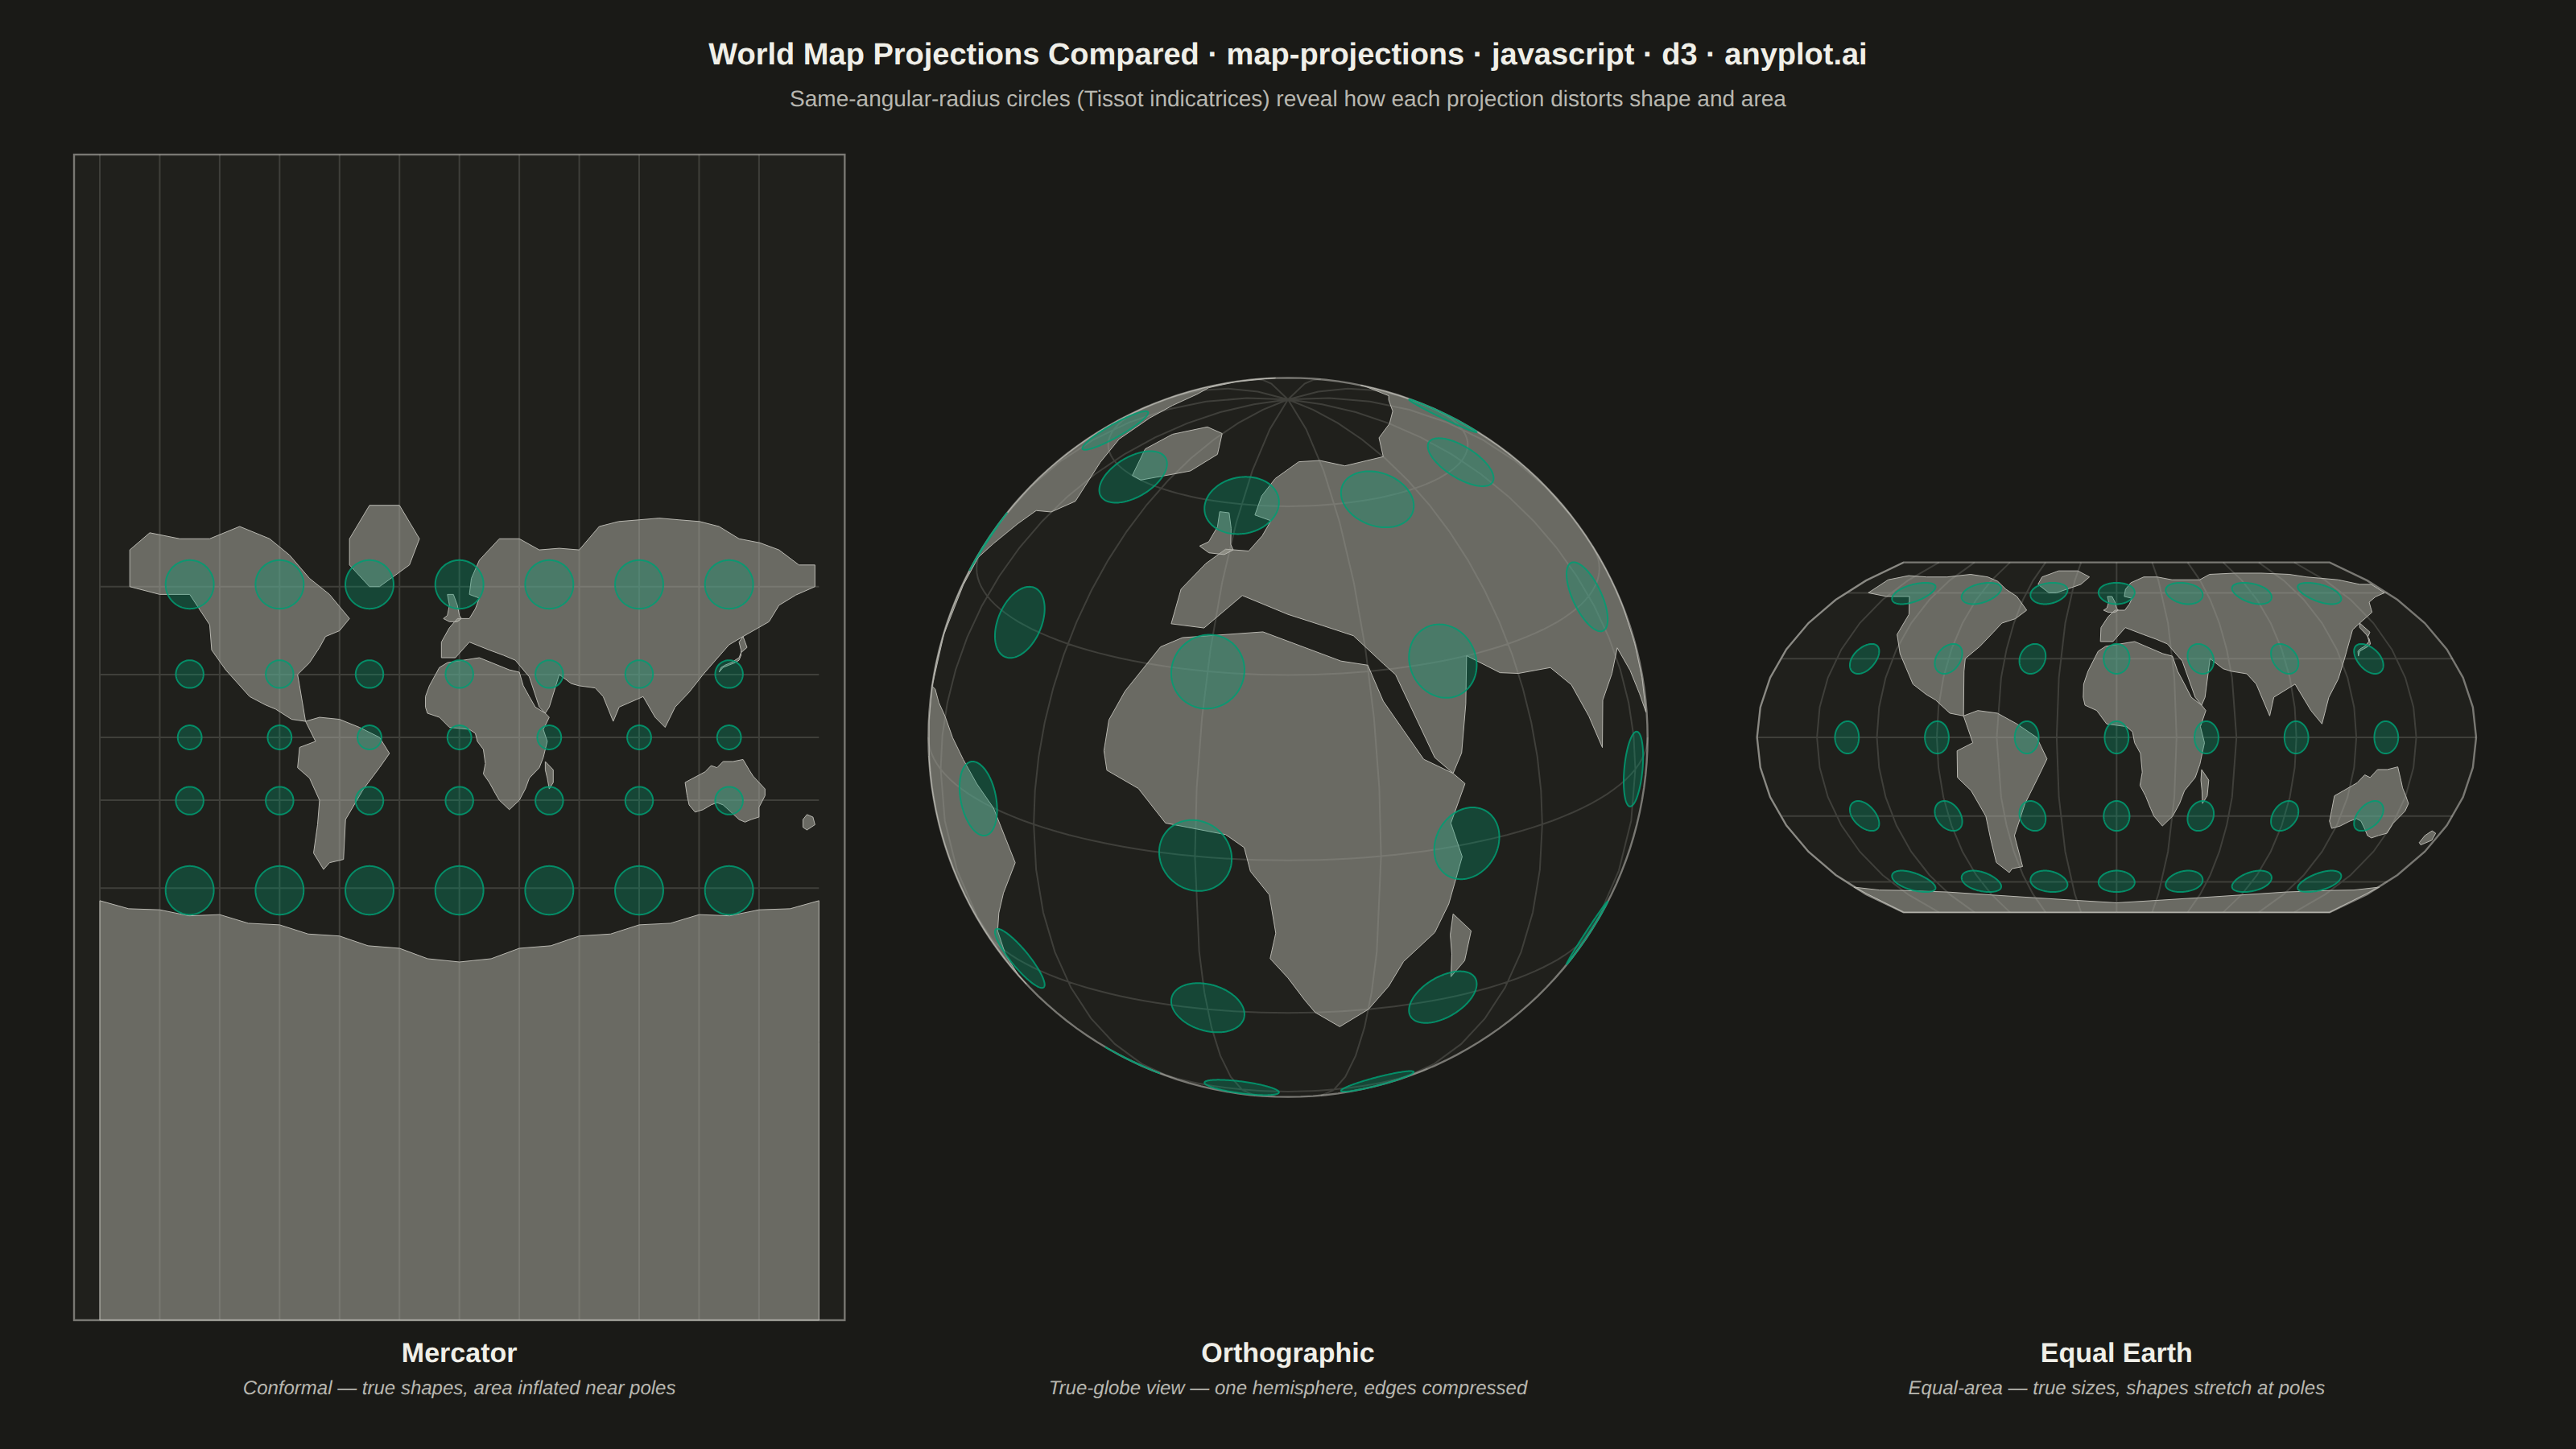
A world map demonstrating different cartographic projections and their distortion characteristics. This visualization showcases how the same geographic data appears under various map projections (Mercator, Robinson, Mollweide, Orthographic, etc.), revealing how each projection preserves or distorts area, shape, distance, or direction. The plot includes graticule (latitude/longitude grid lines) and optionally Tissot indicatrices to illustrate projection distortion patterns.
// anyplot.ai
// map-projections: World Map with Different Projections
// Library: d3 7.9.0 | JavaScript 22.23.2
// Quality: 88/100 | Created: 2026-08-26

const t = window.ANYPLOT_TOKENS;
const { width, height } = window.ANYPLOT_SIZE;
const THEME = window.ANYPLOT_THEME;
const BRAND = t.palette[0];
const MUTED = THEME === "dark" ? "#A8A79F" : "#6B6A63";

// --- Simplified world landmasses (hand-simplified coastlines, lon/lat rings) ---
// d3-geo always clips against the antimeridian, which depends on the right-hand
// winding rule — normalize each hand-authored ring via its signed geoArea rather
// than trust hand-derived orientation (a flipped ring fills "everything but the
// shape", ~4π−area, instead of the shape itself).
const poly = (ring) => {
  const f = { type: "Feature", geometry: { type: "Polygon", coordinates: [ring] } };
  return d3.geoArea(f) > 2 * Math.PI
    ? { type: "Feature", geometry: { type: "Polygon", coordinates: [ring.slice().reverse()] } }
    : f;
};

const NORTH_AMERICA = [
  [-165, 68], [-165, 60], [-150, 58], [-135, 58], [-125, 49], [-124, 40],
  [-117, 32], [-105, 20], [-97, 16], [-92, 14], [-84, 9], [-77, 8],
  [-80, 25], [-81, 30], [-75, 35], [-70, 41], [-67, 45], [-60, 47],
  [-55, 51], [-65, 58], [-75, 62], [-85, 67], [-95, 70], [-110, 72],
  [-125, 70], [-140, 70], [-155, 71], [-165, 68],
];

const SOUTH_AMERICA = [
  [-77, 8], [-72, -2], [-80, -5], [-81, -15], [-75, -20], [-70, -30],
  [-71, -40], [-73, -50], [-68, -55], [-65, -53], [-58, -52], [-57, -38],
  [-48, -25], [-40, -15], [-35, -8], [-40, 0], [-50, 5], [-60, 9],
  [-70, 10], [-77, 8],
];

const GREENLAND = [
  [-45, 60], [-55, 65], [-55, 70], [-45, 75], [-30, 75], [-20, 70],
  [-25, 65], [-40, 60], [-45, 60],
];

const EURASIA = [
  [-9, 43], [-5, 48], [-1, 51], [5, 51], [8, 54], [10, 57], [5, 58],
  [6, 62], [10, 66], [20, 70], [30, 70], [40, 68], [60, 68], [70, 72],
  [90, 73], [110, 73], [130, 72], [140, 70], [160, 68], [170, 65],
  [178, 65], [178, 60], [160, 55], [155, 50], [142, 45], [135, 42],
  [122, 30], [115, 22], [108, 15], [103, 5], [98, 10], [92, 20],
  [80, 15], [77, 8], [72, 20], [68, 24], [60, 25], [56, 26], [50, 30],
  [45, 15], [43, 12], [40, 15], [35, 29], [33, 31], [28, 36], [22, 38],
  [15, 40], [5, 43], [-2, 37], [-9, 37], [-9, 43],
];

const AFRICA = [
  [-17, 15], [-16, 12], [-10, 10], [-5, 5], [5, 4], [8, 2], [9, -2],
  [12, -6], [13, -13], [12, -18], [15, -22], [18, -27], [20, -30],
  [25, -34], [30, -30], [33, -25], [35, -20], [40, -15], [42, -10],
  [44, -2], [42, 4], [45, 10], [43, 12], [38, 15], [35, 20], [32, 25],
  [30, 31], [25, 32], [10, 37], [-6, 35], [-10, 33], [-15, 25],
  [-17, 20], [-17, 15],
];

const MADAGASCAR = [[43, -12], [47, -16], [47, -22], [45, -25], [44, -20], [43, -16], [43, -12]];

const AUSTRALIA = [
  [113, -22], [114, -28], [115, -32], [118, -35], [122, -34], [126, -32],
  [129, -31], [132, -32], [136, -35], [140, -38], [143, -39], [146, -38],
  [150, -37], [150, -33], [153, -28], [153, -25], [150, -22], [147, -19],
  [145, -16], [142, -11], [137, -12], [132, -12], [129, -15], [126, -14],
  [123, -17], [121, -18], [117, -20], [113, -22],
];

const NEW_ZEALAND = [[172, -41], [174, -42], [178, -40], [177, -37], [174, -36], [172, -38], [172, -41]];

const JAPAN = [
  [130, 31], [132, 33], [135, 34], [138, 35], [140, 36], [141, 38],
  [141, 40], [140, 43], [142, 45], [144, 41], [141, 39], [140, 37],
  [136, 35], [133, 34], [131, 33], [130, 31],
];

const BRITISH_ISLES = [[-8, 51], [-6, 52], [-5, 55], [-6, 58], [-3, 58], [-1, 55], [0, 52], [1, 51], [-1, 50], [-5, 50], [-8, 51]];

const ANTARCTICA = [
  [-180, -63], [-150, -65], [-120, -66], [-90, -68], [-60, -70], [-30, -72],
  [0, -74], [30, -72], [60, -70], [90, -68], [120, -66], [150, -65],
  [180, -63], [180, -90], [-180, -90], [-180, -63],
];

// Mercator has no pole-aware clipping (unlike .clipAngle() on Orthographic), so a
// ring enclosing the south-pole singularity renders inverted once .clipExtent()
// clips it to a finite rectangle. Clamp Antarctica's southern edge to the same
// latitude as mercatorBounds (-82) for the Mercator panel so the ring never spans
// the pole there.
const ANTARCTICA_MERCATOR = [
  [-180, -63], [-150, -65], [-120, -66], [-90, -68], [-60, -70], [-30, -72],
  [0, -74], [30, -72], [60, -70], [90, -68], [120, -66], [150, -65],
  [180, -63], [180, -82], [-180, -82], [-180, -63],
];

const baseLandRings = [
  NORTH_AMERICA, SOUTH_AMERICA, GREENLAND, EURASIA, AFRICA, MADAGASCAR,
  AUSTRALIA, NEW_ZEALAND, JAPAN, BRITISH_ISLES,
];

const landFeatures = [...baseLandRings, ANTARCTICA].map(poly);
const landFeaturesMercator = [...baseLandRings, ANTARCTICA_MERCATOR].map(poly);

// --- Graticule + Tissot indicatrices (equal angular-radius circles, reveal distortion) ---
const graticule = d3.geoGraticule().step([30, 30]);

const tissotLons = [-135, -90, -45, 0, 45, 90, 135];
const tissotLats = [-60, -30, 0, 30, 60];
const tissotCenters = tissotLons.flatMap((lon) => tissotLats.map((lat) => [lon, lat]));
const tissotFeatures = tissotCenters.map(([lon, lat]) => d3.geoCircle().center([lon, lat]).radius(6)());

const mercatorBounds = { type: "Polygon", coordinates: [[[-180, -82], [180, -82], [180, 82], [-180, 82], [-180, -82]]] };

// --- Panel layout: three projections side by side ---
const panels = [
  {
    key: "mercator", name: "Mercator",
    note: "Conformal — true shapes, area inflated near poles",
    make: () => d3.geoMercator(),
  },
  {
    key: "orthographic", name: "Orthographic",
    note: "True-globe view — one hemisphere, edges compressed",
    make: () => d3.geoOrthographic().clipAngle(90).rotate([-15, -20, 0]),
  },
  {
    key: "equalearth", name: "Equal Earth",
    note: "Equal-area — true sizes, shapes stretch at poles",
    make: () => d3.geoEqualEarth(),
  },
];

const marginTop = 96;
const captionH = 62;
const bottomPad = 18;
const outerX = 46;
const gap = 36;
const panelAreaTop = marginTop;
const panelAreaBottom = height - captionH - bottomPad;
const panelW = (width - 2 * outerX - 2 * gap) / 3;

const svg = d3.select("#container").append("svg").attr("width", width).attr("height", height);

panels.forEach((p, i) => {
  const x0 = outerX + i * (panelW + gap);
  const x1 = x0 + panelW;
  const box = [[x0 + 16, panelAreaTop + 16], [x1 - 16, panelAreaBottom - 16]];

  const projection = p.make();
  let path;
  if (p.key === "mercator") {
    projection.fitExtent(box, mercatorBounds);
    projection.clipExtent([[x0, panelAreaTop], [x1, panelAreaBottom]]);
    path = d3.geoPath(projection);
  } else {
    projection.fitExtent(box, { type: "Sphere" });
    path = d3.geoPath(projection);
  }

  const g = svg.append("g").attr("class", `panel-${p.key}`);

  // Panel background / outline
  if (p.key === "mercator") {
    g.append("rect")
      .attr("x", x0).attr("y", panelAreaTop)
      .attr("width", panelW).attr("height", panelAreaBottom - panelAreaTop)
      .attr("fill", t.elevatedBg).attr("stroke", t.inkSoft)
      .attr("stroke-width", 1.2).attr("opacity", 0.6);
  } else {
    g.append("path").datum({ type: "Sphere" }).attr("d", path)
      .attr("fill", t.elevatedBg).attr("stroke", t.inkSoft)
      .attr("stroke-width", 1.2).attr("opacity", 0.6);
  }

  // Graticule (30° lat/lon grid)
  g.append("path").datum(graticule()).attr("d", path)
    .attr("fill", "none").attr("stroke", t.grid).attr("stroke-width", 1);

  // Landmasses (neutral fill — not a data-driven color)
  const landData = p.key === "mercator" ? landFeaturesMercator : landFeatures;
  g.selectAll("path.land").data(landData).join("path")
    .attr("class", "land").attr("d", path)
    .attr("fill", MUTED).attr("fill-opacity", 0.55)
    .attr("stroke", t.inkSoft).attr("stroke-width", 0.5);

  // Tissot indicatrices — equal angular radius on the globe, distortion is visible
  // as they become unequal ellipses under each projection
  g.selectAll("path.tissot").data(tissotFeatures).join("path")
    .attr("class", "tissot").attr("d", path)
    .attr("fill", BRAND).attr("fill-opacity", 0.3)
    .attr("stroke", BRAND).attr("stroke-width", 1).attr("stroke-opacity", 0.85);

  // Panel caption
  const cx = (x0 + x1) / 2;
  g.append("text")
    .attr("x", cx).attr("y", panelAreaBottom + 26).attr("text-anchor", "middle")
    .attr("fill", t.ink).style("font-size", "17px").style("font-weight", "700")
    .text(p.name);
  g.append("text")
    .attr("x", cx).attr("y", panelAreaBottom + 46).attr("text-anchor", "middle")
    .attr("fill", t.inkSoft).style("font-size", "12px").style("font-style", "italic")
    .text(p.note);
});

// Title (scaled for length) + subtitle
const titleStr = "World Map Projections Compared · map-projections · javascript · d3 · anyplot.ai";
const titleSize = Math.max(14, Math.round(22 * Math.min(1, 67 / titleStr.length)));

svg.append("text")
  .attr("x", width / 2).attr("y", 40).attr("text-anchor", "middle")
  .attr("fill", t.ink).style("font-size", `${titleSize}px`).style("font-weight", "600")
  .text(titleStr);

svg.append("text")
  .attr("x", width / 2).attr("y", 66).attr("text-anchor", "middle")
  .attr("fill", t.inkSoft).style("font-size", "14px")
  .text("Same-angular-radius circles (Tissot indicatrices) reveal how each projection distorts shape and area");
Runnable source as JSON, for any HTTP client: https://api.anyplot.ai/specs/map-projections/d3/code. Any spec id and library id listed in llms-full.txt fit the same URL shape; every URL below is complete and callable.
{
  "spec_id": "map-projections",
  "language": "javascript",
  "library": "d3",
  "page": "https://anyplot.ai/map-projections/javascript/d3",
  "hub": "https://anyplot.ai/map-projections",
  "code_json": "https://api.anyplot.ai/specs/map-projections/d3/code",
  "spec_json": "https://api.anyplot.ai/specs/map-projections",
  "render_light_png": "https://storage.googleapis.com/anyplot-images/plots/map-projections/javascript/d3/plot-light.png",
  "render_dark_png": "https://storage.googleapis.com/anyplot-images/plots/map-projections/javascript/d3/plot-dark.png",
  "interactive_light_html": "https://storage.googleapis.com/anyplot-images/plots/map-projections/javascript/d3/plot-light.html",
  "interactive_dark_html": "https://storage.googleapis.com/anyplot-images/plots/map-projections/javascript/d3/plot-dark.html",
  "quality_score": 88.0,
  "license": "MIT",
  "guide": "https://anyplot.ai/llms.txt"
}
Part of World Map with Different Projections on anyplot.ai.