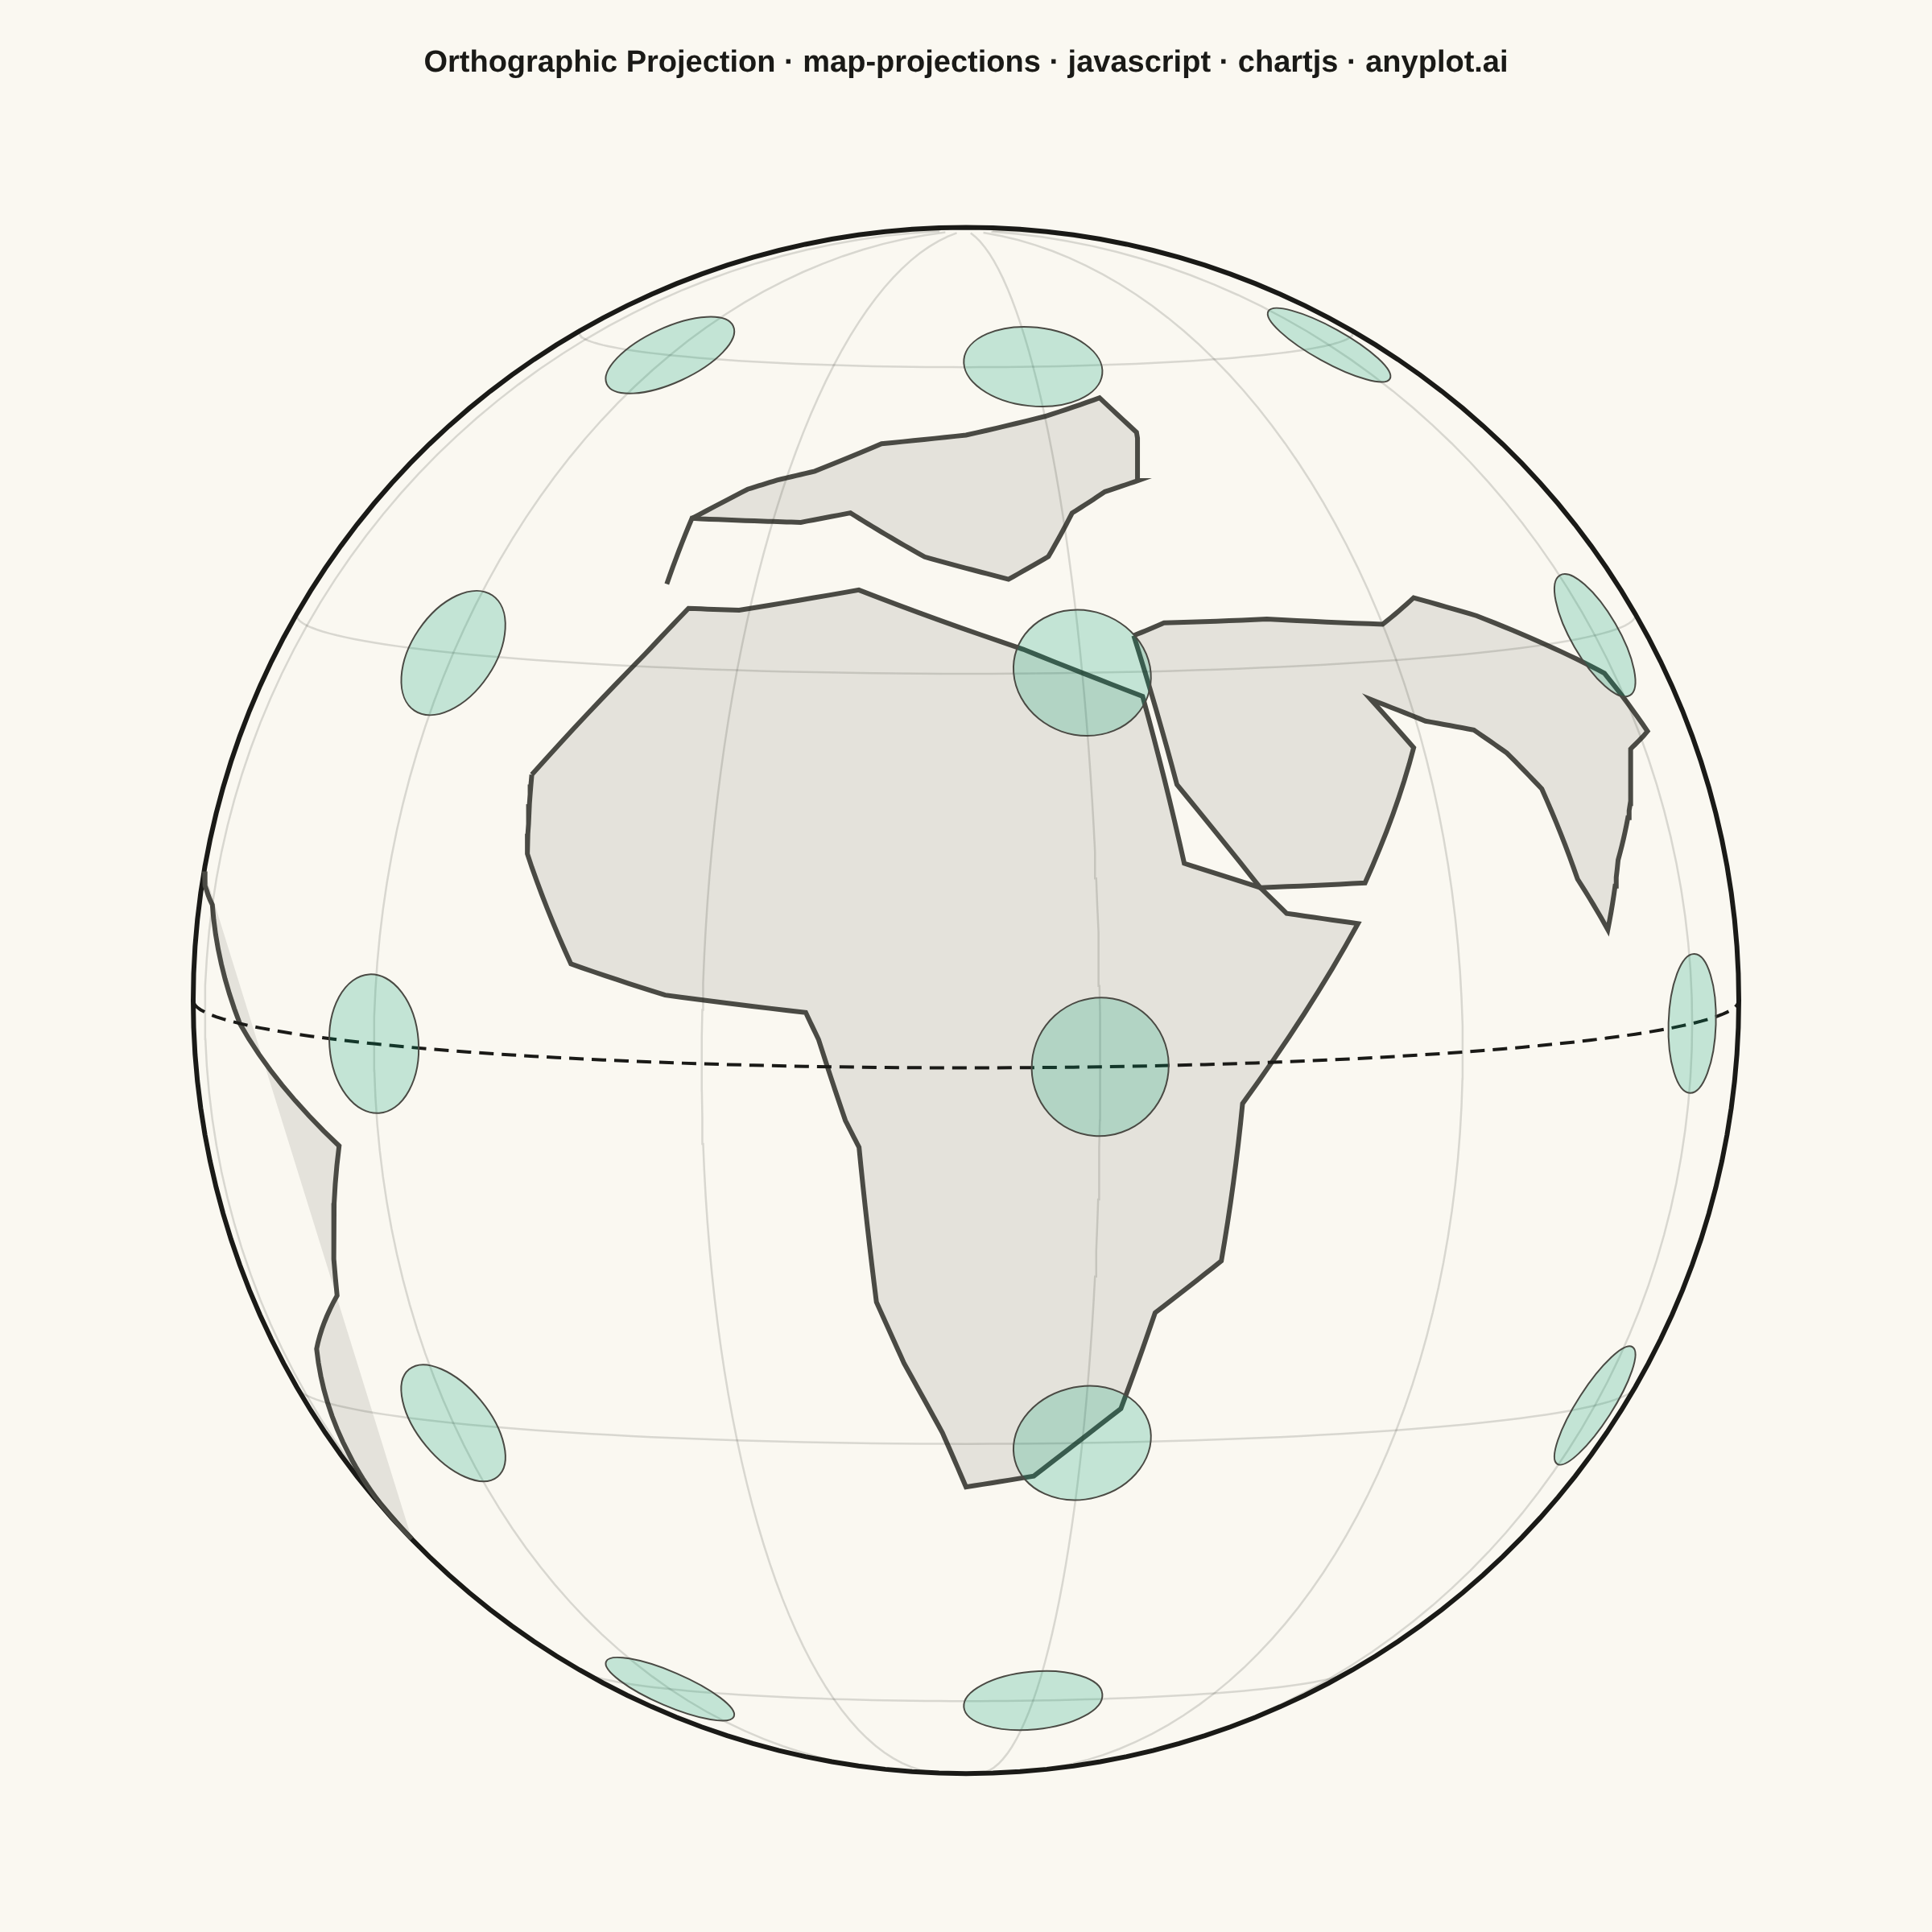
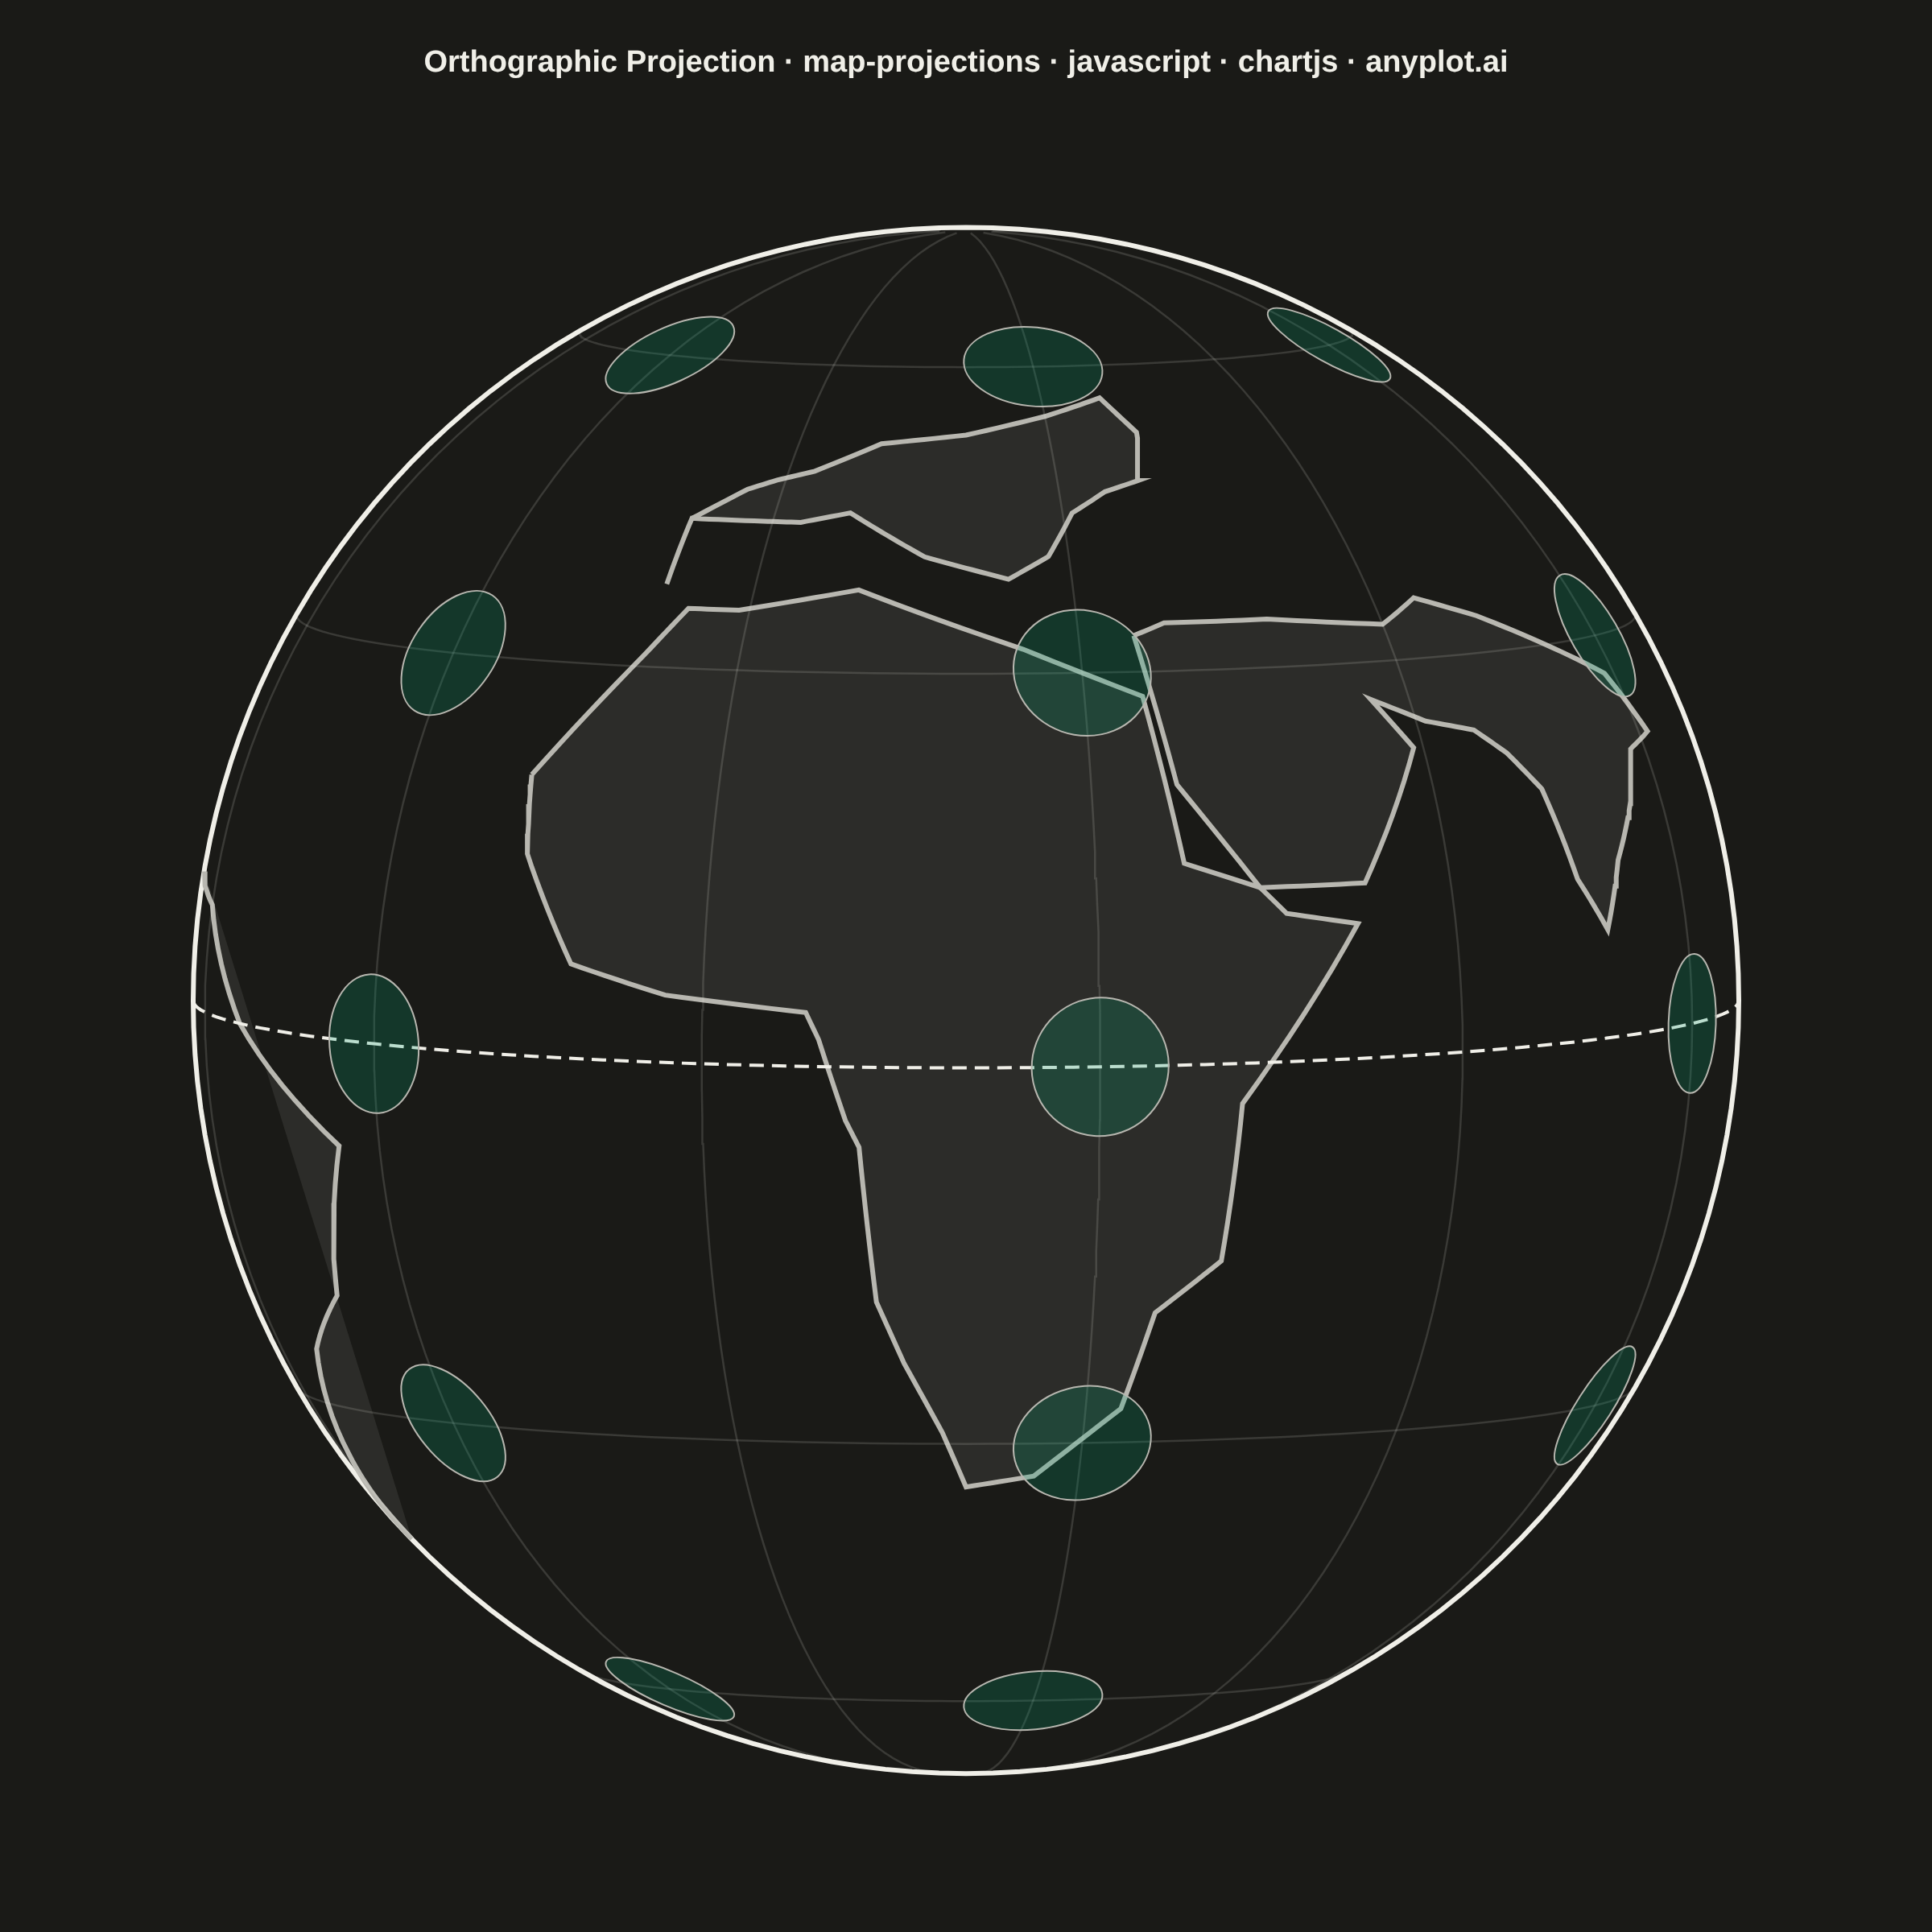
The same plot in 14 other libraries — JavaScript: D3.js, Apache ECharts, Highcharts, MUI X Charts; Python: Altair, Bokeh, lets-plot, Matplotlib, Plotly, plotnine, Pygal, Seaborn; R: ggplot2; Julia: Makie.jl. Compare all 15 side by side: World Map with Different Projections in Python, R, Julia and JavaScript.
A world map demonstrating different cartographic projections and their distortion characteristics. This visualization showcases how the same geographic data appears under various map projections (Mercator, Robinson, Mollweide, Orthographic, etc.), revealing how each projection preserves or distorts area, shape, distance, or direction. The plot includes graticule (latitude/longitude grid lines) and optionally Tissot indicatrices to illustrate projection distortion patterns.
// anyplot.ai
// map-projections: World Map with Different Projections
// Library: chartjs 4.4.7 | JavaScript 22.23.2
// Quality: 87/100 | Created: 2026-08-26
//# anyplot-orientation: square

const t = window.ANYPLOT_TOKENS;

// --- Orthographic projection, centered on Africa/Europe so the horizon
// naturally clips the far side of the globe. --------------------------------
const LON0 = 20; // degrees E, view center
const LAT0 = 5; // degrees N, view center
const LAMBDA0 = (LON0 * Math.PI) / 180;
const PHI0 = (LAT0 * Math.PI) / 180;

function project(lonDeg, latDeg) {
  const lon = (lonDeg * Math.PI) / 180;
  const lat = (latDeg * Math.PI) / 180;
  const cosC = Math.sin(PHI0) * Math.sin(lat) + Math.cos(PHI0) * Math.cos(lat) * Math.cos(lon - LAMBDA0);
  if (cosC <= 0.02) return null; // past the horizon — far side of the globe
  return {
    x: Math.cos(lat) * Math.sin(lon - LAMBDA0),
    y: Math.cos(PHI0) * Math.sin(lat) - Math.sin(PHI0) * Math.cos(lat) * Math.cos(lon - LAMBDA0),
    cosC,
  };
}

// Densify a lon/lat polyline before projecting so the horizon clip reads as a
// smooth curve instead of jumping straight between the last two raw vertices.
function densify(points, steps) {
  const out = [];
  for (let i = 0; i < points.length - 1; i++) {
    const [lon0, lat0] = points[i];
    const [lon1, lat1] = points[i + 1];
    for (let s = 0; s < steps; s++) {
      const f = s / steps;
      out.push([lon0 + (lon1 - lon0) * f, lat0 + (lat1 - lat0) * f]);
    }
  }
  out.push(points[points.length - 1]);
  return out;
}

function projectLine(lonLatPairs) {
  return lonLatPairs.map(([lon, lat]) => {
    const p = project(lon, lat);
    return p ? { x: p.x, y: p.y } : { x: null, y: null };
  });
}

function hexToRgba(hex, alpha) {
  const n = parseInt(hex.slice(1), 16);
  return `rgba(${(n >> 16) & 255}, ${(n >> 8) & 255}, ${n & 255}, ${alpha})`;
}

// --- Graticule: meridians every 30°, parallels every 30° --------------------
const graticuleLines = [];
for (let lon = -180; lon < 180; lon += 30) {
  const pts = [];
  for (let lat = -88; lat <= 88; lat += 2) pts.push([lon, lat]);
  graticuleLines.push(projectLine(pts));
}
for (const lat of [-60, -30, 30, 60]) {
  const pts = [];
  for (let lon = -180; lon <= 180; lon += 2) pts.push([lon, lat]);
  graticuleLines.push(projectLine(pts));
}
const equatorPts = [];
for (let lon = -180; lon <= 180; lon += 2) equatorPts.push([lon, 0]);
const equator = projectLine(equatorPts);

// --- Globe outline: the horizon circle (edge of the visible hemisphere) ----
const globeOutline = [];
for (let a = 0; a <= 360; a += 2) {
  const rad = (a * Math.PI) / 180;
  globeOutline.push({ x: Math.cos(rad), y: Math.sin(rad) });
}

// --- Simplified continent coastlines (illustrative, not navigational) ------
const AFRICA = [
  [-17, 21], [-16, 15], [-11, 7], [-3, 5], [8, 4], [9, 2], [11, -4], [12, -6], [13, -18],
  [15, -23], [18, -29], [20, -34], [26, -33], [33, -27], [35, -19], [40, -15], [41, -3],
  [51, 10], [45, 11], [43, 13], [37, 15], [35, 28], [25, 32], [10, 37], [-1, 35], [-6, 35],
  [-9, 31], [-17, 21],
];
const EUROPE = [
  [-9, 37], [-9, 43], [-1, 43], [3, 43], [8, 44], [12, 42], [16, 40], [20, 39], [24, 38],
  [28, 40], [31, 44], [35, 46], [39, 47], [41, 52], [38, 56], [30, 54], [20, 52], [10, 51],
  [3, 48], [-1, 47], [-4, 46], [-9, 43],
];
const SOUTH_AMERICA = [
  [-77, 8], [-70, 10], [-60, 8], [-50, 0], [-35, -8], [-40, -20], [-48, -25], [-57, -35],
  [-62, -40], [-65, -50], [-68, -55], [-72, -52], [-73, -42], [-71, -30], [-70, -18],
  [-81, -5], [-80, 2], [-77, 8],
];
// Middle East + Indian subcontinent — the largest landmass still missing from
// this exact viewing hemisphere (centered 20E/5N puts the Arabian Peninsula
// and India well inside the ~90-degree horizon).
const MIDEAST_INDIA = [
  [35, 33], [37, 21], [43, 13], [52, 13], [59, 23], [56, 27], [61, 25], [66, 24],
  [69, 22], [72, 19], [74, 12], [77, 8], [80, 13], [84, 17], [87, 21], [92, 22],
  [88, 27], [80, 30], [72, 33], [65, 35], [60, 33], [48, 34], [38, 34], [35, 33],
];

// Only continent-level silhouettes are modeled (no country borders) since
// Chart.js ships no geo/GeoJSON plugin — see prompts/library/chartjs.md.
const continents = [AFRICA, EUROPE, SOUTH_AMERICA, MIDEAST_INDIA].map((ring) => projectLine(densify(ring, 8)));

// --- Tissot indicatrices: equal small circles on the globe rendered as
// ellipses in the plane, showing exactly how orthographic distorts shape and
// area as points move away from the sub-view point (h = cos c radially,
// k = 1 tangentially — Snyder's orthographic scale factors). -----------------
const TISSOT_LATS = [-60, -30, 0, 30, 60];
const TISSOT_LONS = [-150, -90, -30, 30, 90, 150];
const TISSOT_ANGULAR_RADIUS = 0.09; // exaggerated for visibility, standard Tissot practice
const tissotPoints = [];
for (const lat of TISSOT_LATS) {
  for (const lon of TISSOT_LONS) {
    const p = project(lon, lat);
    if (p && p.cosC > 0.2) tissotPoints.push(p);
  }
}

// --- Mount -------------------------------------------------------------------
const canvas = document.createElement("canvas");
document.getElementById("container").appendChild(canvas);

// --- Custom plugin: fill land polygons with a neutral tone before any dataset
// (graticule/coastline/globe) draws on top, so land reads distinctly from
// ocean instead of relying on the coastline outline alone. -------------------
const landPlugin = {
  id: "landFill",
  beforeDatasetsDraw(chart) {
    const { ctx, scales } = chart;
    ctx.save();
    ctx.fillStyle = hexToRgba(t.inkSoft, 0.12);
    for (const ring of continents) {
      const pts = ring.filter((p) => p.x !== null && p.y !== null);
      if (pts.length < 3) continue;
      ctx.beginPath();
      pts.forEach((p, i) => {
        const px = scales.x.getPixelForValue(p.x);
        const py = scales.y.getPixelForValue(p.y);
        if (i === 0) ctx.moveTo(px, py);
        else ctx.lineTo(px, py);
      });
      ctx.closePath();
      ctx.fill();
    }
    ctx.restore();
  },
};

// --- Custom plugin: draw the Tissot indicatrix ellipses on top of the map --
const tissotPlugin = {
  id: "tissotIndicatrix",
  afterDatasetsDraw(chart) {
    const { ctx, scales } = chart;
    const scale = Math.abs(scales.x.getPixelForValue(1) - scales.x.getPixelForValue(0));
    const ox = scales.x.getPixelForValue(0);
    const oy = scales.y.getPixelForValue(0);
    ctx.save();
    ctx.fillStyle = hexToRgba(t.palette[0], 0.22);
    ctx.strokeStyle = t.inkSoft;
    ctx.lineWidth = 1;
    for (const p of tissotPoints) {
      const px = scales.x.getPixelForValue(p.x);
      const py = scales.y.getPixelForValue(p.y);
      const rotation = Math.atan2(py - oy, px - ox);
      const radial = Math.max(TISSOT_ANGULAR_RADIUS * p.cosC * scale, 1);
      const tangential = TISSOT_ANGULAR_RADIUS * scale;
      ctx.beginPath();
      ctx.ellipse(px, py, radial, tangential, rotation, 0, Math.PI * 2);
      ctx.fill();
      ctx.stroke();
    }
    ctx.restore();
  },
};

// --- Chart -------------------------------------------------------------------
new Chart(canvas, {
  type: "scatter",
  data: {
    datasets: [
      ...graticuleLines.map((data) => ({
        type: "line",
        data,
        showLine: true,
        pointRadius: 0,
        borderColor: t.grid,
        borderWidth: 1.25,
        tension: 0,
        spanGaps: false,
      })),
      {
        type: "line",
        data: equator,
        showLine: true,
        pointRadius: 0,
        borderColor: t.ink,
        borderWidth: 2,
        borderDash: [9, 5],
        tension: 0,
        spanGaps: false,
      },
      ...continents.map((data) => ({
        type: "line",
        data,
        showLine: true,
        pointRadius: 0,
        borderColor: t.inkSoft,
        borderWidth: 3,
        tension: 0,
        spanGaps: false,
      })),
      {
        type: "line",
        data: globeOutline,
        showLine: true,
        pointRadius: 0,
        borderColor: t.ink,
        borderWidth: 3,
        tension: 0,
      },
    ],
  },
  options: {
    responsive: true,
    maintainAspectRatio: false,
    animation: false,
    layout: { padding: 24 },
    plugins: {
      title: {
        display: true,
        text: "Orthographic Projection · map-projections · javascript · chartjs · anyplot.ai",
        color: t.ink,
        font: { size: 19 },
        padding: { top: 4, bottom: 16 },
      },
      legend: { display: false },
      tooltip: { enabled: false },
    },
    scales: {
      x: { type: "linear", display: false, min: -1.2, max: 1.2 },
      y: { type: "linear", display: false, min: -1.155, max: 1.155 },
    },
  },
  plugins: [landPlugin, tissotPlugin],
});
Runnable source as JSON, for any HTTP client: https://api.anyplot.ai/specs/map-projections/chartjs/code. Any spec id and library id listed in llms-full.txt fit the same URL shape; every URL below is complete and callable.
{
  "spec_id": "map-projections",
  "language": "javascript",
  "library": "chartjs",
  "page": "https://anyplot.ai/map-projections/javascript/chartjs",
  "hub": "https://anyplot.ai/map-projections",
  "code_json": "https://api.anyplot.ai/specs/map-projections/chartjs/code",
  "spec_json": "https://api.anyplot.ai/specs/map-projections",
  "render_light_png": "https://storage.googleapis.com/anyplot-images/plots/map-projections/javascript/chartjs/plot-light.png",
  "render_dark_png": "https://storage.googleapis.com/anyplot-images/plots/map-projections/javascript/chartjs/plot-dark.png",
  "interactive_light_html": "https://storage.googleapis.com/anyplot-images/plots/map-projections/javascript/chartjs/plot-light.html",
  "interactive_dark_html": "https://storage.googleapis.com/anyplot-images/plots/map-projections/javascript/chartjs/plot-dark.html",
  "quality_score": 87.0,
  "license": "MIT",
  "guide": "https://anyplot.ai/llms.txt"
}
Part of World Map with Different Projections on anyplot.ai.