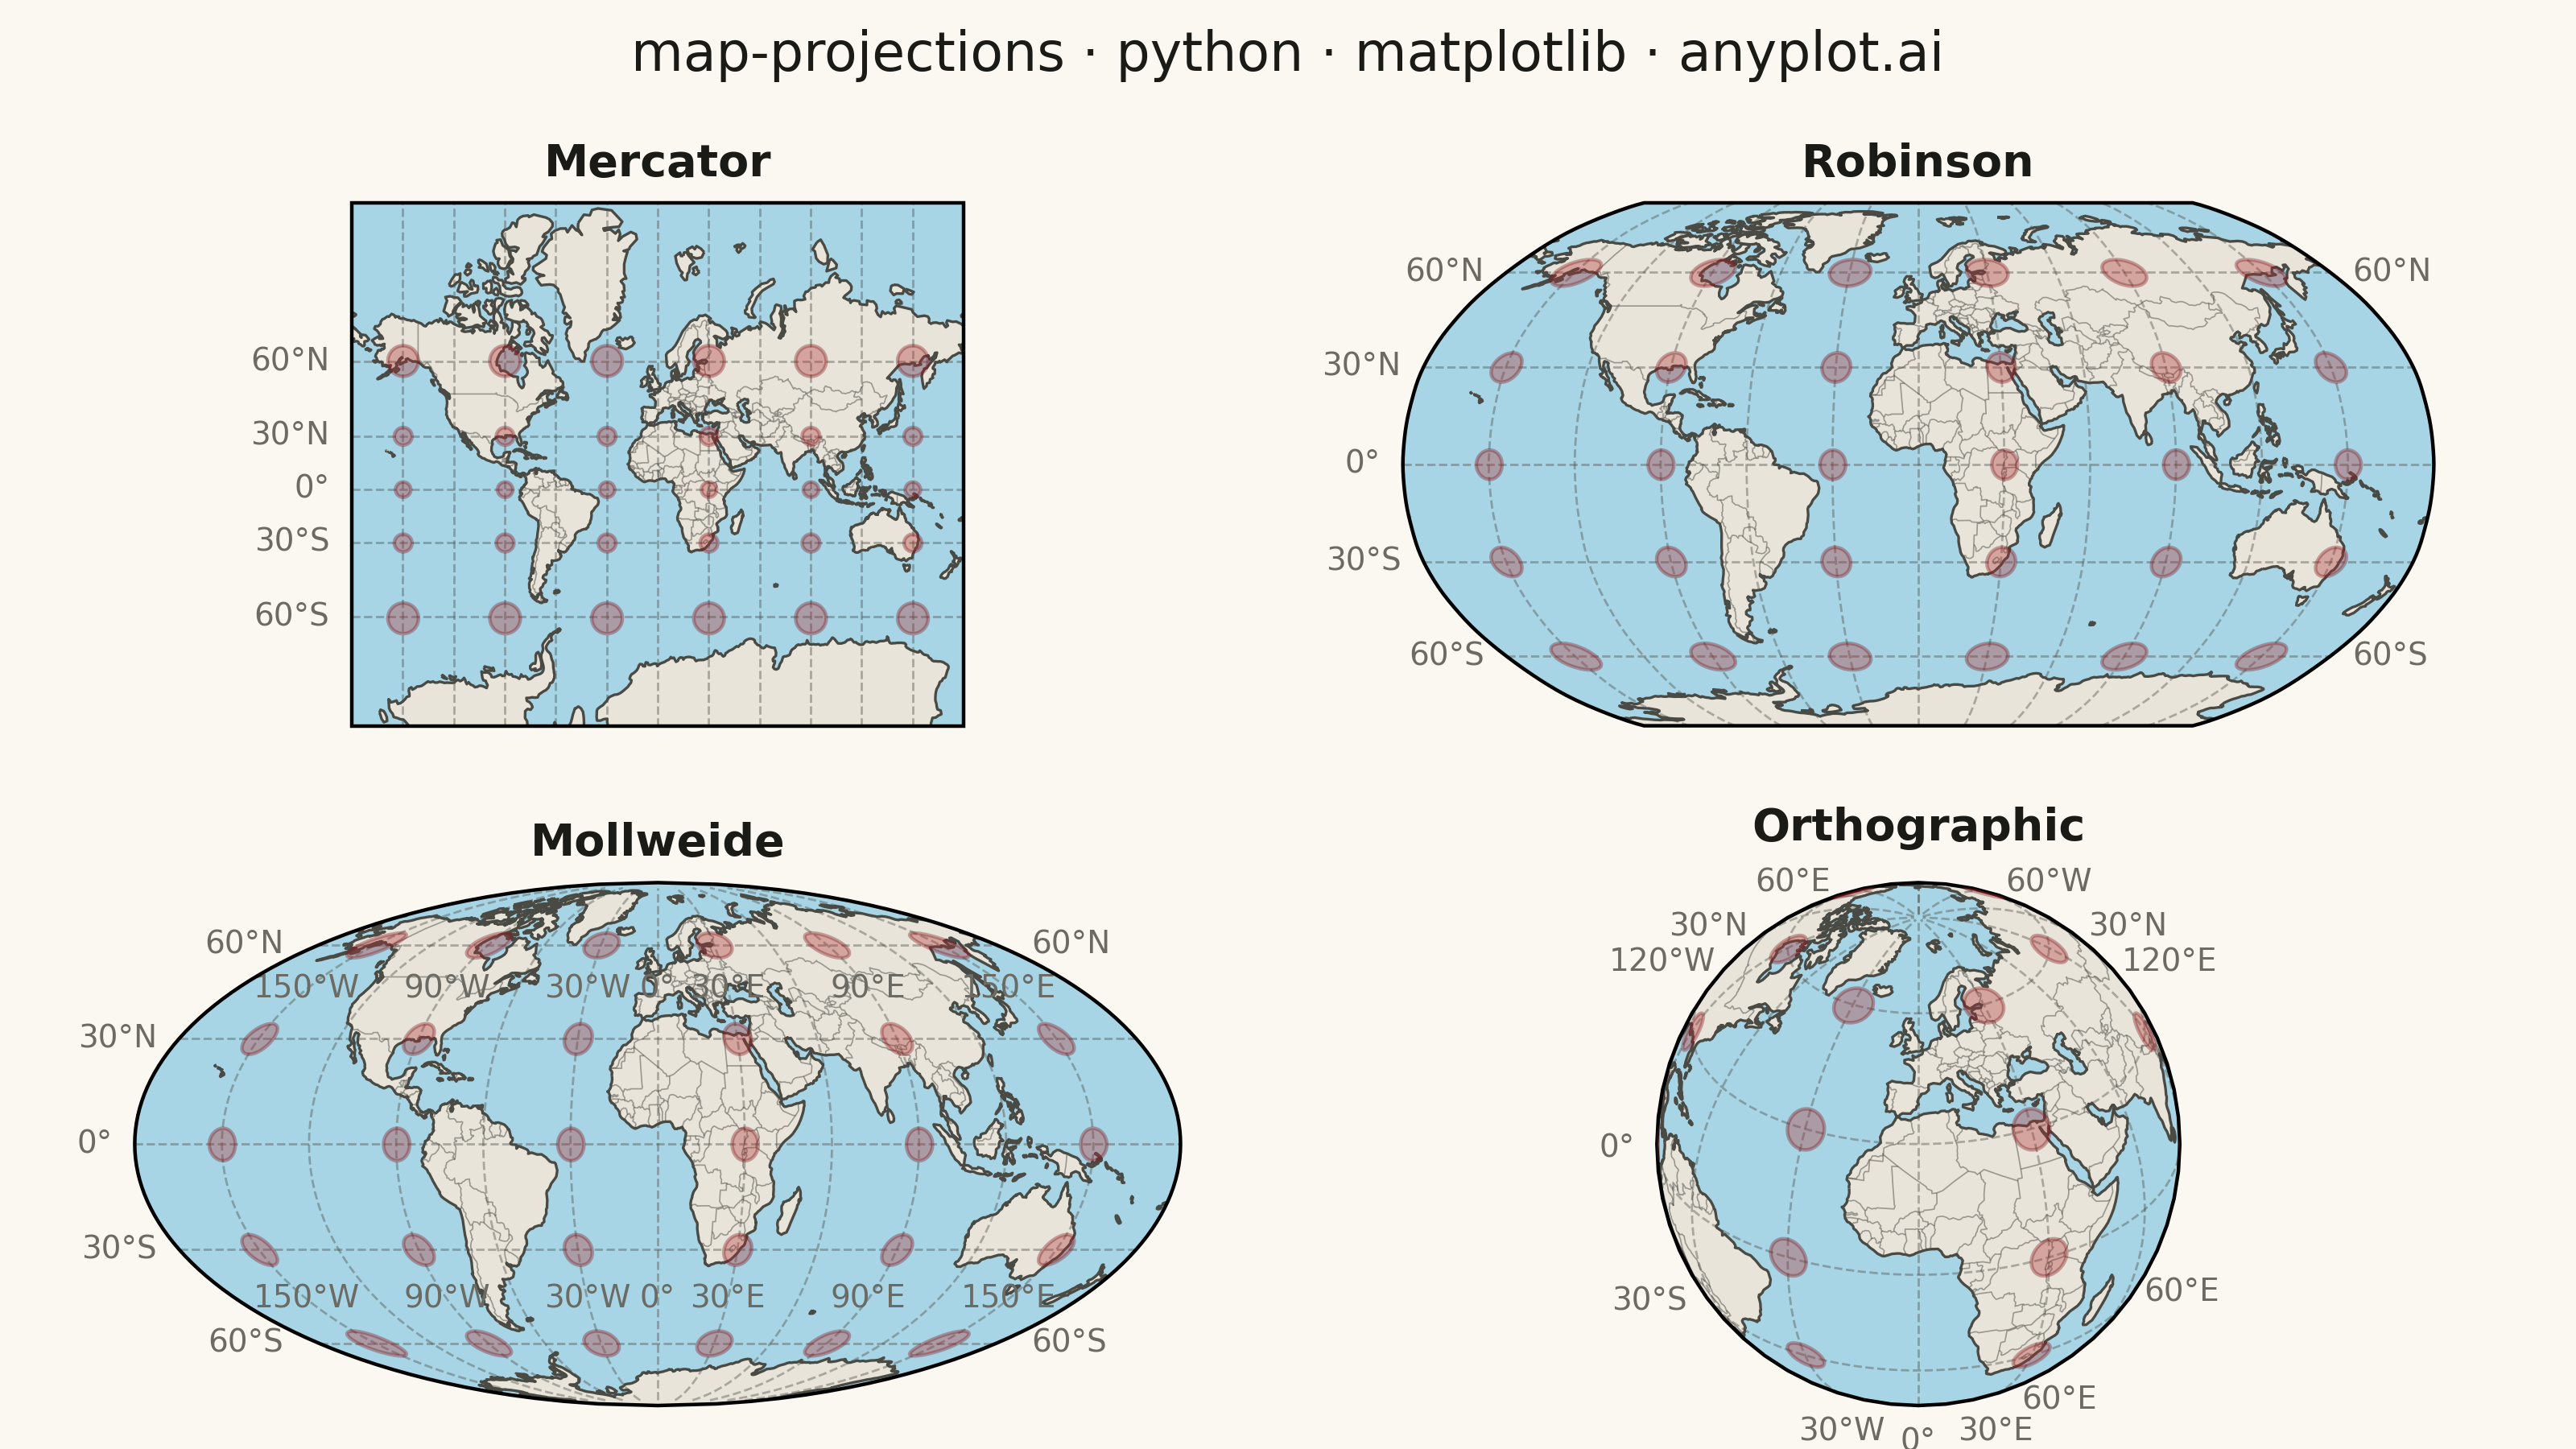
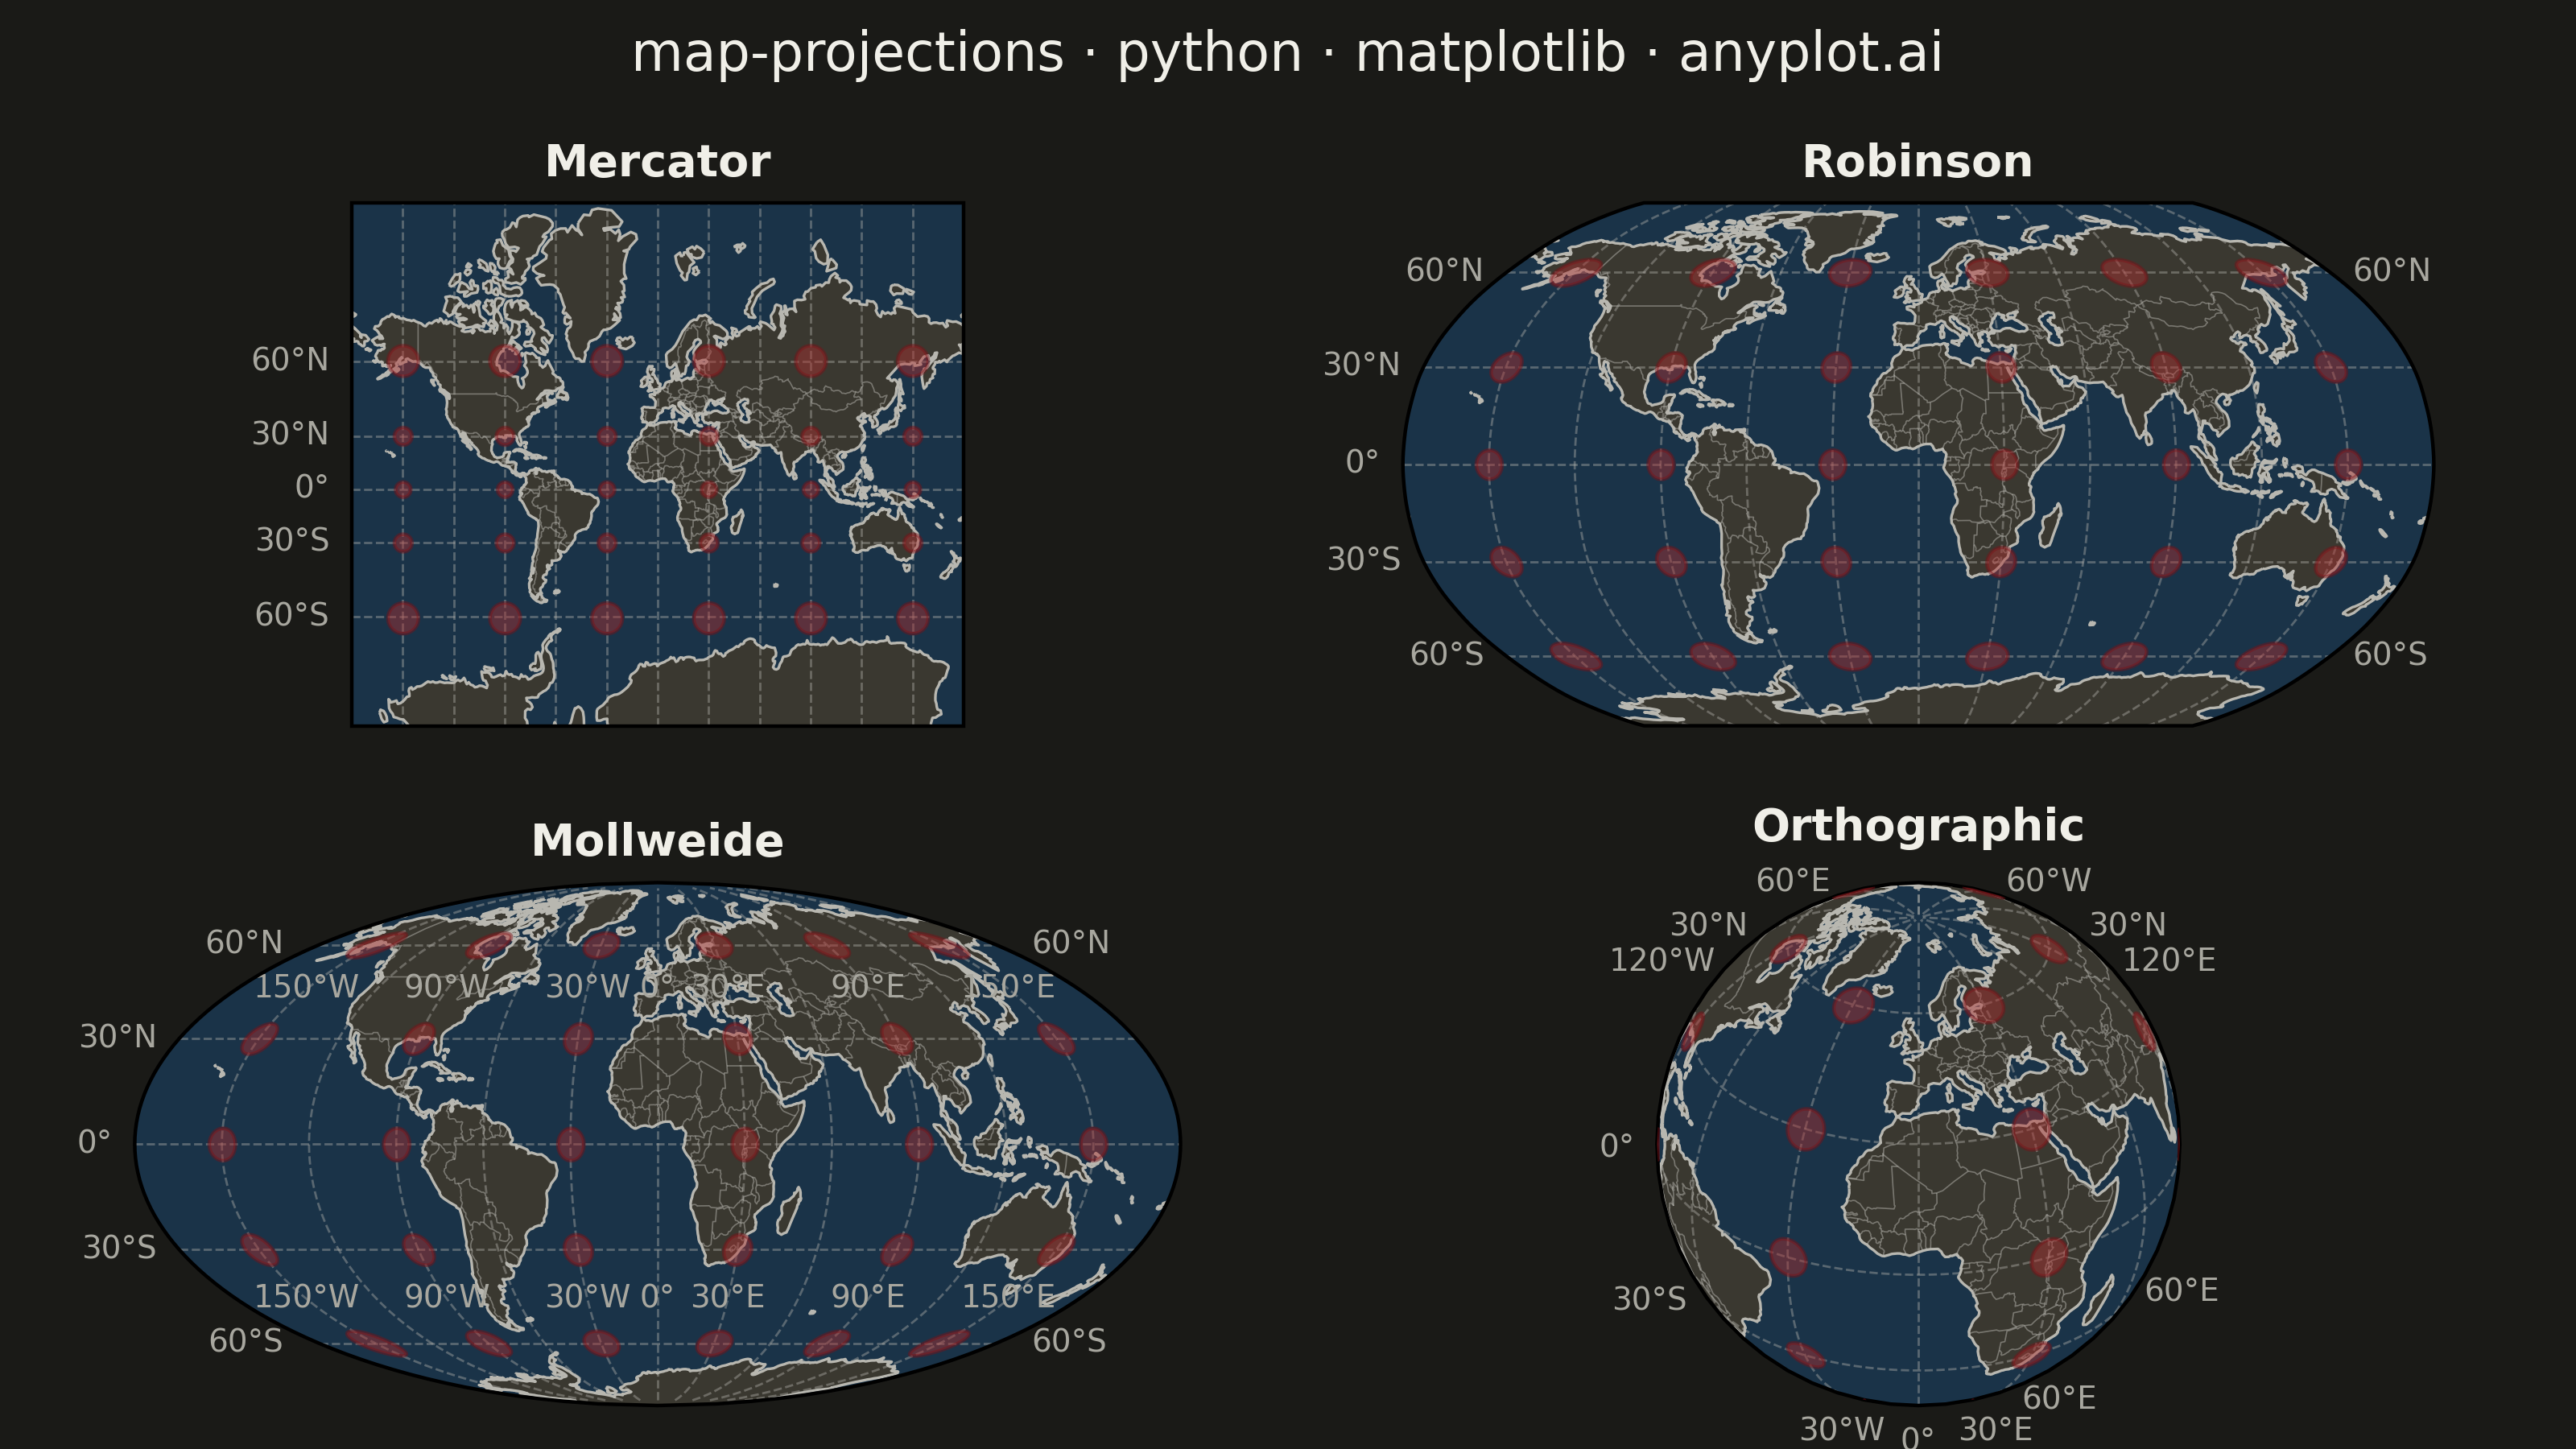
A world map demonstrating different cartographic projections and their distortion characteristics. This visualization showcases how the same geographic data appears under various map projections (Mercator, Robinson, Mollweide, Orthographic, etc.), revealing how each projection preserves or distorts area, shape, distance, or direction. The plot includes graticule (latitude/longitude grid lines) and optionally Tissot indicatrices to illustrate projection distortion patterns.
""" anyplot.ai
map-projections: World Map with Different Projections
Library: matplotlib 3.10.9 | Python 3.13.13
Quality: 84/100 | Updated: 2026-05-23
"""

import os
import sys


# Remove this script's directory from sys.path to avoid shadowing the matplotlib package
_script_dir = os.path.dirname(os.path.abspath(__file__))
sys.path = [p for p in sys.path if p != "" and os.path.abspath(p) != _script_dir]
del _script_dir

import cartopy.crs as ccrs
import cartopy.feature as cfeature
import matplotlib.pyplot as plt
import numpy as np


# Theme tokens
THEME = os.getenv("ANYPLOT_THEME", "light")
PAGE_BG = "#FAF8F1" if THEME == "light" else "#1A1A17"
INK = "#1A1A17" if THEME == "light" else "#F0EFE8"
INK_SOFT = "#4A4A44" if THEME == "light" else "#B8B7B0"
INK_MUTED = "#6B6A63" if THEME == "light" else "#A8A79F"

# Map colors (theme-adaptive; semantic: land/ocean are not data series)
LAND_COLOR = "#E8E4D9" if THEME == "light" else "#3A3830"
OCEAN_COLOR = "#A8D5E5" if THEME == "light" else "#1A3348"
TISSOT_COLOR = "#AE3030"  # Imprint palette position 3 (red)

# Projections to compare
projections = [
    ("Mercator", ccrs.Mercator()),
    ("Robinson", ccrs.Robinson()),
    ("Mollweide", ccrs.Mollweide()),
    ("Orthographic", ccrs.Orthographic(central_longitude=0, central_latitude=30)),
]

# Figure — 3200×1800 px (16:9)
fig = plt.figure(figsize=(8, 4.5), dpi=400, facecolor=PAGE_BG)
fig.suptitle("map-projections · python · matplotlib · anyplot.ai", fontsize=12, fontweight="medium", color=INK, y=0.98)

for i, (name, proj) in enumerate(projections):
    ax = fig.add_subplot(2, 2, i + 1, projection=proj)

    try:
        ax.set_global()
    except Exception:
        pass

    # Map features
    ax.add_feature(cfeature.OCEAN, facecolor=OCEAN_COLOR, zorder=0)
    ax.add_feature(cfeature.LAND, facecolor=LAND_COLOR, zorder=1)
    ax.add_feature(cfeature.COASTLINE, linewidth=0.6, edgecolor=INK_SOFT, zorder=2)
    ax.add_feature(cfeature.BORDERS, linewidth=0.3, edgecolor=INK_SOFT, alpha=0.5, zorder=2)

    # Graticule with lat/lon labels where supported
    # Disable bottom labels for top-row subplots to prevent overlap with second-row titles
    is_top_row = i < 2
    try:
        gl = ax.gridlines(draw_labels=True, linewidth=0.5, color=INK_SOFT, alpha=0.4, linestyle="--")
        gl.top_labels = False
        gl.right_labels = False
        gl.bottom_labels = not is_top_row
        gl.xlabel_style = {"size": 7, "color": INK_MUTED}
        gl.ylabel_style = {"size": 7, "color": INK_MUTED}
    except Exception:
        gl = ax.gridlines(draw_labels=False, linewidth=0.5, color=INK_SOFT, alpha=0.4, linestyle="--")
    gl.xlocator = plt.FixedLocator(np.arange(-180, 181, 30))
    gl.ylocator = plt.FixedLocator(np.arange(-90, 91, 30))

    # Tissot indicatrices — visualise projection distortion of area/shape
    for lon in np.arange(-150, 180, 60):
        for lat in np.arange(-60, 90, 30):
            try:
                ax.tissot(
                    rad_km=500,
                    lons=lon,
                    lats=lat,
                    n_samples=64,
                    facecolor=TISSOT_COLOR,
                    edgecolor="#7B1117",
                    alpha=0.45 if THEME == "dark" else 0.35,
                    linewidth=0.8,
                    zorder=3,
                )
            except Exception:
                pass

    ax.set_title(name, fontsize=10, fontweight="bold", color=INK, pad=6)

fig.subplots_adjust(left=0.02, right=0.98, top=0.86, bottom=0.03, hspace=0.30, wspace=0.04)
plt.savefig(f"plot-{THEME}.png", dpi=400, facecolor=PAGE_BG)
Runnable source as JSON, for any HTTP client: https://api.anyplot.ai/specs/map-projections/matplotlib/code. Any spec id and library id listed in llms-full.txt fit the same URL shape; every URL below is complete and callable.
{
  "spec_id": "map-projections",
  "language": "python",
  "library": "matplotlib",
  "page": "https://anyplot.ai/map-projections/python/matplotlib",
  "hub": "https://anyplot.ai/map-projections",
  "code_json": "https://api.anyplot.ai/specs/map-projections/matplotlib/code",
  "spec_json": "https://api.anyplot.ai/specs/map-projections",
  "render_light_png": "https://storage.googleapis.com/anyplot-images/plots/map-projections/python/matplotlib/plot-light.png",
  "render_dark_png": "https://storage.googleapis.com/anyplot-images/plots/map-projections/python/matplotlib/plot-dark.png",
  "quality_score": 84.0,
  "license": "MIT",
  "guide": "https://anyplot.ai/llms.txt"
}
Part of World Map with Different Projections on anyplot.ai.