The same plot in 14 other libraries — JavaScript: Chart.js, D3.js, Highcharts, MUI X Charts; Python: Altair, Bokeh, lets-plot, Matplotlib, Plotly, plotnine, Pygal, Seaborn; R: ggplot2; Julia: Makie.jl. Compare all 15 side by side: World Map with Different Projections in Python, R, Julia and JavaScript.
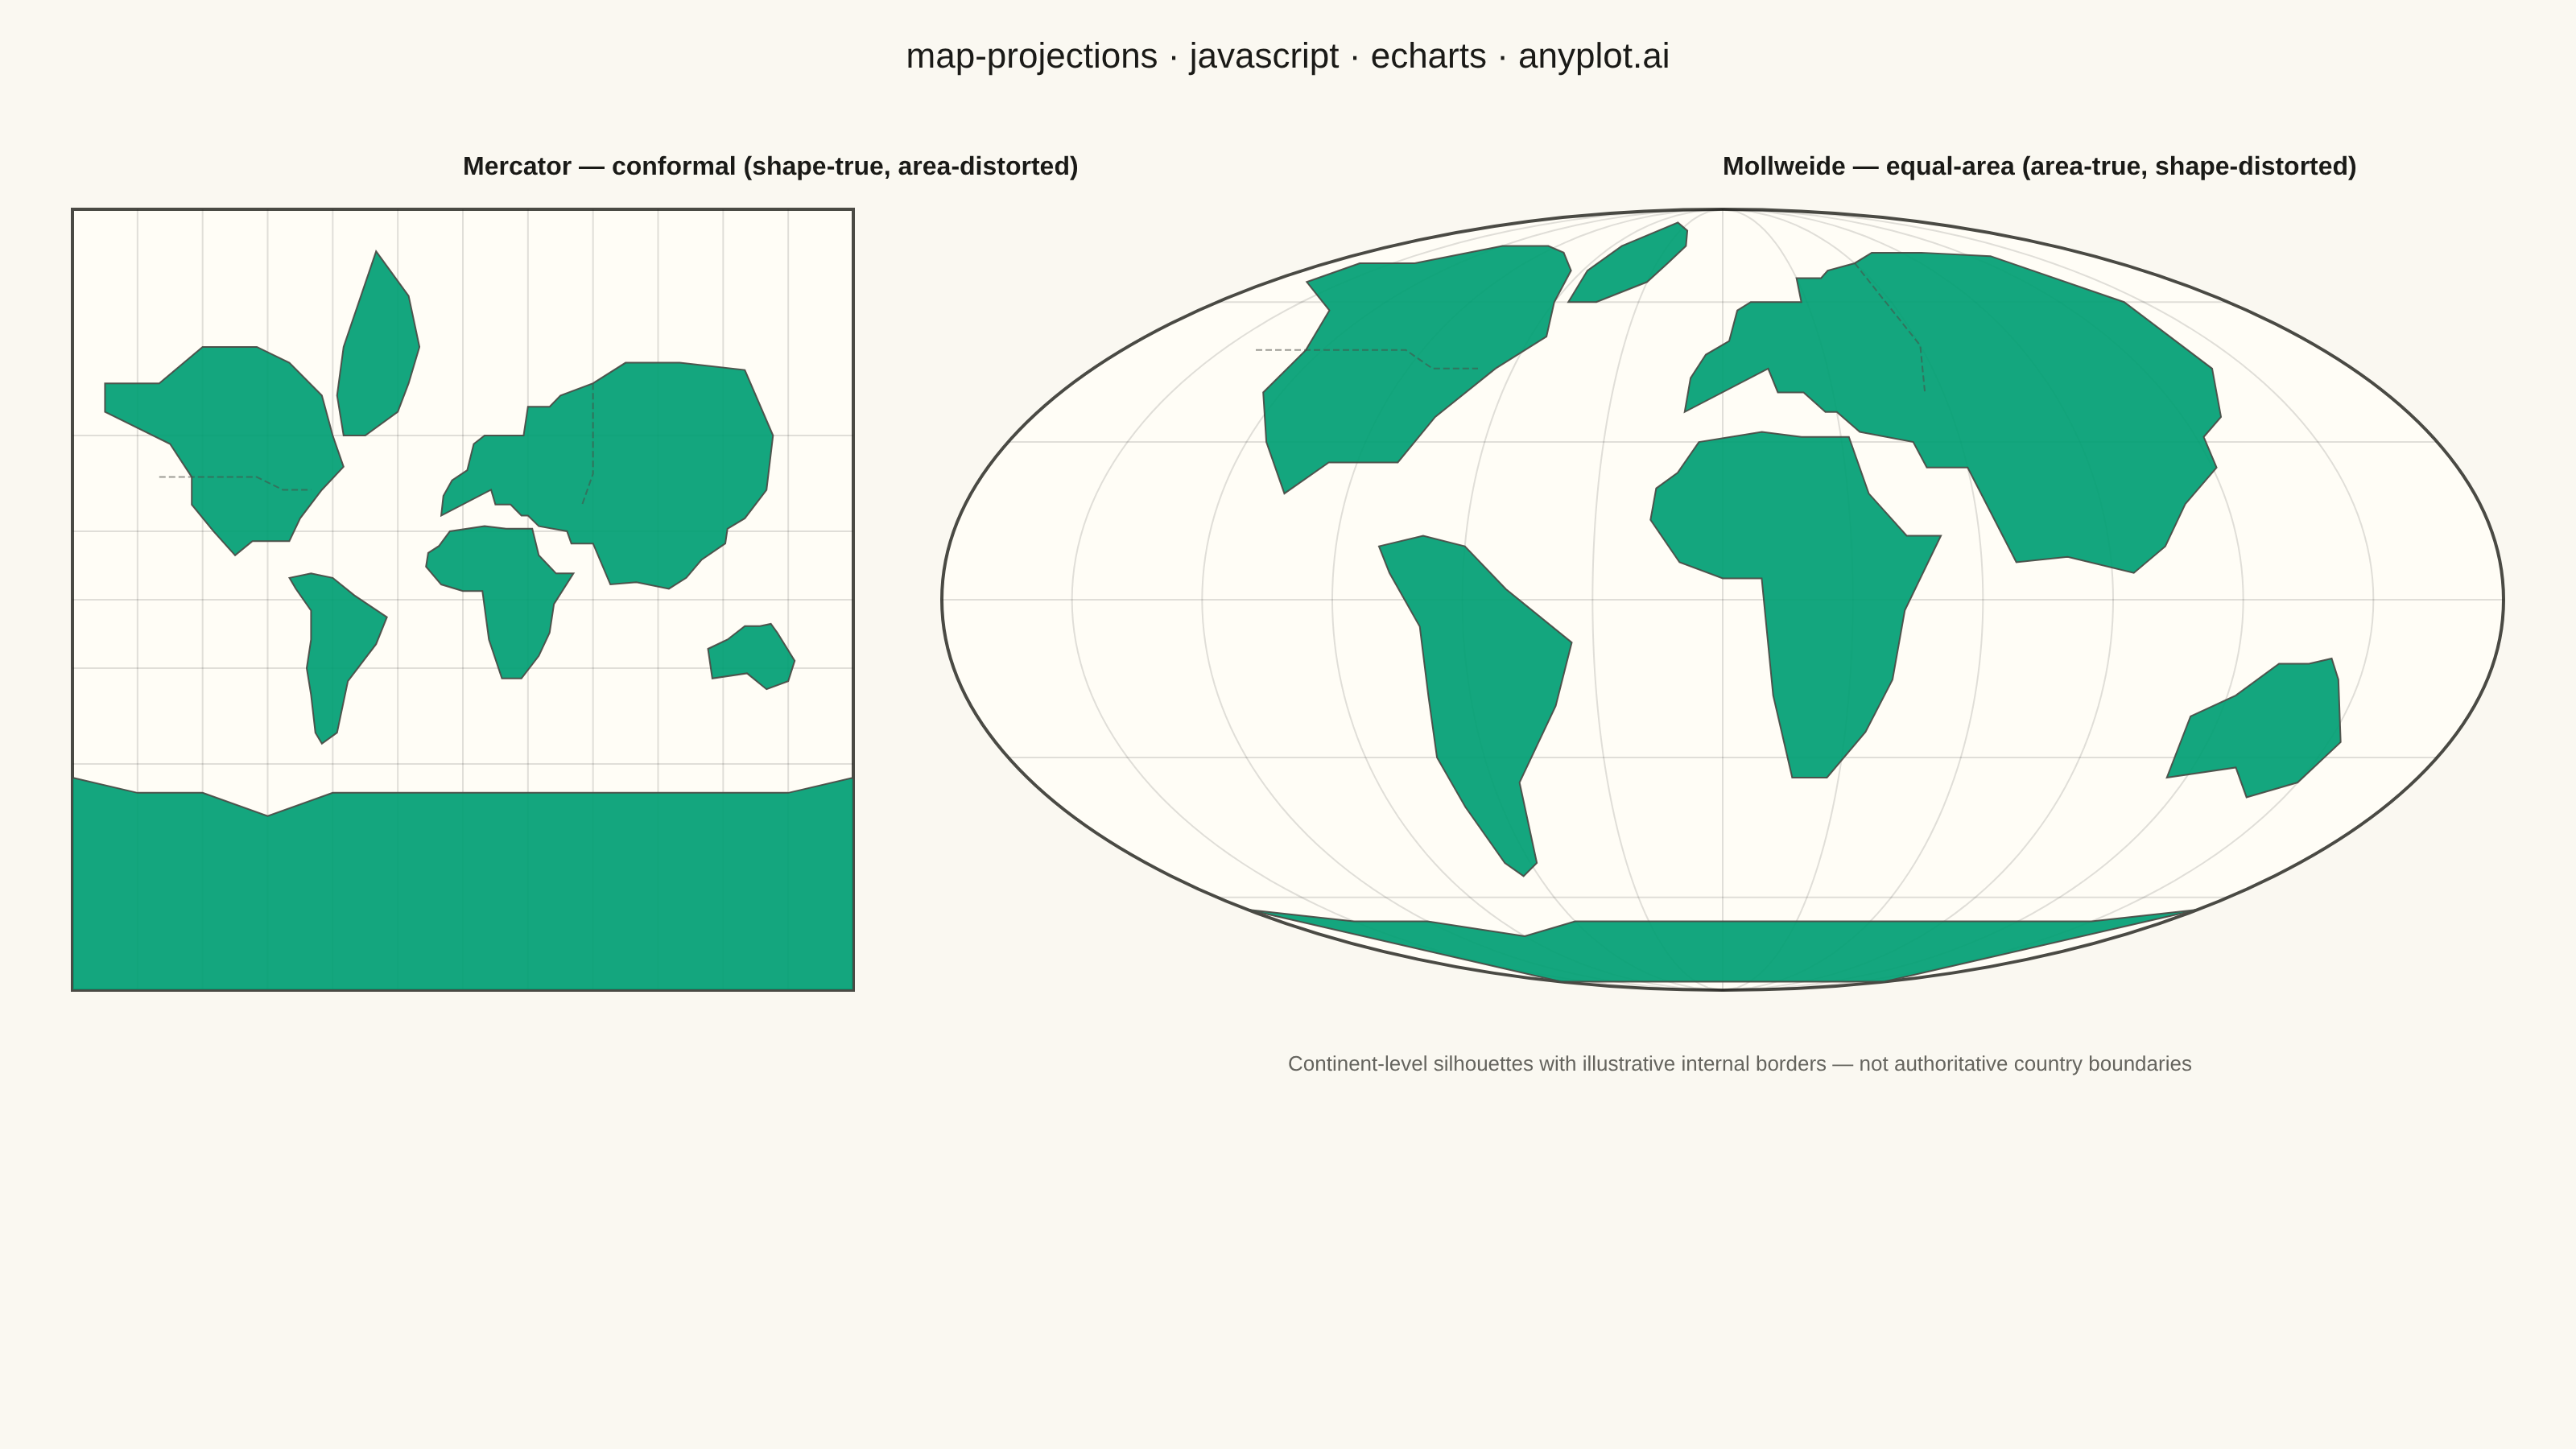
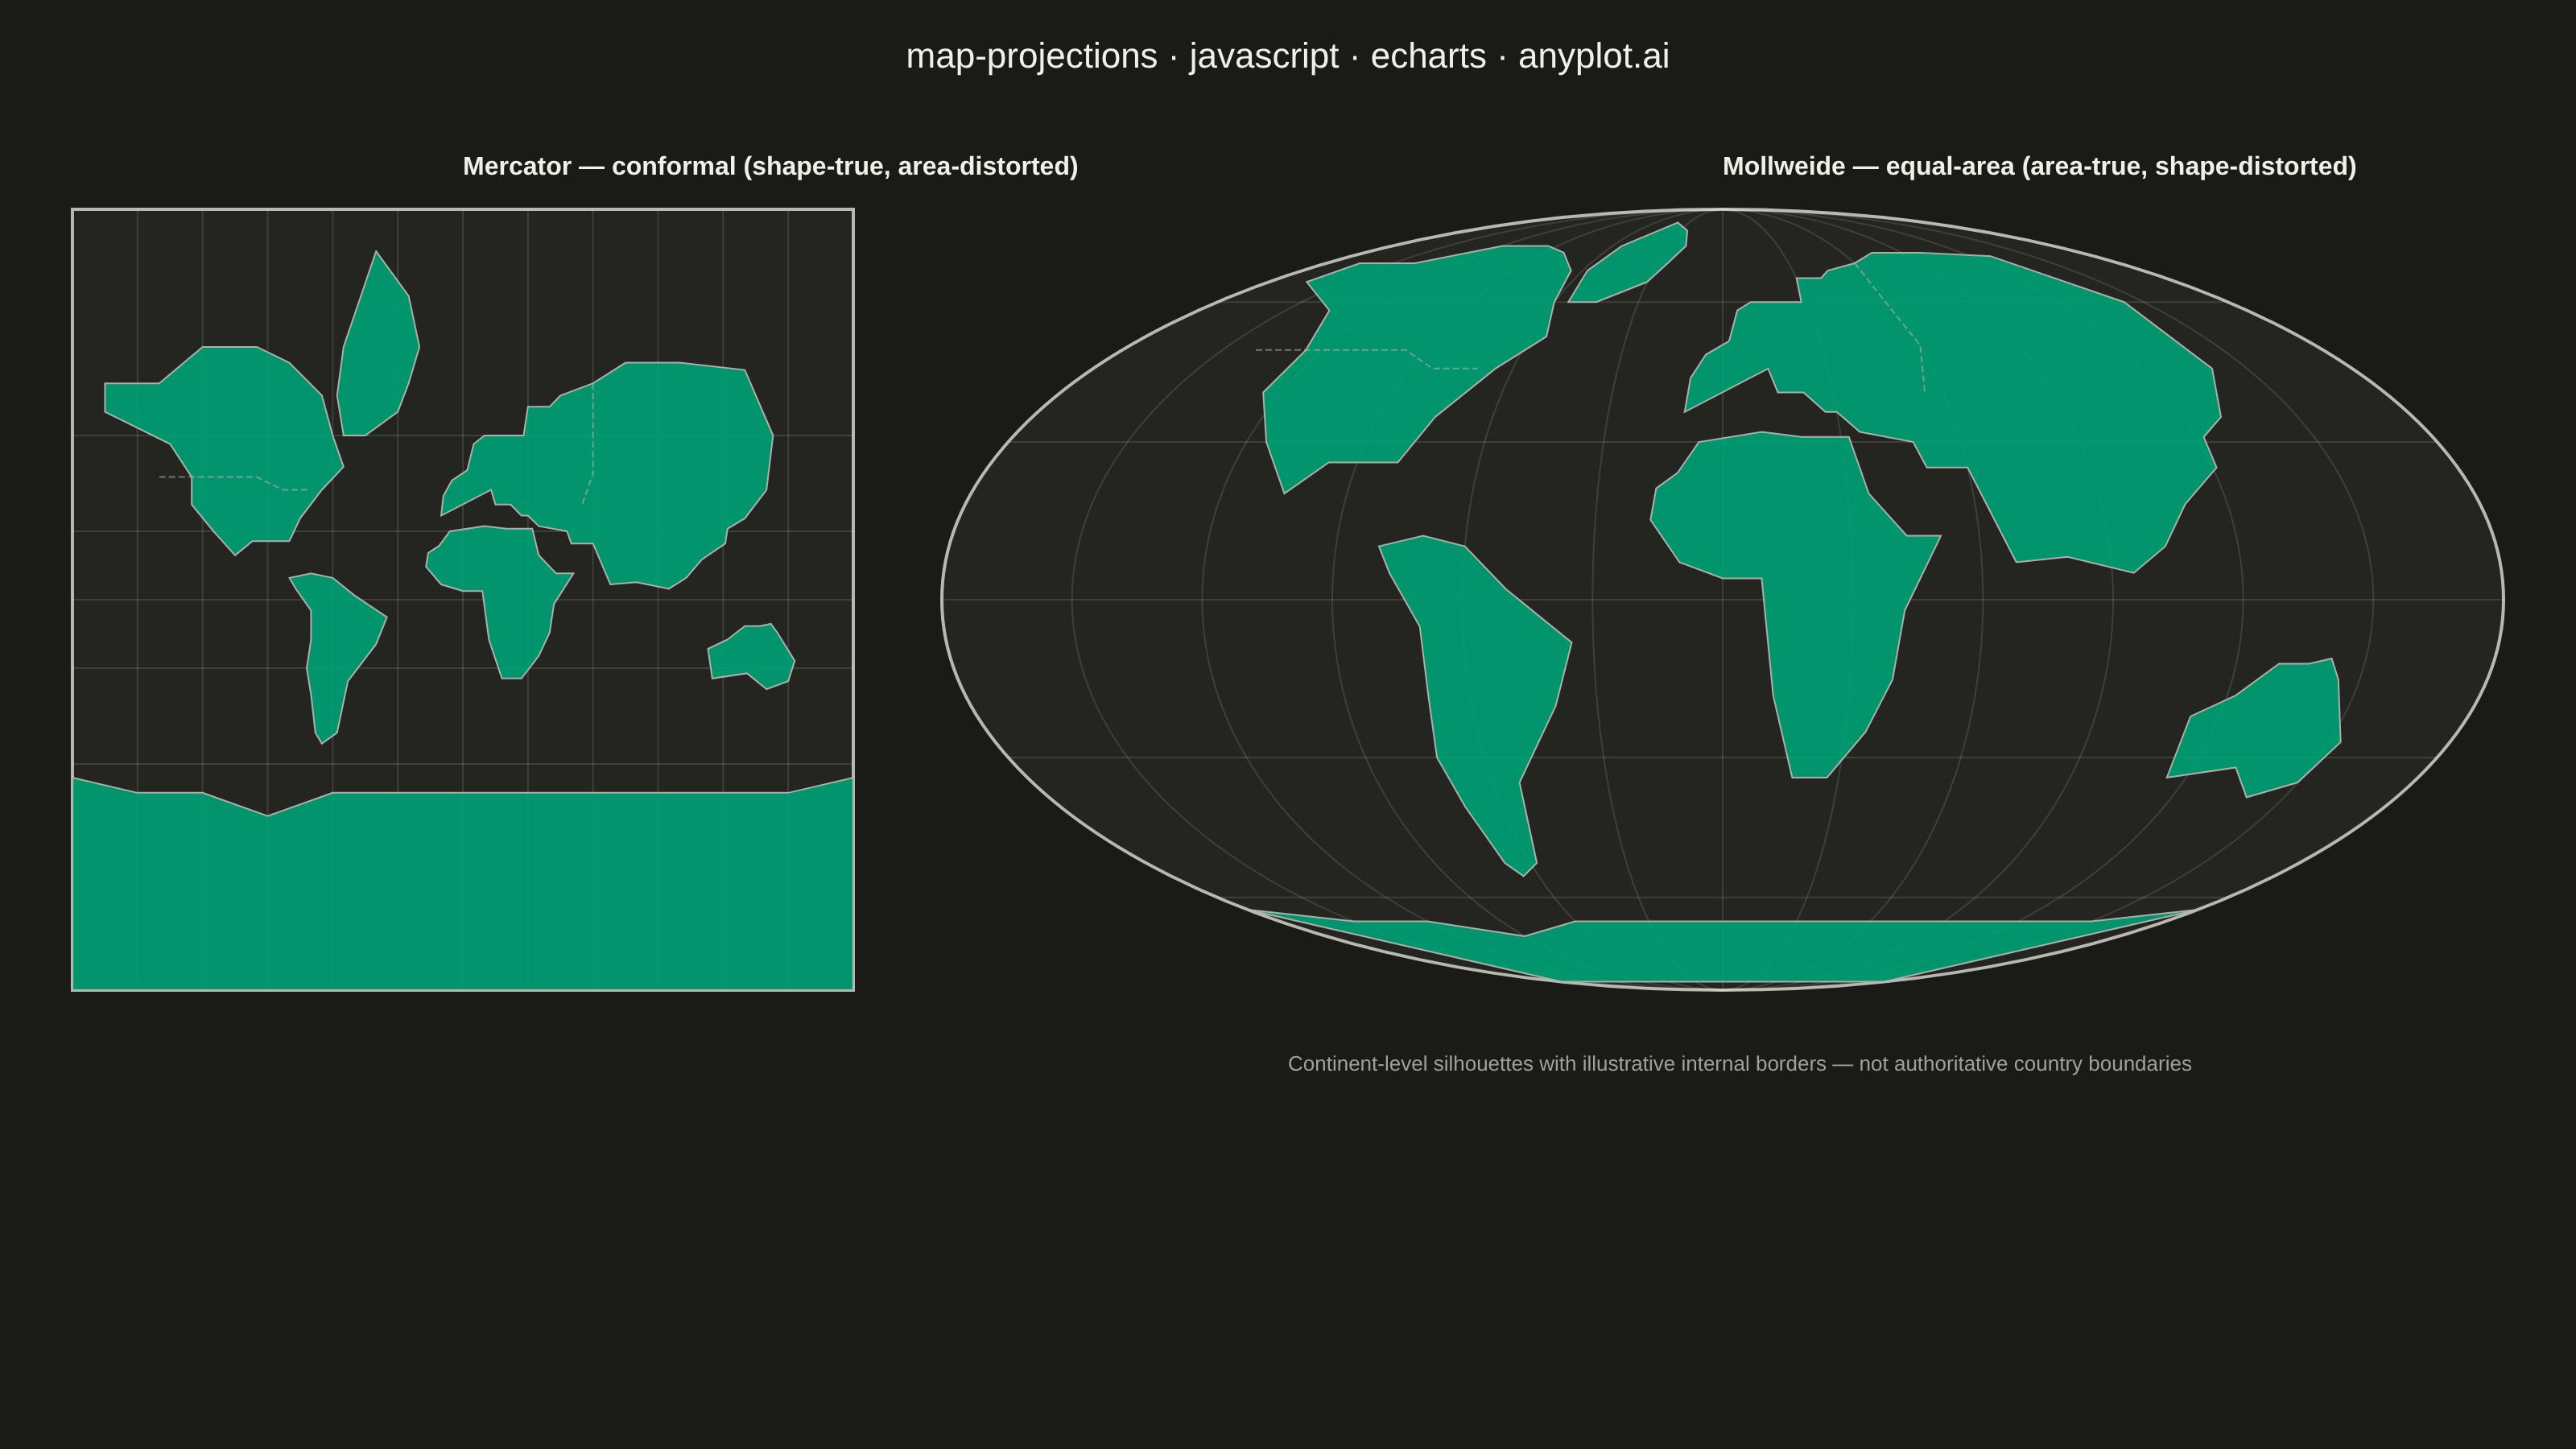
A world map demonstrating different cartographic projections and their distortion characteristics. This visualization showcases how the same geographic data appears under various map projections (Mercator, Robinson, Mollweide, Orthographic, etc.), revealing how each projection preserves or distorts area, shape, distance, or direction. The plot includes graticule (latitude/longitude grid lines) and optionally Tissot indicatrices to illustrate projection distortion patterns.
// anyplot.ai
// map-projections: World Map with Different Projections
// Library: echarts 6.1.0 | JavaScript 22.23.2
// Quality: 81/100 | Created: 2026-08-26

const t = window.ANYPLOT_TOKENS;
const SIZE = window.ANYPLOT_SIZE;

// --- Simplified landmass outlines (lon, lat degrees) ------------------------
// Low-vertex silhouettes, not survey-accurate coastlines — enough to carry the
// projection-distortion story (esp. Greenland/Antarctica vs. Africa in scale).
// No offline per-country GeoJSON ships with the pinned echarts build, so land
// is shown at continent granularity; a couple of illustrative (non-authoritative)
// internal borders are layered on top to at least gesture at country boundaries.
const LANDMASS_NAMES = ["Africa", "Eurasia", "North America", "South America", "Greenland", "Australia", "Antarctica"];
const LANDMASSES = [
  [
    [-17, 15], [-16, 21], [-11, 24], [-6, 30], [10, 32], [20, 31], [32, 31],
    [35, 20], [43, 12], [51, 12], [42, -2], [40, -15], [35, -25], [27, -34],
    [18, -34], [12, -18], [9, 4], [0, 4], [-10, 7], [-17, 15],
  ], // Africa
  [
    [-10, 36], [-9, 43], [-5, 48], [2, 51], [5, 58], [10, 60], [20, 60],
    [28, 60], [30, 66], [40, 66], [45, 68], [60, 70], [75, 73], [100, 73],
    [130, 72], [143, 60], [140, 45], [130, 35], [122, 31], [121, 25],
    [110, 18], [103, 10], [95, 5], [80, 8], [68, 7], [60, 25], [50, 25],
    [48, 30], [35, 32], [30, 36], [27, 36], [22, 40], [15, 40], [13, 45],
    [-10, 36],
  ], // Eurasia
  [
    [-165, 65], [-165, 70], [-140, 70], [-120, 75], [-95, 75], [-80, 73],
    [-65, 68], [-60, 60], [-55, 52], [-65, 45], [-75, 35], [-80, 26],
    [-97, 26], [-105, 20], [-115, 30], [-125, 40], [-125, 49], [-135, 58],
    [-165, 65],
  ], // North America
  [
    [-80, 10], [-77, 5], [-70, -5], [-70, -18], [-72, -30], [-70, -40],
    [-68, -52], [-65, -55], [-58, -52], [-53, -35], [-40, -20], [-35, -8],
    [-50, 2], [-60, 10], [-70, 12], [-80, 10],
  ], // South America
  [
    [-55, 60], [-45, 60], [-30, 65], [-25, 70], [-20, 75], [-25, 80],
    [-40, 83], [-55, 75], [-58, 68], [-55, 60],
  ], // Greenland
  [
    [113, -22], [122, -18], [130, -12], [137, -12], [142, -11], [145, -15],
    [153, -27], [150, -35], [140, -38], [131, -32], [115, -34], [113, -22],
  ], // Australia
  [
    [-180, -63], [-150, -66], [-120, -66], [-90, -70], [-60, -66],
    [-30, -66], [0, -66], [30, -66], [60, -66], [90, -66], [120, -66],
    [150, -66], [180, -63], [180, -85], [-180, -85], [-180, -63],
  ], // Antarctica
];

// Illustrative internal borders — not authoritative, just enough to gesture at
// the "country boundaries" the spec asks for without a bundled GeoJSON dataset.
const INTERNAL_BORDERS = [
  { name: "Europe–Asia divide (illustrative, Ural Mtns)", points: [[60, 70], [60, 50], [55, 40]] },
  { name: "Canada–United States (illustrative)", points: [[-140, 49], [-95, 49], [-83, 45], [-70, 45]] },
];

// --- Projections --------------------------------------------------------------
const MERC_CLIP = 85; // clamp latitude — true Mercator diverges at the poles

function toRad(deg) {
  return (deg * Math.PI) / 180;
}

function mercatorXY(lon, lat) {
  const phi = toRad(Math.max(-MERC_CLIP, Math.min(MERC_CLIP, lat)));
  return { x: toRad(lon), y: Math.log(Math.tan(Math.PI / 4 + phi / 2)) };
}

function mollweideXY(lon, lat) {
  const phi = toRad(lat);
  const lam = toRad(lon);
  let theta = phi;
  if (Math.PI / 2 - Math.abs(phi) > 1e-9) {
    for (let i = 0; i < 10; i++) {
      const delta = (2 * theta + Math.sin(2 * theta) - Math.PI * Math.sin(phi)) / (2 + 2 * Math.cos(2 * theta));
      theta -= delta;
    }
  } else {
    theta = Math.sign(phi) * (Math.PI / 2);
  }
  return { x: ((2 * Math.SQRT2) / Math.PI) * lam * Math.cos(theta), y: Math.SQRT2 * Math.sin(theta) };
}

const MERC_Y_LIMIT = mercatorXY(0, MERC_CLIP).y;
const PROJECTIONS = {
  mercator: {
    fn: mercatorXY,
    range: { xMin: -Math.PI, xMax: Math.PI, yMin: -MERC_Y_LIMIT, yMax: MERC_Y_LIMIT },
    latMin: -MERC_CLIP,
    latMax: MERC_CLIP,
  },
  mollweide: {
    fn: mollweideXY,
    range: { xMin: -2 * Math.SQRT2, xMax: 2 * Math.SQRT2, yMin: -Math.SQRT2, yMax: Math.SQRT2 },
    latMin: -90,
    latMax: 90,
  },
};

// Project a lon/lat pair into the data-space [x, y] pair for a given
// projection kind. The cartesian2d grid/axis pair below does the linear
// mapping from this data space into panel pixels — no manual rect math here.
function projArr(lon, lat, kind) {
  const p = PROJECTIONS[kind].fn(lon, lat);
  return [p.x, p.y];
}

function meridian(lon, kind) {
  const proj = PROJECTIONS[kind];
  const pts = [];
  for (let lat = proj.latMin; lat <= proj.latMax + 1e-6; lat += 2) pts.push([lon, lat]);
  return pts;
}

function parallel(lat) {
  return [[-180, lat], [180, lat]];
}

// --- Panel layout (CSS px, within the ANYPLOT_SIZE mount) -------------------
const MARGIN_X = 45;
const GAP_X = 55;
// Mollweide panel is 2x as wide as the square Mercator panel — 3 width units total.
const PANEL_H = Math.floor((SIZE.width - 2 * MARGIN_X - GAP_X) / 3);
const PANEL_Y = 130;
const MERC_RECT = { x: MARGIN_X, y: PANEL_Y, w: PANEL_H, h: PANEL_H };
const MOLL_RECT = { x: MARGIN_X + PANEL_H + GAP_X, y: PANEL_Y, w: 2 * PANEL_H, h: PANEL_H };
const CAPTION_Y = PANEL_Y + PANEL_H + 40;

const MERIDIAN_LONS = [-150, -120, -90, -60, -30, 0, 30, 60, 90, 120, 150];
const PARALLEL_LATS = [-60, -30, 0, 30, 60];
const OCEAN_STYLE = { fill: t.elevatedBg, stroke: t.inkSoft, lineWidth: 2 };

// --- Series data builders (idiomatic ECharts: cartesian2d grid + `lines` /
// `custom` series, instead of hand-drawn `graphic.elements`) ------------------
function graticuleLines(kind) {
  const lines = [];
  for (const lon of MERIDIAN_LONS) {
    lines.push({ coords: meridian(lon, kind).map(([lo, la]) => projArr(lo, la, kind)) });
  }
  for (const lat of PARALLEL_LATS) {
    lines.push({ coords: parallel(lat).map(([lo, la]) => projArr(lo, la, kind)) });
  }
  return lines;
}

function borderLines(kind) {
  return INTERNAL_BORDERS.map((b) => ({
    name: b.name,
    coords: b.points.map(([lon, lat]) => projArr(lon, lat, kind)),
  }));
}

const LAND_DATA = LANDMASS_NAMES.map((name) => ({ name, value: name }));

function landRenderItem(kind) {
  return function (params, api) {
    const points = LANDMASSES[params.dataIndex].map(([lon, lat]) => api.coord(projArr(lon, lat, kind)));
    return { type: "polygon", shape: { points }, style: api.style() };
  };
}

function panelGraphics(rect, label) {
  return [
    {
      type: rect === MERC_RECT ? "rect" : "ellipse",
      shape:
        rect === MERC_RECT
          ? { x: rect.x, y: rect.y, width: rect.w, height: rect.h }
          : { cx: rect.x + rect.w / 2, cy: rect.y + rect.h / 2, rx: rect.w / 2, ry: rect.h / 2 },
      style: OCEAN_STYLE,
      silent: true,
    },
    {
      type: "text",
      left: rect.x + rect.w / 2,
      top: rect.y - 34,
      style: { text: label, fill: t.ink, font: "600 16px sans-serif", textAlign: "center" },
    },
  ];
}

const graphicElements = [
  ...panelGraphics(MERC_RECT, "Mercator — conformal (shape-true, area-distorted)"),
  ...panelGraphics(MOLL_RECT, "Mollweide — equal-area (area-true, shape-distorted)"),
  {
    type: "text",
    left: SIZE.width / 2,
    top: CAPTION_Y,
    style: {
      text: "Continent-level silhouettes with illustrative internal borders — not authoritative country boundaries",
      fill: t.inkSoft,
      font: "13px sans-serif",
      textAlign: "center",
      opacity: 0.85,
    },
  },
];

// --- Chart --------------------------------------------------------------------
const chart = echarts.init(document.getElementById("container"));

chart.setOption({
  animation: false,
  backgroundColor: "transparent",
  title: {
    text: "map-projections · javascript · echarts · anyplot.ai",
    left: "center",
    top: 20,
    textStyle: { color: t.ink, fontSize: 22, fontWeight: 500 },
  },
  tooltip: {
    trigger: "item",
    backgroundColor: t.elevatedBg,
    borderColor: t.grid,
    textStyle: { color: t.ink },
    formatter: (p) => p.name,
  },
  graphic: { elements: graphicElements },
  grid: [
    { left: MERC_RECT.x, top: MERC_RECT.y, width: MERC_RECT.w, height: MERC_RECT.h, show: false },
    { left: MOLL_RECT.x, top: MOLL_RECT.y, width: MOLL_RECT.w, height: MOLL_RECT.h, show: false },
  ],
  xAxis: [
    { gridIndex: 0, type: "value", min: PROJECTIONS.mercator.range.xMin, max: PROJECTIONS.mercator.range.xMax, show: false },
    { gridIndex: 1, type: "value", min: PROJECTIONS.mollweide.range.xMin, max: PROJECTIONS.mollweide.range.xMax, show: false },
  ],
  yAxis: [
    { gridIndex: 0, type: "value", min: PROJECTIONS.mercator.range.yMin, max: PROJECTIONS.mercator.range.yMax, show: false },
    { gridIndex: 1, type: "value", min: PROJECTIONS.mollweide.range.yMin, max: PROJECTIONS.mollweide.range.yMax, show: false },
  ],
  series: [
    {
      type: "lines",
      coordinateSystem: "cartesian2d",
      xAxisIndex: 0,
      yAxisIndex: 0,
      polyline: true,
      silent: true,
      z: 1,
      lineStyle: { color: t.grid, width: 1, opacity: 0.9 },
      data: graticuleLines("mercator"),
    },
    {
      type: "lines",
      coordinateSystem: "cartesian2d",
      xAxisIndex: 1,
      yAxisIndex: 1,
      polyline: true,
      silent: true,
      z: 1,
      lineStyle: { color: t.grid, width: 1, opacity: 0.9 },
      data: graticuleLines("mollweide"),
    },
    {
      type: "custom",
      coordinateSystem: "cartesian2d",
      xAxisIndex: 0,
      yAxisIndex: 0,
      z: 2,
      itemStyle: { color: t.palette[0], borderColor: t.inkSoft, borderWidth: 1, opacity: 0.92 },
      renderItem: landRenderItem("mercator"),
      data: LAND_DATA,
    },
    {
      type: "custom",
      coordinateSystem: "cartesian2d",
      xAxisIndex: 1,
      yAxisIndex: 1,
      z: 2,
      itemStyle: { color: t.palette[0], borderColor: t.inkSoft, borderWidth: 1, opacity: 0.92 },
      renderItem: landRenderItem("mollweide"),
      data: LAND_DATA,
    },
    {
      type: "lines",
      coordinateSystem: "cartesian2d",
      xAxisIndex: 0,
      yAxisIndex: 0,
      polyline: true,
      silent: true,
      z: 3,
      lineStyle: { color: t.inkSoft, width: 1, type: "dashed", opacity: 0.55 },
      data: borderLines("mercator"),
    },
    {
      type: "lines",
      coordinateSystem: "cartesian2d",
      xAxisIndex: 1,
      yAxisIndex: 1,
      polyline: true,
      silent: true,
      z: 3,
      lineStyle: { color: t.inkSoft, width: 1, type: "dashed", opacity: 0.55 },
      data: borderLines("mollweide"),
    },
  ],
});
Runnable source as JSON, for any HTTP client: https://api.anyplot.ai/specs/map-projections/echarts/code. Any spec id and library id listed in llms-full.txt fit the same URL shape; every URL below is complete and callable.
{
  "spec_id": "map-projections",
  "language": "javascript",
  "library": "echarts",
  "page": "https://anyplot.ai/map-projections/javascript/echarts",
  "hub": "https://anyplot.ai/map-projections",
  "code_json": "https://api.anyplot.ai/specs/map-projections/echarts/code",
  "spec_json": "https://api.anyplot.ai/specs/map-projections",
  "render_light_png": "https://storage.googleapis.com/anyplot-images/plots/map-projections/javascript/echarts/plot-light.png",
  "render_dark_png": "https://storage.googleapis.com/anyplot-images/plots/map-projections/javascript/echarts/plot-dark.png",
  "interactive_light_html": "https://storage.googleapis.com/anyplot-images/plots/map-projections/javascript/echarts/plot-light.html",
  "interactive_dark_html": "https://storage.googleapis.com/anyplot-images/plots/map-projections/javascript/echarts/plot-dark.html",
  "quality_score": 81.0,
  "license": "MIT",
  "guide": "https://anyplot.ai/llms.txt"
}
Part of World Map with Different Projections on anyplot.ai.