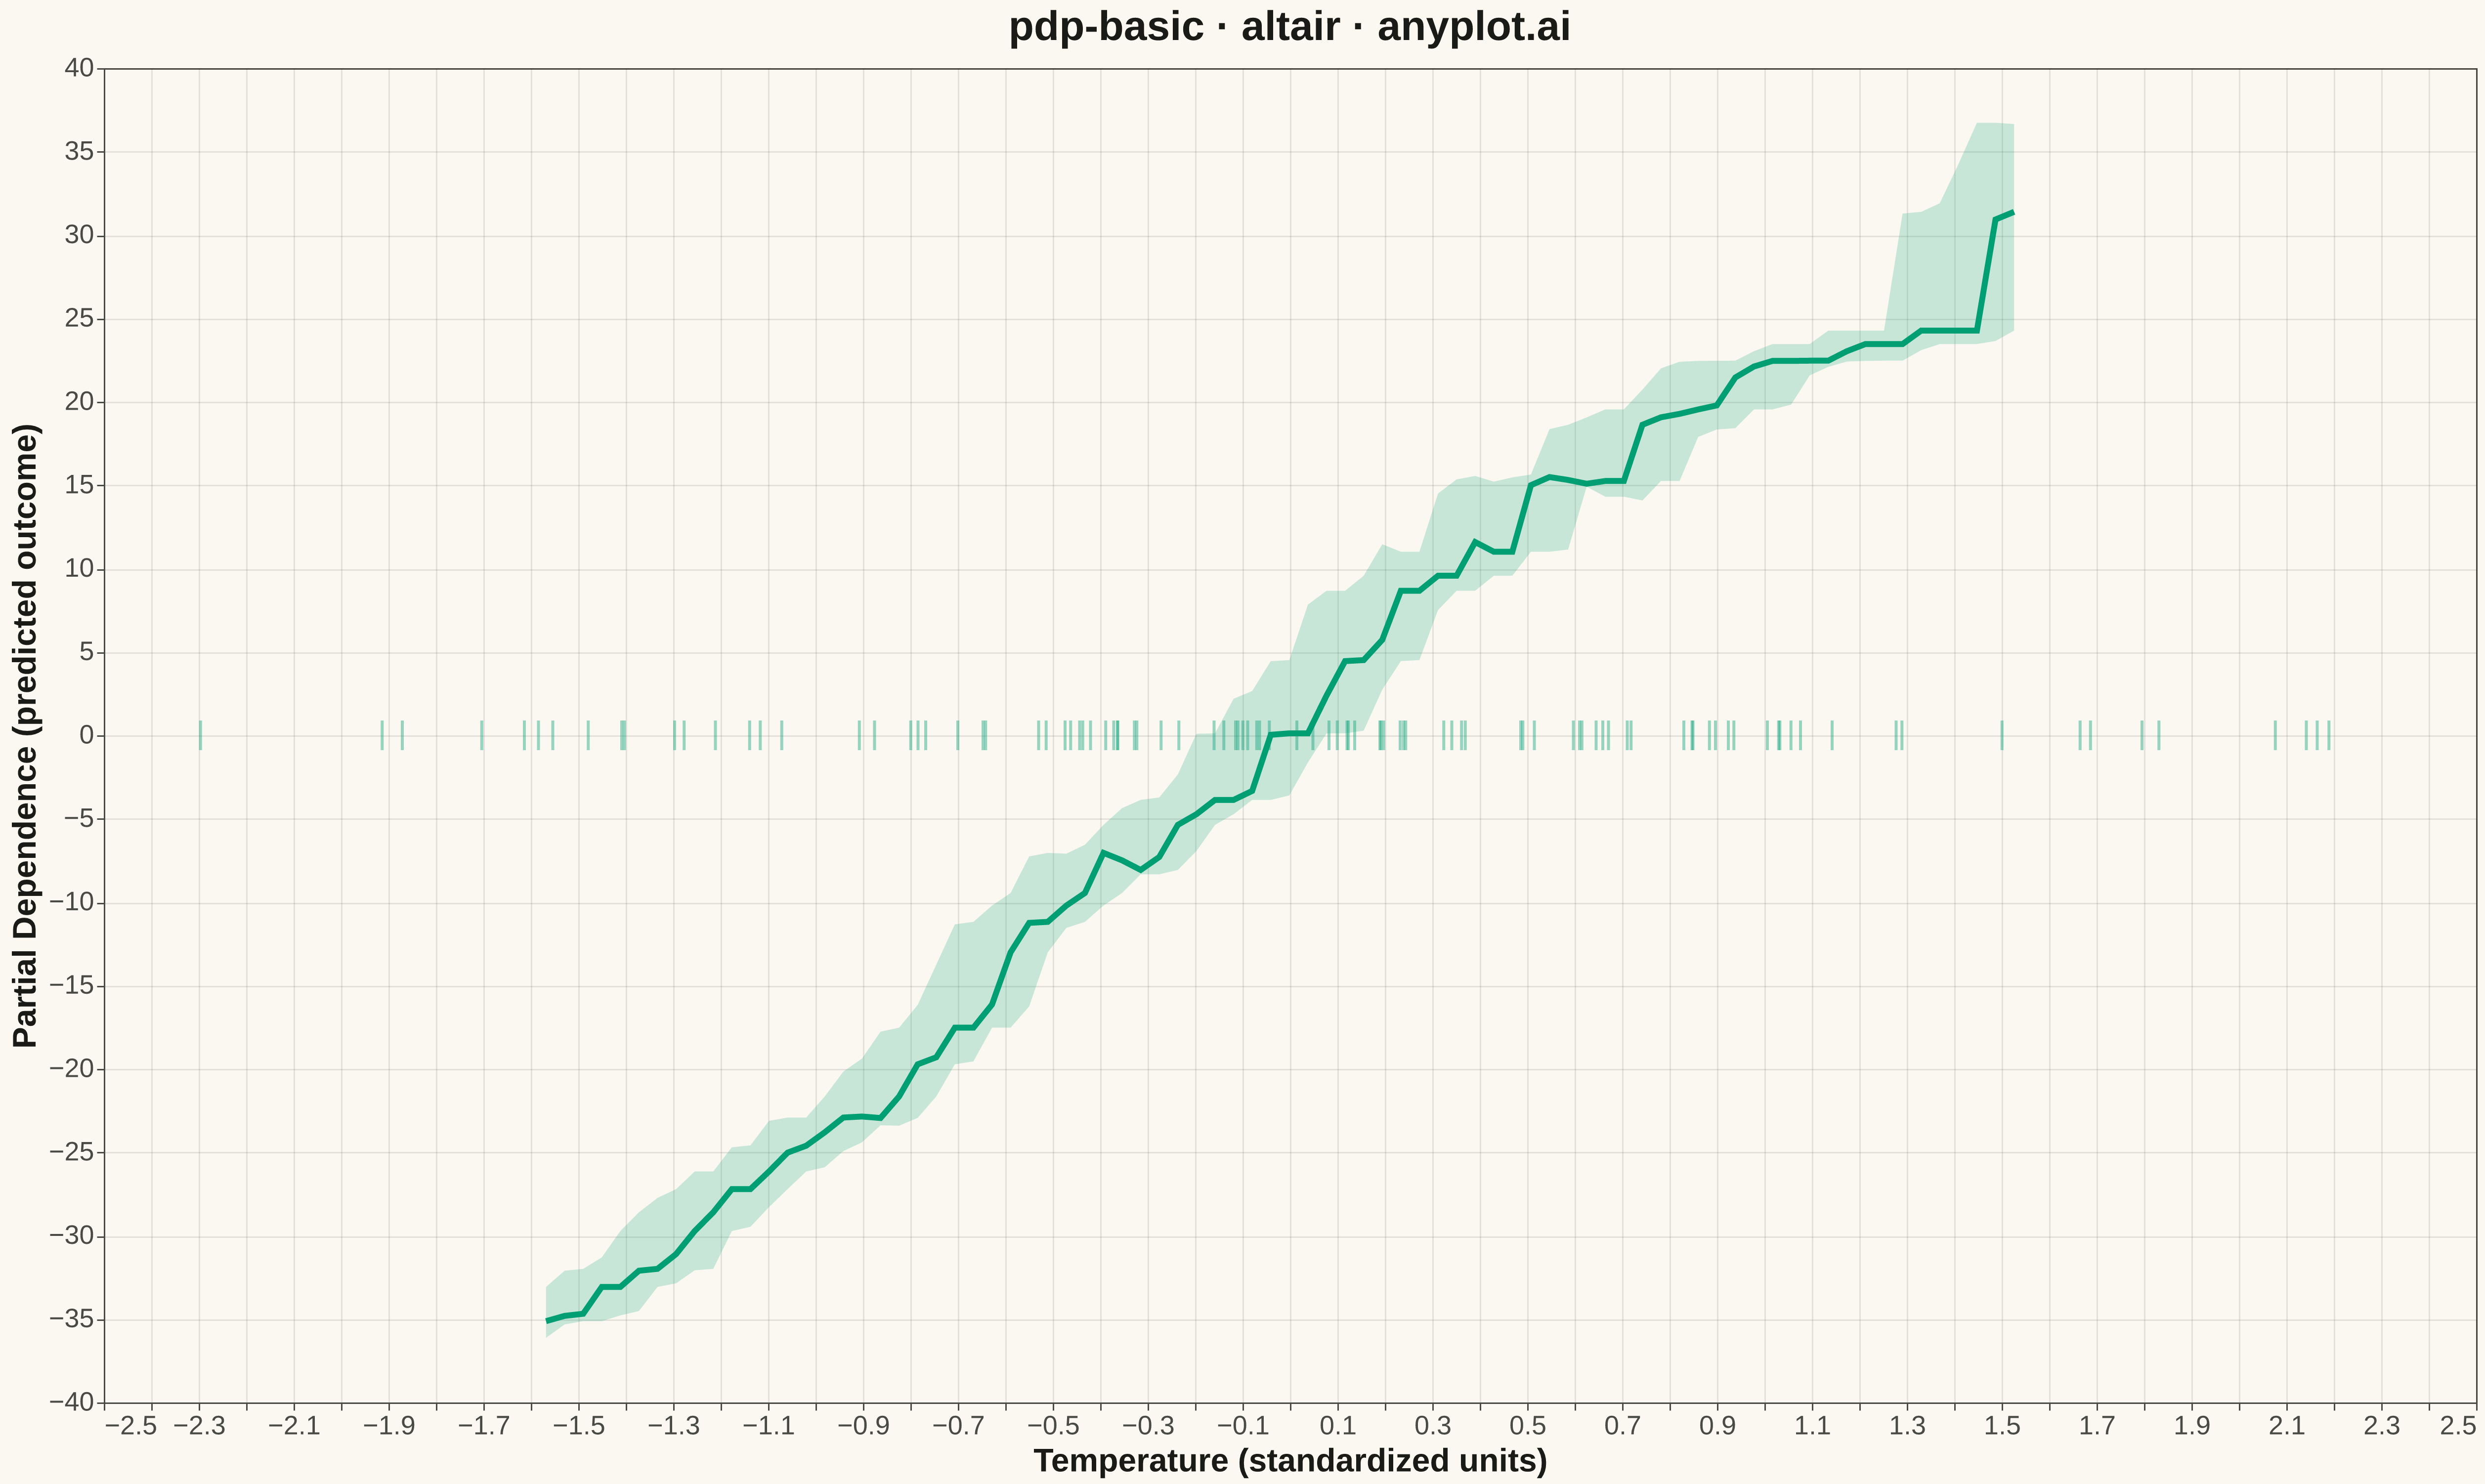
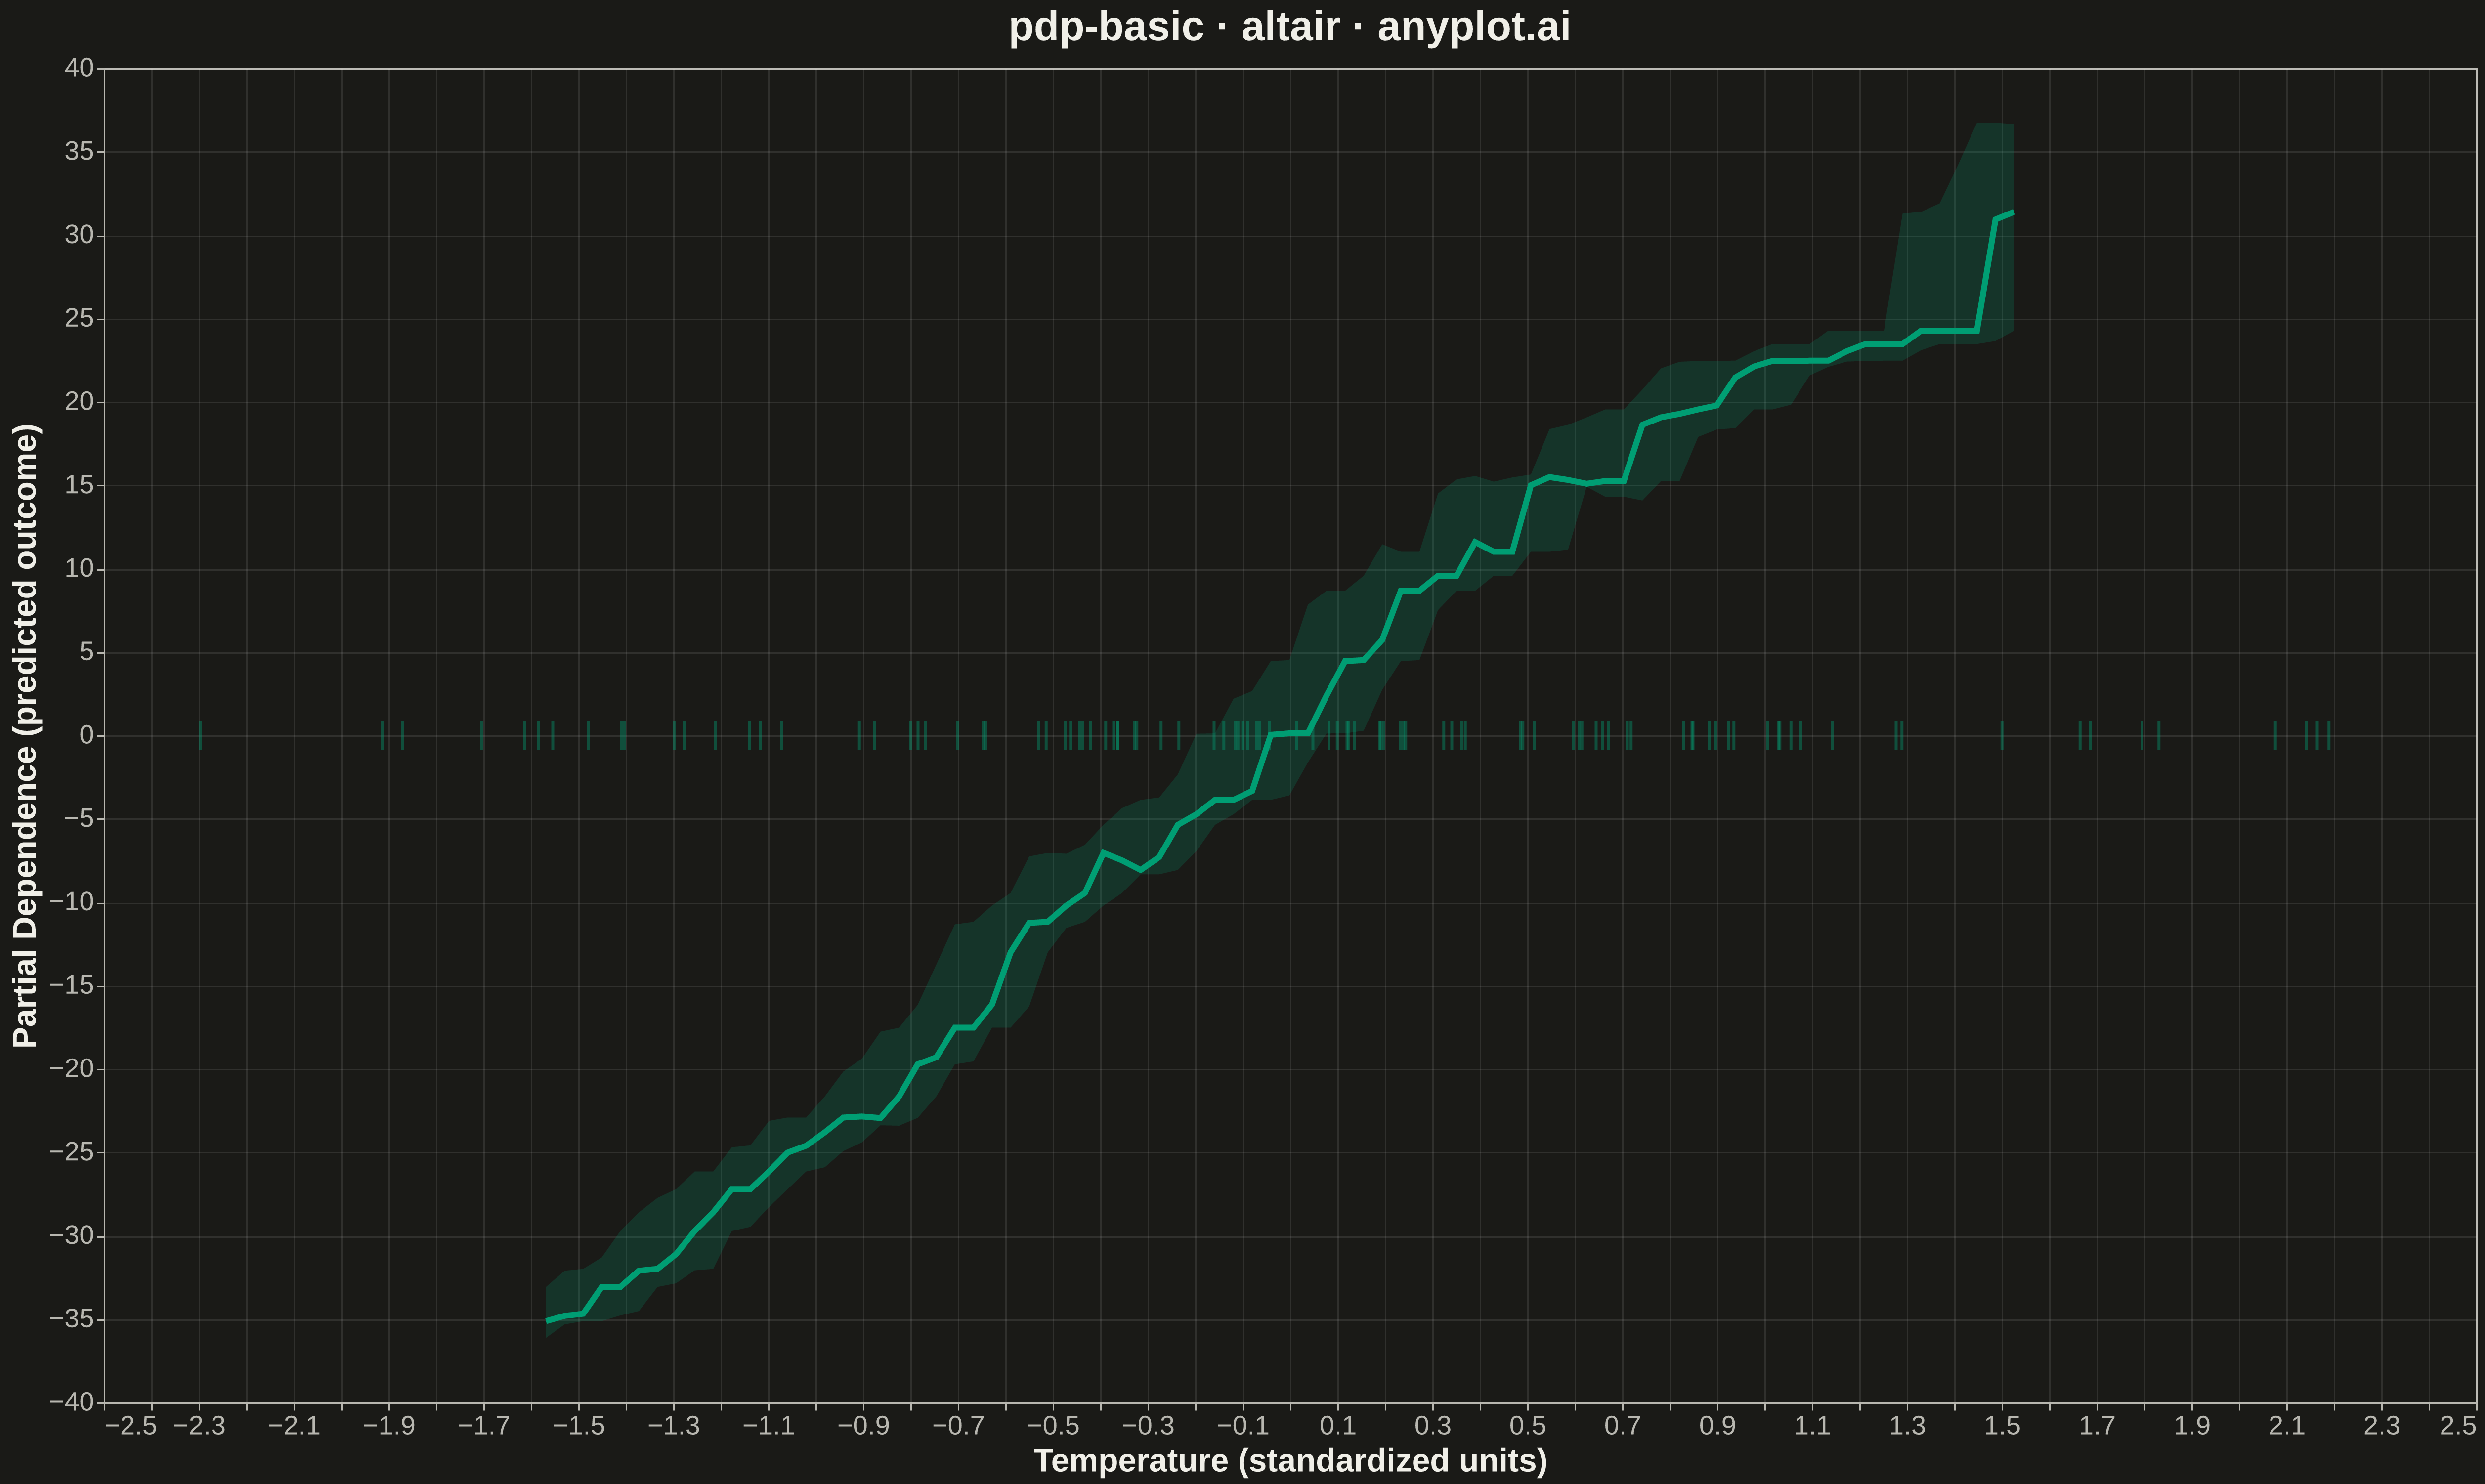
A partial dependence plot (PDP) showing the marginal effect of one feature on the predicted outcome of a machine learning model. The plot displays how predictions change as a feature varies across its range, while averaging over the effects of all other features. This visualization is essential for understanding the relationship between individual features and model predictions in interpretable machine learning.
Preview render from the Altair implementation.