The same plot in 14 other libraries — JavaScript: Chart.js, Apache ECharts, Highcharts, MUI X Charts; Python: Altair, Bokeh, lets-plot, Matplotlib, Plotly, plotnine, Pygal, Seaborn; R: ggplot2; Julia: Makie.jl. Compare all 15 side by side: Partial Dependence Plot in Python, R, Julia and JavaScript.
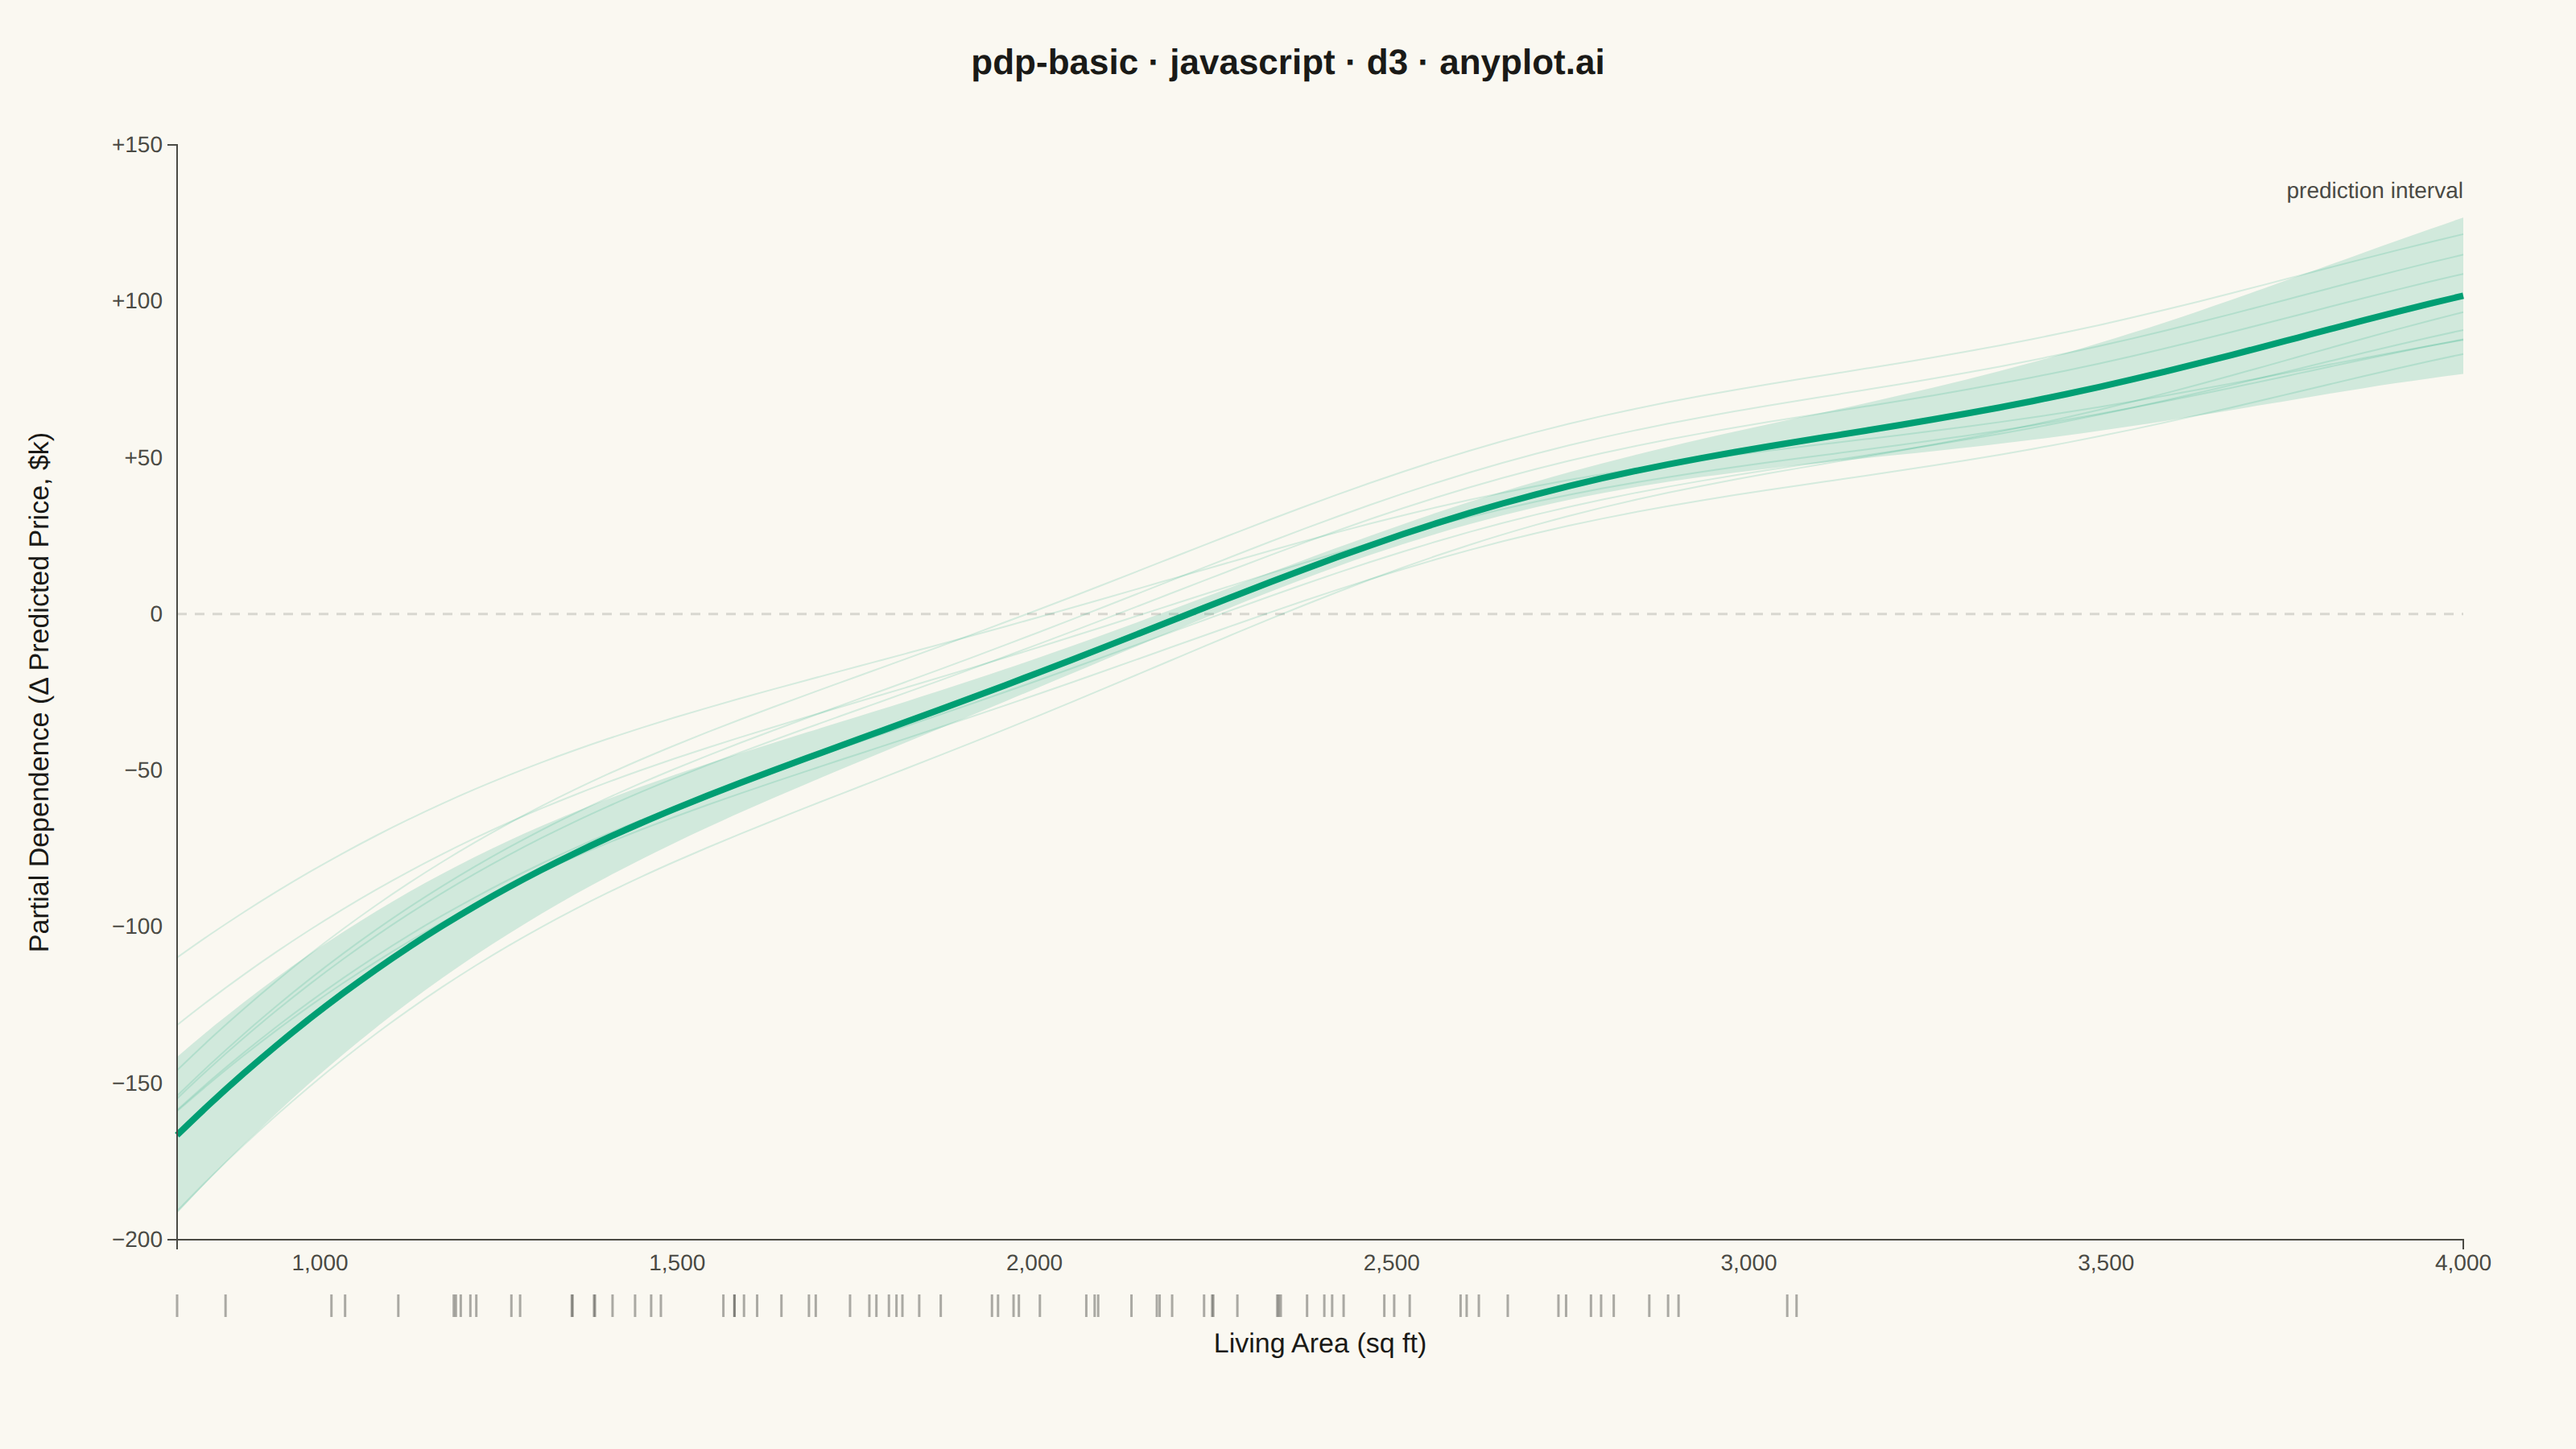
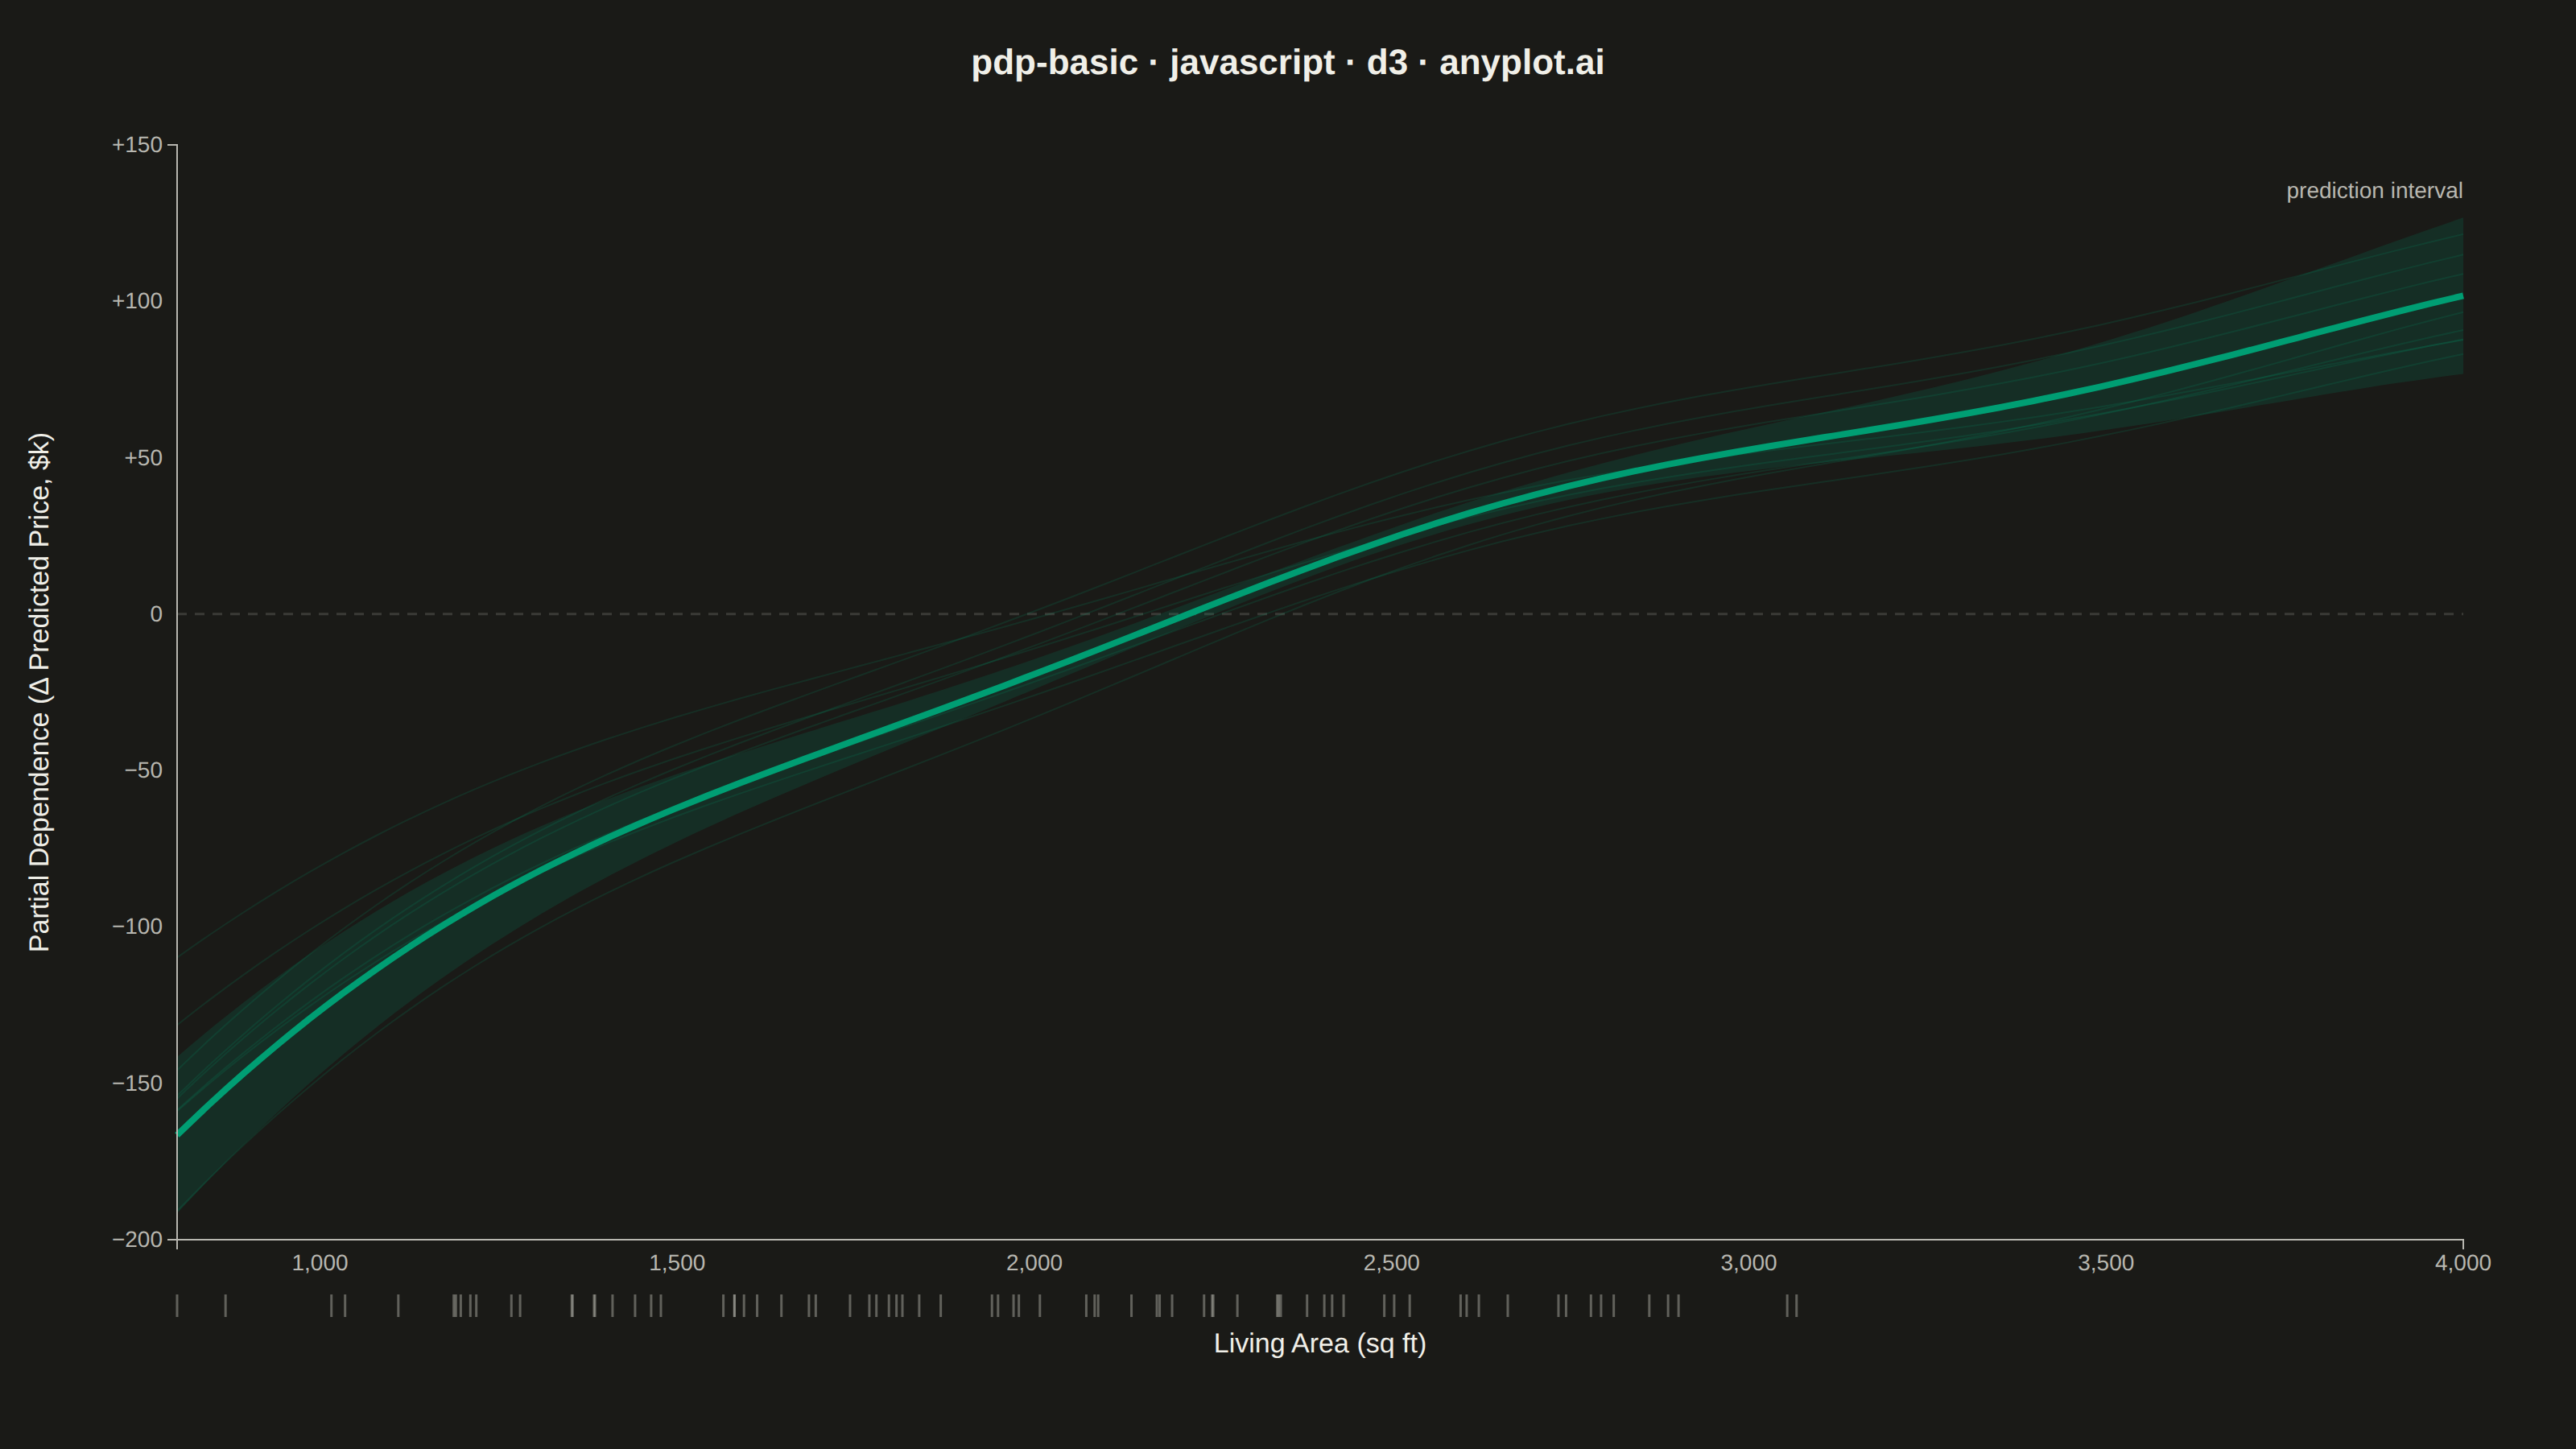
A partial dependence plot (PDP) showing the marginal effect of one feature on the predicted outcome of a machine learning model. The plot displays how predictions change as a feature varies across its range, while averaging over the effects of all other features. This visualization is essential for understanding the relationship between individual features and model predictions in interpretable machine learning.
// anyplot.ai
// pdp-basic: Partial Dependence Plot
// Library: d3 7.9.0 | JavaScript 22.23.2
// Quality: 95/100 | Created: 2026-09-05

const t = window.ANYPLOT_TOKENS;
const { width, height } = window.ANYPLOT_SIZE;
const margin = { top: 90, right: 70, bottom: 130, left: 110 };
const iw = width - margin.left - margin.right;
const ih = height - margin.top - margin.bottom;

// --- Deterministic PRNG (mulberry32, fixed seed) ----------------------------
function mulberry32(seed) {
  return function () {
    seed |= 0;
    seed = (seed + 0x6d2b79f5) | 0;
    let x = Math.imul(seed ^ (seed >>> 15), 1 | seed);
    x = (x + Math.imul(x ^ (x >>> 7), 61 | x)) ^ x;
    return ((x ^ (x >>> 14)) >>> 0) / 4294967296;
  };
}
function randNormal(rand) {
  const u1 = Math.max(rand(), 1e-9);
  const u2 = rand();
  return Math.sqrt(-2 * Math.log(u1)) * Math.cos(2 * Math.PI * u2);
}

// --- Data: PDP of house price on living area, from a gradient boosting model
const rand = mulberry32(42);
const xMin = 800;
const xMax = 4000;
const gridSize = 70;
const featureValues = d3.range(gridSize).map((i) => xMin + (i / (gridSize - 1)) * (xMax - xMin));

// Saturating price response with a mild boosting-style wiggle, then centered at zero.
const centerX = (xMin + xMax) / 2;
const halfRange = (xMax - xMin) / 2;
const rawDependence = featureValues.map(
  (x) => 165 * Math.log(x / xMin) + 4 * Math.sin((x - xMin) / 240)
);
const baseline = d3.mean(rawDependence);
const partialDependence = rawDependence.map((v) => v - baseline);

// Confidence band widens toward the sparser edges of the feature range.
const ciHalfWidth = featureValues.map(
  (x) => 3 + 22 * Math.pow(Math.abs(x - centerX) / halfRange, 1.8)
);
const ciLower = partialDependence.map((v, i) => v - ciHalfWidth[i]);
const ciUpper = partialDependence.map((v, i) => v + ciHalfWidth[i]);

// Rug: training sample of feature values (approx. normal, clipped to range).
const rugValues = d3.range(140).map(() => {
  const v = 1900 + 480 * randNormal(rand);
  return Math.max(xMin, Math.min(xMax, v));
});

// ICE (individual conditional expectation): a handful of per-sample curves
// with their own baseline offset and slope, sitting alongside the averaged PDP.
const iceCount = 8;
const iceLines = d3.range(iceCount).map(() => {
  const offset = 12 * randNormal(rand);
  const scale = 1 + 0.12 * randNormal(rand);
  return partialDependence.map((v) => v * scale + offset);
});

// --- Scales -------------------------------------------------------------
const x = d3.scaleLinear().domain([xMin, xMax]).range([0, iw]);
const iceExtent = iceLines.flat();
const y = d3
  .scaleLinear()
  .domain([d3.min([...ciLower, ...iceExtent]), d3.max([...ciUpper, ...iceExtent])])
  .nice()
  .range([ih, 0]);

// Thin the rug in dense regions so ticks read as texture, not a solid blob.
const rugBins = d3.bin().domain(x.domain()).thresholds(40)(rugValues);
const maxTicksPerBin = 4;
const thinnedRug = rugBins.flatMap((bin) =>
  bin.length <= maxTicksPerBin
    ? bin
    : d3.range(maxTicksPerBin).map((i) => bin[Math.floor((i * bin.length) / maxTicksPerBin)])
);

// --- SVG mount ------------------------------------------------------------
const svg = d3.select("#container").append("svg").attr("width", width).attr("height", height);
const g = svg.append("g").attr("transform", `translate(${margin.left},${margin.top})`);

// Zero reference line — the PDP is centered, so this marks "no effect vs. average".
g.append("line")
  .attr("x1", 0)
  .attr("x2", iw)
  .attr("y1", y(0))
  .attr("y2", y(0))
  .attr("stroke", t.grid)
  .attr("stroke-width", 1.5)
  .attr("stroke-dasharray", "6,5");

// Confidence band
const area = d3
  .area()
  .x((d, i) => x(featureValues[i]))
  .y0((d, i) => y(ciLower[i]))
  .y1((d, i) => y(ciUpper[i]))
  .curve(d3.curveMonotoneX);
g.append("path").datum(featureValues).attr("d", area).attr("fill", t.palette[0]).attr("fill-opacity", 0.16);

// ICE lines — faint per-sample curves drawn beneath the averaged PDP curve
const iceLine = d3
  .line()
  .x((d, i) => x(featureValues[i]))
  .y((d) => y(d))
  .curve(d3.curveMonotoneX);
g.selectAll(".ice")
  .data(iceLines)
  .join("path")
  .attr("class", "ice")
  .attr("d", iceLine)
  .attr("fill", "none")
  .attr("stroke", t.palette[0])
  .attr("stroke-opacity", 0.15)
  .attr("stroke-width", 1);

// Partial dependence curve
const line = d3
  .line()
  .x((d, i) => x(featureValues[i]))
  .y((d, i) => y(partialDependence[i]))
  .curve(d3.curveMonotoneX);
g.append("path")
  .datum(featureValues)
  .attr("d", line)
  .attr("fill", "none")
  .attr("stroke", t.palette[0])
  .attr("stroke-width", 4);

// Rug plot — distribution of observed feature values along the x-axis
g.selectAll(".rug")
  .data(thinnedRug)
  .join("line")
  .attr("class", "rug")
  .attr("x1", (d) => x(d))
  .attr("x2", (d) => x(d))
  .attr("y1", ih + 34)
  .attr("y2", ih + 48)
  .attr("stroke", t.inkSoft)
  .attr("stroke-opacity", 0.45)
  .attr("stroke-width", 1.5);

// Direct label for the shaded band (single series → no legend needed)
g.append("text")
  .attr("x", iw)
  .attr("y", y(ciUpper[ciUpper.length - 1]) - 12)
  .attr("text-anchor", "end")
  .attr("fill", t.inkSoft)
  .style("font-size", "14px")
  .text("prediction interval");

// --- Axes -----------------------------------------------------------------
const xAxis = g
  .append("g")
  .attr("transform", `translate(0,${ih})`)
  .call(d3.axisBottom(x).ticks(6).tickFormat(d3.format(",")));
const yAxis = g.append("g").call(
  d3
    .axisLeft(y)
    .ticks(6)
    .tickFormat((d) => (d > 0 ? "+" : "") + d3.format(",")(d))
);
for (const axis of [xAxis, yAxis]) {
  axis.selectAll("text").attr("fill", t.inkSoft).style("font-size", "14px");
  axis.selectAll("line").attr("stroke", t.grid);
  axis.select(".domain").attr("stroke", t.inkSoft);
}
xAxis.selectAll(".tick line").attr("y2", 0);
yAxis.selectAll(".tick line").attr("x2", 0);

// --- Axis labels ------------------------------------------------------------
g.append("text")
  .attr("x", iw / 2)
  .attr("y", ih + 70)
  .attr("text-anchor", "middle")
  .attr("fill", t.ink)
  .style("font-size", "17px")
  .text("Living Area (sq ft)");

g.append("text")
  .attr("transform", "rotate(-90)")
  .attr("x", -ih / 2)
  .attr("y", -80)
  .attr("text-anchor", "middle")
  .attr("fill", t.ink)
  .style("font-size", "17px")
  .text("Partial Dependence (Δ Predicted Price, $k)");

// --- Title ------------------------------------------------------------------
svg
  .append("text")
  .attr("x", width / 2)
  .attr("y", 46)
  .attr("text-anchor", "middle")
  .attr("fill", t.ink)
  .style("font-size", "22px")
  .style("font-weight", "600")
  .text("pdp-basic · javascript · d3 · anyplot.ai");
Runnable source as JSON, for any HTTP client: https://api.anyplot.ai/specs/pdp-basic/d3/code. Any spec id and library id listed in llms-full.txt fit the same URL shape; every URL below is complete and callable.
{
  "spec_id": "pdp-basic",
  "language": "javascript",
  "library": "d3",
  "page": "https://anyplot.ai/pdp-basic/javascript/d3",
  "hub": "https://anyplot.ai/pdp-basic",
  "code_json": "https://api.anyplot.ai/specs/pdp-basic/d3/code",
  "spec_json": "https://api.anyplot.ai/specs/pdp-basic",
  "render_light_png": "https://storage.googleapis.com/anyplot-images/plots/pdp-basic/javascript/d3/plot-light.png",
  "render_dark_png": "https://storage.googleapis.com/anyplot-images/plots/pdp-basic/javascript/d3/plot-dark.png",
  "interactive_light_html": "https://storage.googleapis.com/anyplot-images/plots/pdp-basic/javascript/d3/plot-light.html",
  "interactive_dark_html": "https://storage.googleapis.com/anyplot-images/plots/pdp-basic/javascript/d3/plot-dark.html",
  "quality_score": 95.0,
  "license": "MIT",
  "guide": "https://anyplot.ai/llms.txt"
}
Part of Partial Dependence Plot on anyplot.ai.