The same plot in 14 other libraries — JavaScript: Chart.js, D3.js, Apache ECharts, MUI X Charts; Python: Altair, Bokeh, lets-plot, Matplotlib, Plotly, plotnine, Pygal, Seaborn; R: ggplot2; Julia: Makie.jl. Compare all 15 side by side: Partial Dependence Plot in Python, R, Julia and JavaScript.
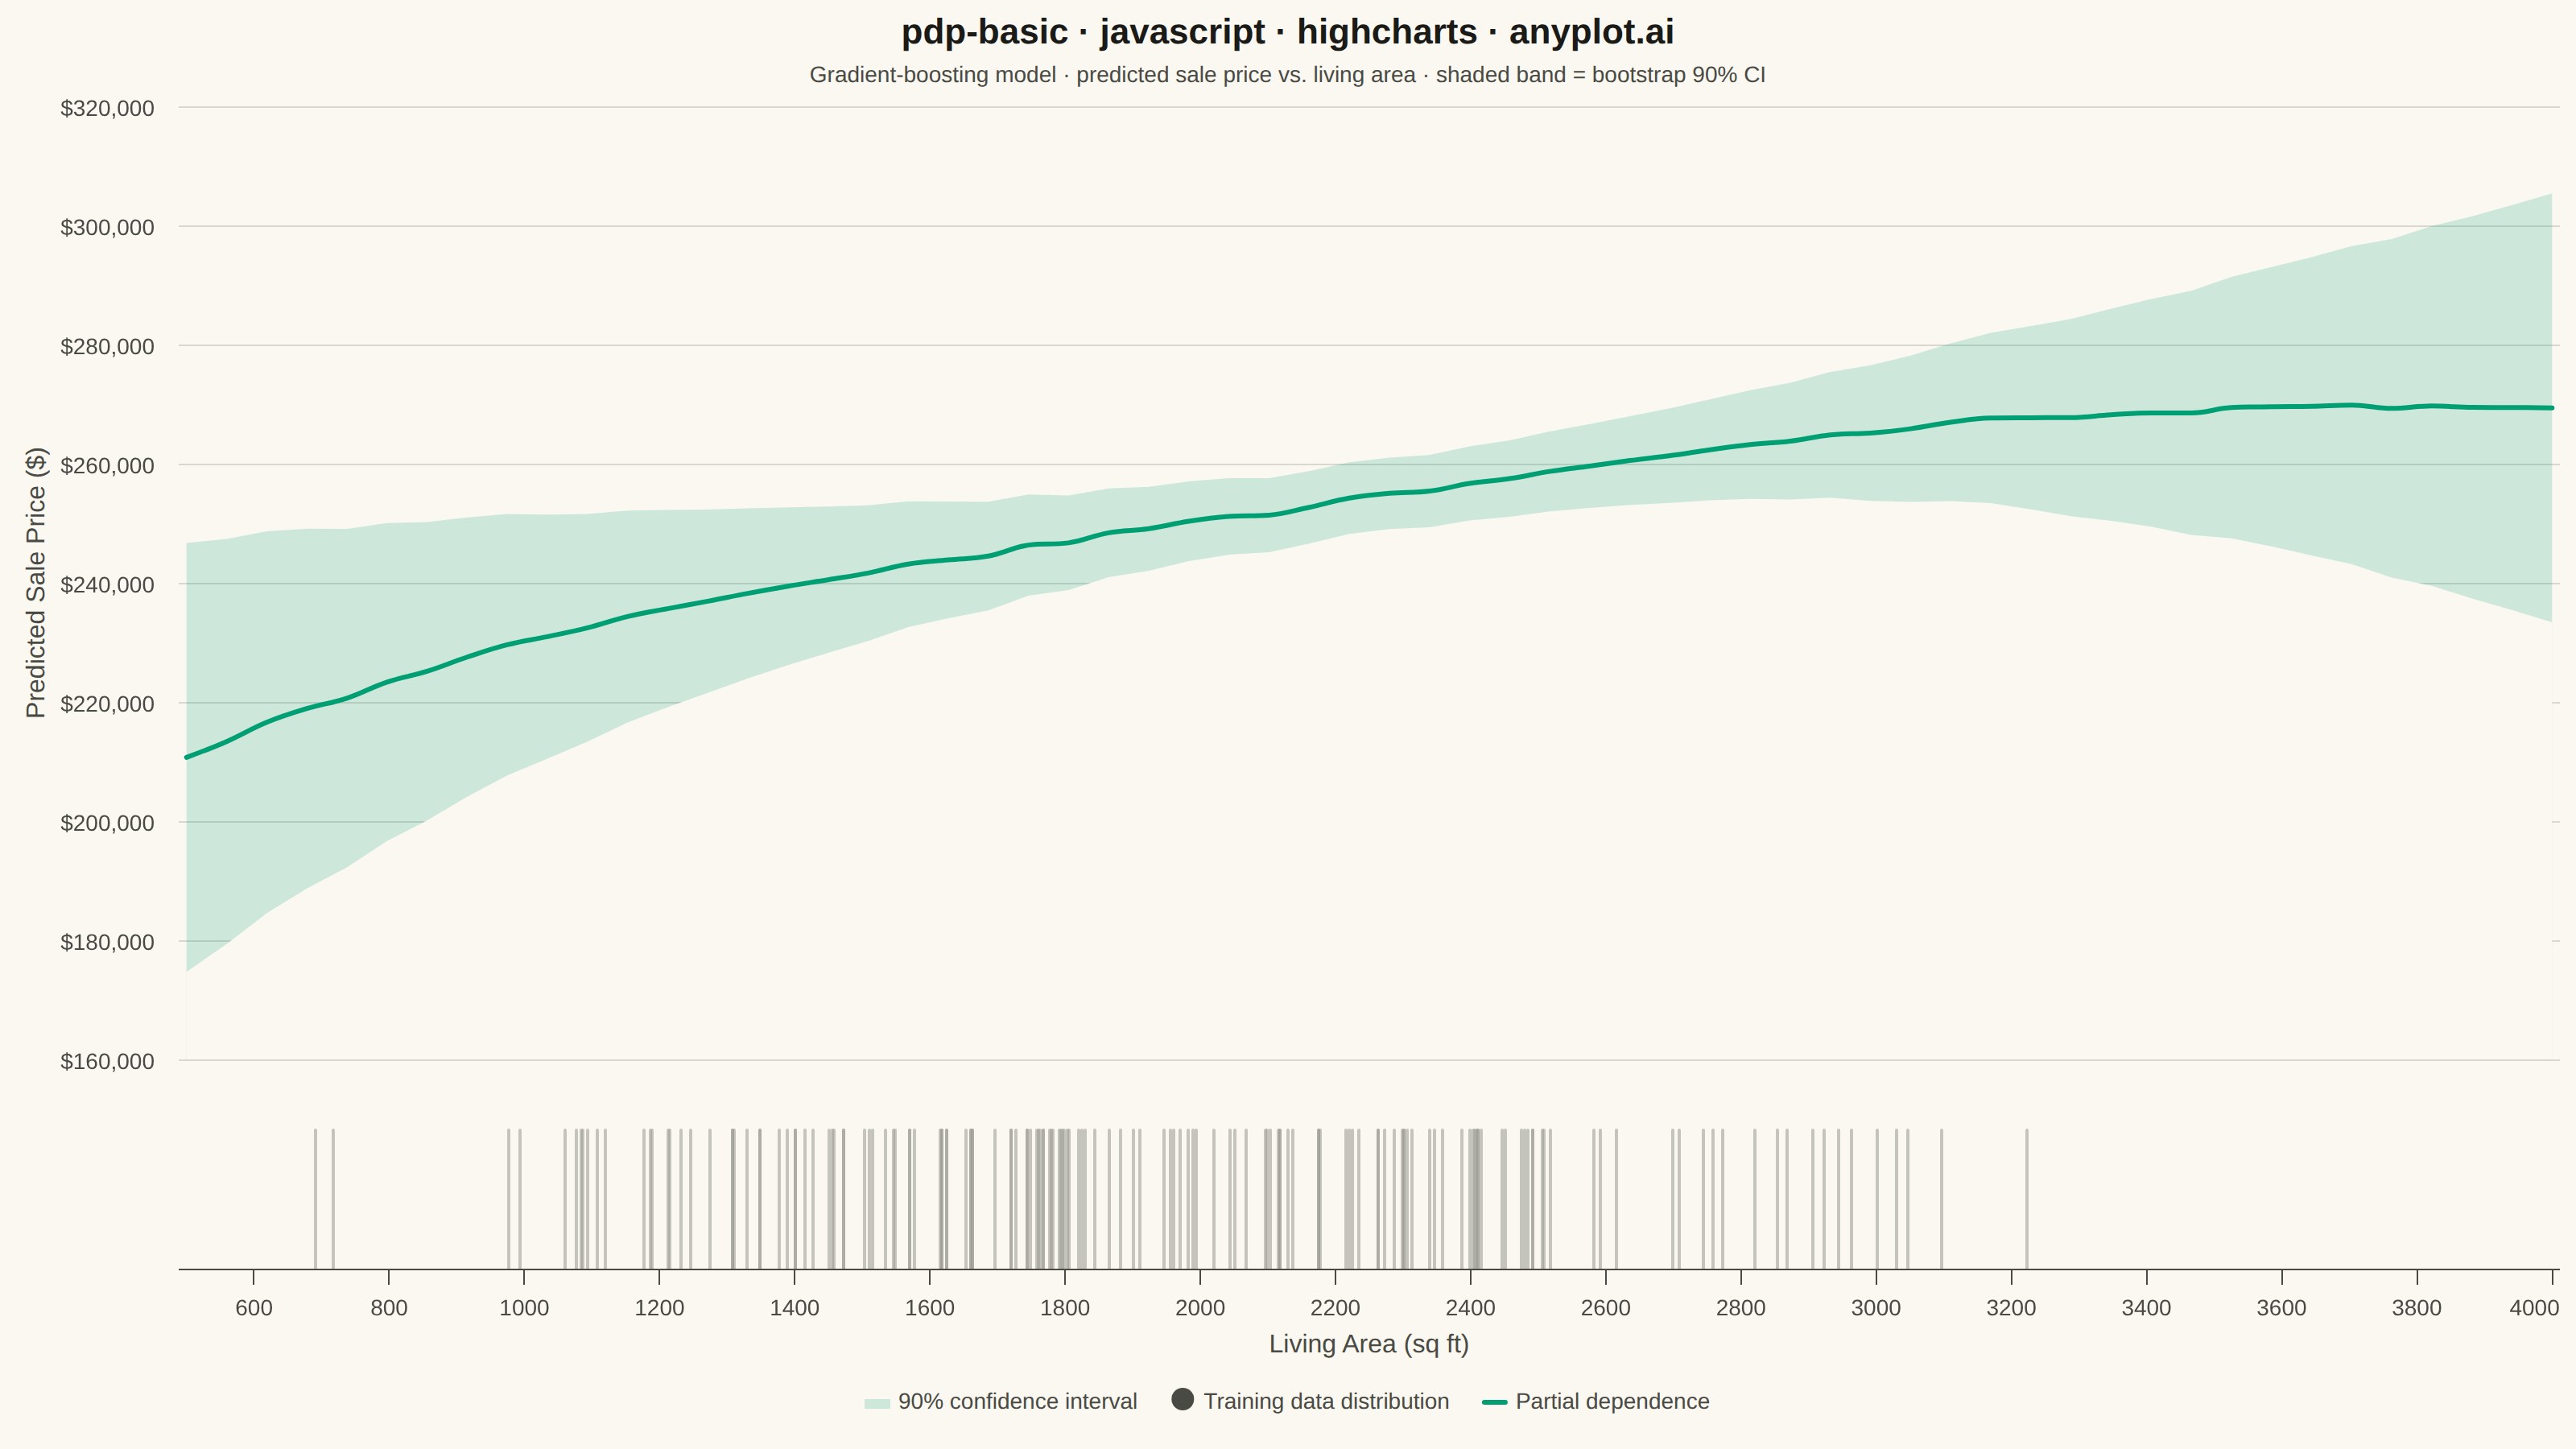
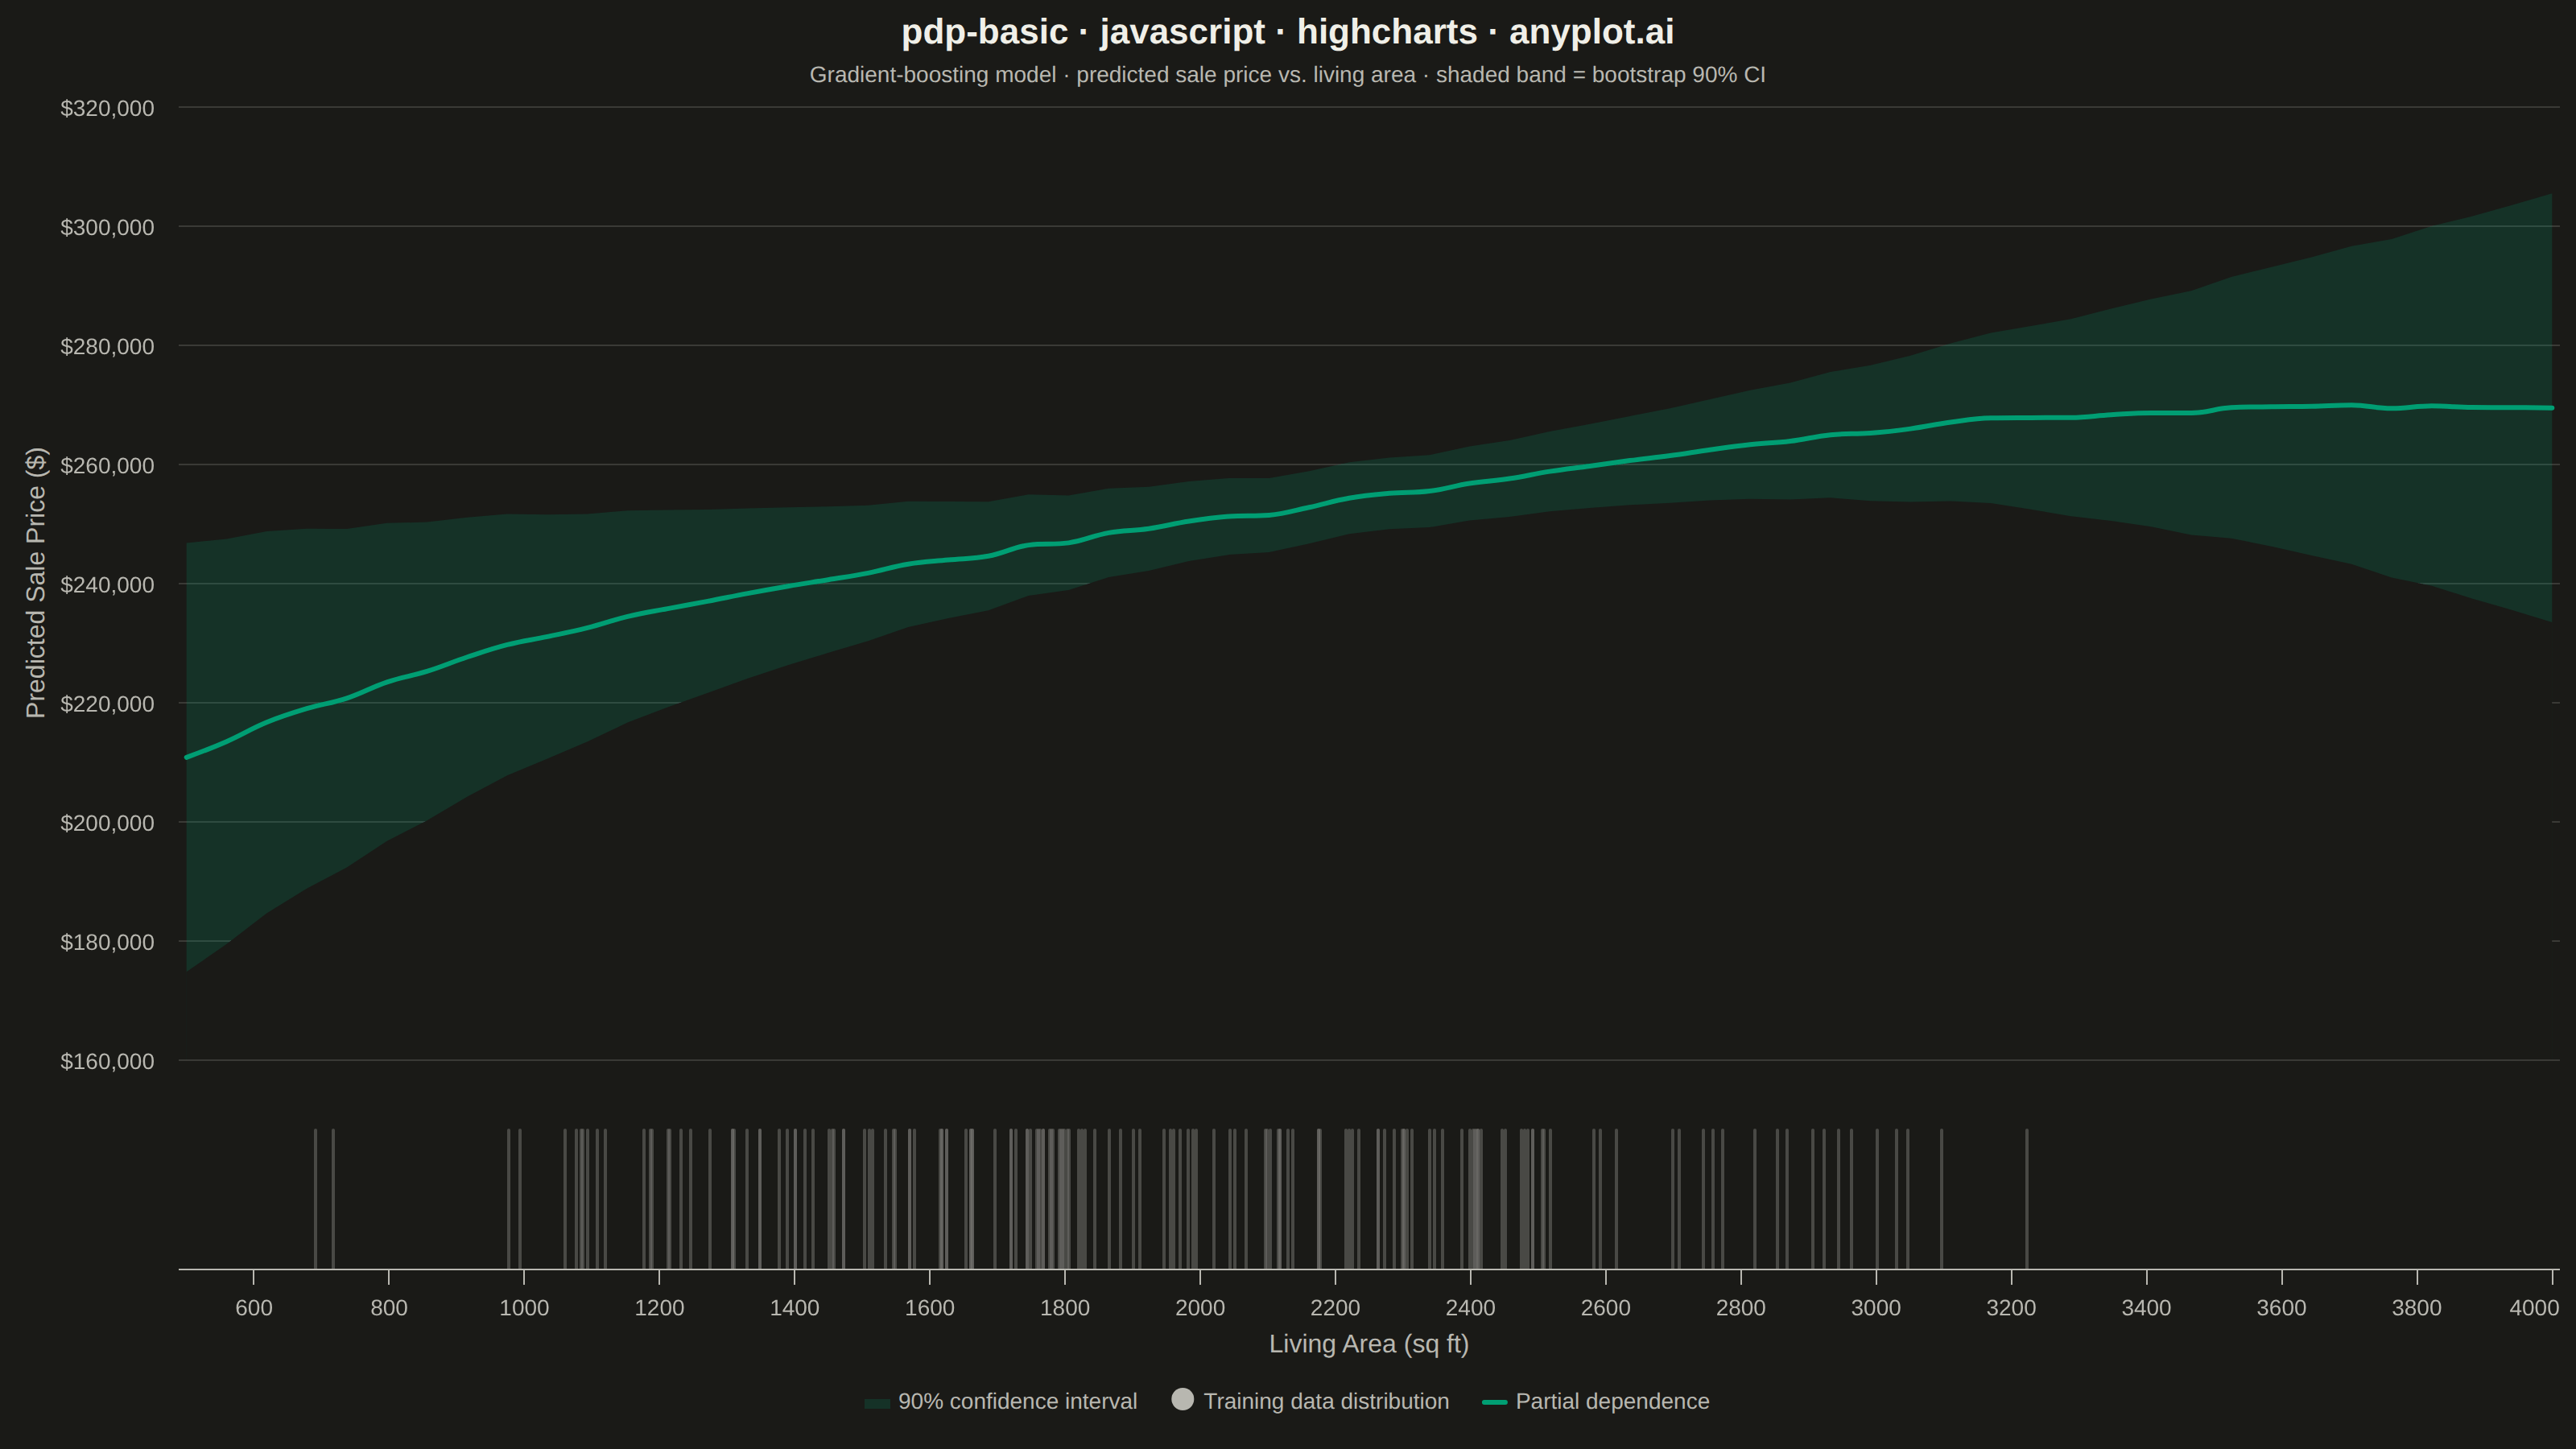
A partial dependence plot (PDP) showing the marginal effect of one feature on the predicted outcome of a machine learning model. The plot displays how predictions change as a feature varies across its range, while averaging over the effects of all other features. This visualization is essential for understanding the relationship between individual features and model predictions in interpretable machine learning.
// anyplot.ai
// pdp-basic: Partial Dependence Plot
// Library: highcharts 12.6.0 | JavaScript 22.23.2
// Quality: 93/100 | Created: 2026-09-05

const t = window.ANYPLOT_TOKENS;
const BRAND = t.palette[0]; // "#009E73" — always first series

// --- Deterministic PRNG (mulberry32) ----------------------------------------
function mulberry32(seed) {
  return function next() {
    seed |= 0;
    seed = (seed + 0x6d2b79f5) | 0;
    let x = Math.imul(seed ^ (seed >>> 15), 1 | seed);
    x = (x + Math.imul(x ^ (x >>> 7), 61 | x)) ^ x;
    return ((x ^ (x >>> 14)) >>> 0) / 4294967296;
  };
}
const rand = mulberry32(42);

// --- Data --------------------------------------------------------------------
// Partial dependence of a gradient-boosting model's predicted sale price on
// living area, averaged over all other features. The effect saturates once
// extra square footage stops moving the prediction (diminishing returns).
const GRID_POINTS = 60;
const AREA_MIN = 500;
const AREA_MAX = 4000;
const livingAreaGrid = Array.from(
  { length: GRID_POINTS },
  (_, i) => AREA_MIN + (i * (AREA_MAX - AREA_MIN)) / (GRID_POINTS - 1),
);

const midArea = (AREA_MIN + AREA_MAX) / 2;
const halfRange = (AREA_MAX - AREA_MIN) / 2;

const partialDependence = livingAreaGrid.map((area) => {
  const saturating = 180000 + 95000 * (1 - Math.exp(-area / 1400));
  const wiggle = 2200 * Math.sin(area / 420) * (rand() * 0.6 + 0.7);
  return saturating + wiggle;
});

// Bootstrap-style uncertainty: widest at the sparse edges of the feature range.
const ciHalfWidth = livingAreaGrid.map((area) => {
  const edgeFactor = Math.pow((area - midArea) / halfRange, 2);
  return 6000 + 30000 * edgeFactor;
});
const ciUpper = partialDependence.map((y, i) => [livingAreaGrid[i], y + ciHalfWidth[i]]);
const ciLower = partialDependence.map((y, i) => [livingAreaGrid[i], y - ciHalfWidth[i]]);
const pdpLine = partialDependence.map((y, i) => [livingAreaGrid[i], y]);

// Fill anchor safely below every band value so the two area fills only ever
// meet each other, never the plot's visible floor.
const bandFloor = Math.min(...ciLower.map((p) => p[1])) - 40000;

// Pin the axis to the real data range — Highcharts otherwise pulls the
// autorange down toward the (invisible) fill threshold above, leaving a
// large dead zone between the band and the rug plot.
const yMin = Math.floor((Math.min(...ciLower.map((p) => p[1])) - 5000) / 10000) * 10000;
const yMax = Math.ceil((Math.max(...ciUpper.map((p) => p[1])) + 5000) / 10000) * 10000;

// Rug plot: the training data's feature distribution (approx. normal, clipped
// to the observed range) via Box-Muller on the same seeded PRNG.
const RUG_SAMPLES = 160;
const trainingAreaSamples = [];
while (trainingAreaSamples.length < RUG_SAMPLES) {
  const u1 = rand();
  const u2 = rand();
  const z = Math.sqrt(-2 * Math.log(u1)) * Math.cos(2 * Math.PI * u2);
  const sample = 1900 + z * 550;
  if (sample >= AREA_MIN && sample <= AREA_MAX) {
    trainingAreaSamples.push([sample, 1]);
  }
}

// --- Chart -------------------------------------------------------------------
Highcharts.chart("container", {
  chart: {
    type: "spline",
    backgroundColor: "transparent",
    animation: false,
    style: { fontFamily: "inherit" },
  },
  credits: { enabled: false },
  colors: t.palette,
  title: {
    text: "pdp-basic · javascript · highcharts · anyplot.ai",
    style: { color: t.ink, fontSize: "22px", fontWeight: "600" },
  },
  subtitle: {
    text: "Gradient-boosting model · predicted sale price vs. living area · shaded band = bootstrap 90% CI",
    style: { color: t.inkSoft, fontSize: "14px" },
  },
  xAxis: {
    title: { text: "Living Area (sq ft)", style: { color: t.inkSoft, fontSize: "16px" } },
    lineColor: t.inkSoft,
    tickColor: t.inkSoft,
    gridLineWidth: 0,
    labels: { style: { color: t.inkSoft, fontSize: "14px" } },
    min: AREA_MIN,
    max: AREA_MAX,
  },
  yAxis: [
    {
      top: "0%",
      height: "82%",
      title: {
        text: "Predicted Sale Price ($)",
        style: { color: t.inkSoft, fontSize: "16px" },
      },
      lineColor: t.inkSoft,
      tickColor: t.inkSoft,
      gridLineColor: t.grid,
      labels: {
        style: { color: t.inkSoft, fontSize: "14px" },
        format: "${value:,.0f}",
      },
      min: yMin,
      max: yMax,
    },
    {
      top: "88%",
      height: "12%",
      min: 0,
      max: 1,
      visible: false,
    },
  ],
  legend: {
    itemStyle: { color: t.inkSoft, fontSize: "14px" },
    itemHoverStyle: { color: t.ink },
  },
  plotOptions: {
    series: { animation: false },
  },
  tooltip: { enabled: false },
  series: [
    {
      type: "area",
      name: "90% confidence interval",
      data: ciUpper,
      threshold: bandFloor,
      lineWidth: 0,
      fillColor: Highcharts.color(BRAND).setOpacity(0.18).get(),
      marker: { enabled: false },
      enableMouseTracking: false,
    },
    {
      type: "area",
      name: "ci-erase",
      data: ciLower,
      threshold: bandFloor,
      lineWidth: 0,
      fillColor: t.pageBg,
      marker: { enabled: false },
      enableMouseTracking: false,
      showInLegend: false,
    },
    {
      type: "column",
      name: "Training data distribution",
      yAxis: 1,
      data: trainingAreaSamples,
      color: t.inkSoft,
      opacity: 0.55,
      pointWidth: 2,
      borderWidth: 0,
      groupPadding: 0,
      pointPadding: 0,
      enableMouseTracking: false,
    },
    {
      type: "spline",
      name: "Partial dependence",
      data: pdpLine,
      color: BRAND,
      lineWidth: 3,
      marker: { enabled: false },
    },
  ],
});
Runnable source as JSON, for any HTTP client: https://api.anyplot.ai/specs/pdp-basic/highcharts/code. Any spec id and library id listed in llms-full.txt fit the same URL shape; every URL below is complete and callable.
{
  "spec_id": "pdp-basic",
  "language": "javascript",
  "library": "highcharts",
  "page": "https://anyplot.ai/pdp-basic/javascript/highcharts",
  "hub": "https://anyplot.ai/pdp-basic",
  "code_json": "https://api.anyplot.ai/specs/pdp-basic/highcharts/code",
  "spec_json": "https://api.anyplot.ai/specs/pdp-basic",
  "render_light_png": "https://storage.googleapis.com/anyplot-images/plots/pdp-basic/javascript/highcharts/plot-light.png",
  "render_dark_png": "https://storage.googleapis.com/anyplot-images/plots/pdp-basic/javascript/highcharts/plot-dark.png",
  "interactive_light_html": "https://storage.googleapis.com/anyplot-images/plots/pdp-basic/javascript/highcharts/plot-light.html",
  "interactive_dark_html": "https://storage.googleapis.com/anyplot-images/plots/pdp-basic/javascript/highcharts/plot-dark.html",
  "quality_score": 93.0,
  "license": "MIT",
  "guide": "https://anyplot.ai/llms.txt"
}
Part of Partial Dependence Plot on anyplot.ai.