The same plot in 14 other libraries — Python: Altair, Bokeh, lets-plot, Matplotlib, Plotly, plotnine, Pygal, Seaborn; R: ggplot2; JavaScript: Chart.js, D3.js, Apache ECharts, Highcharts, MUI X Charts. Compare all 15 side by side: Partial Dependence Plot in Python, R, Julia and JavaScript.
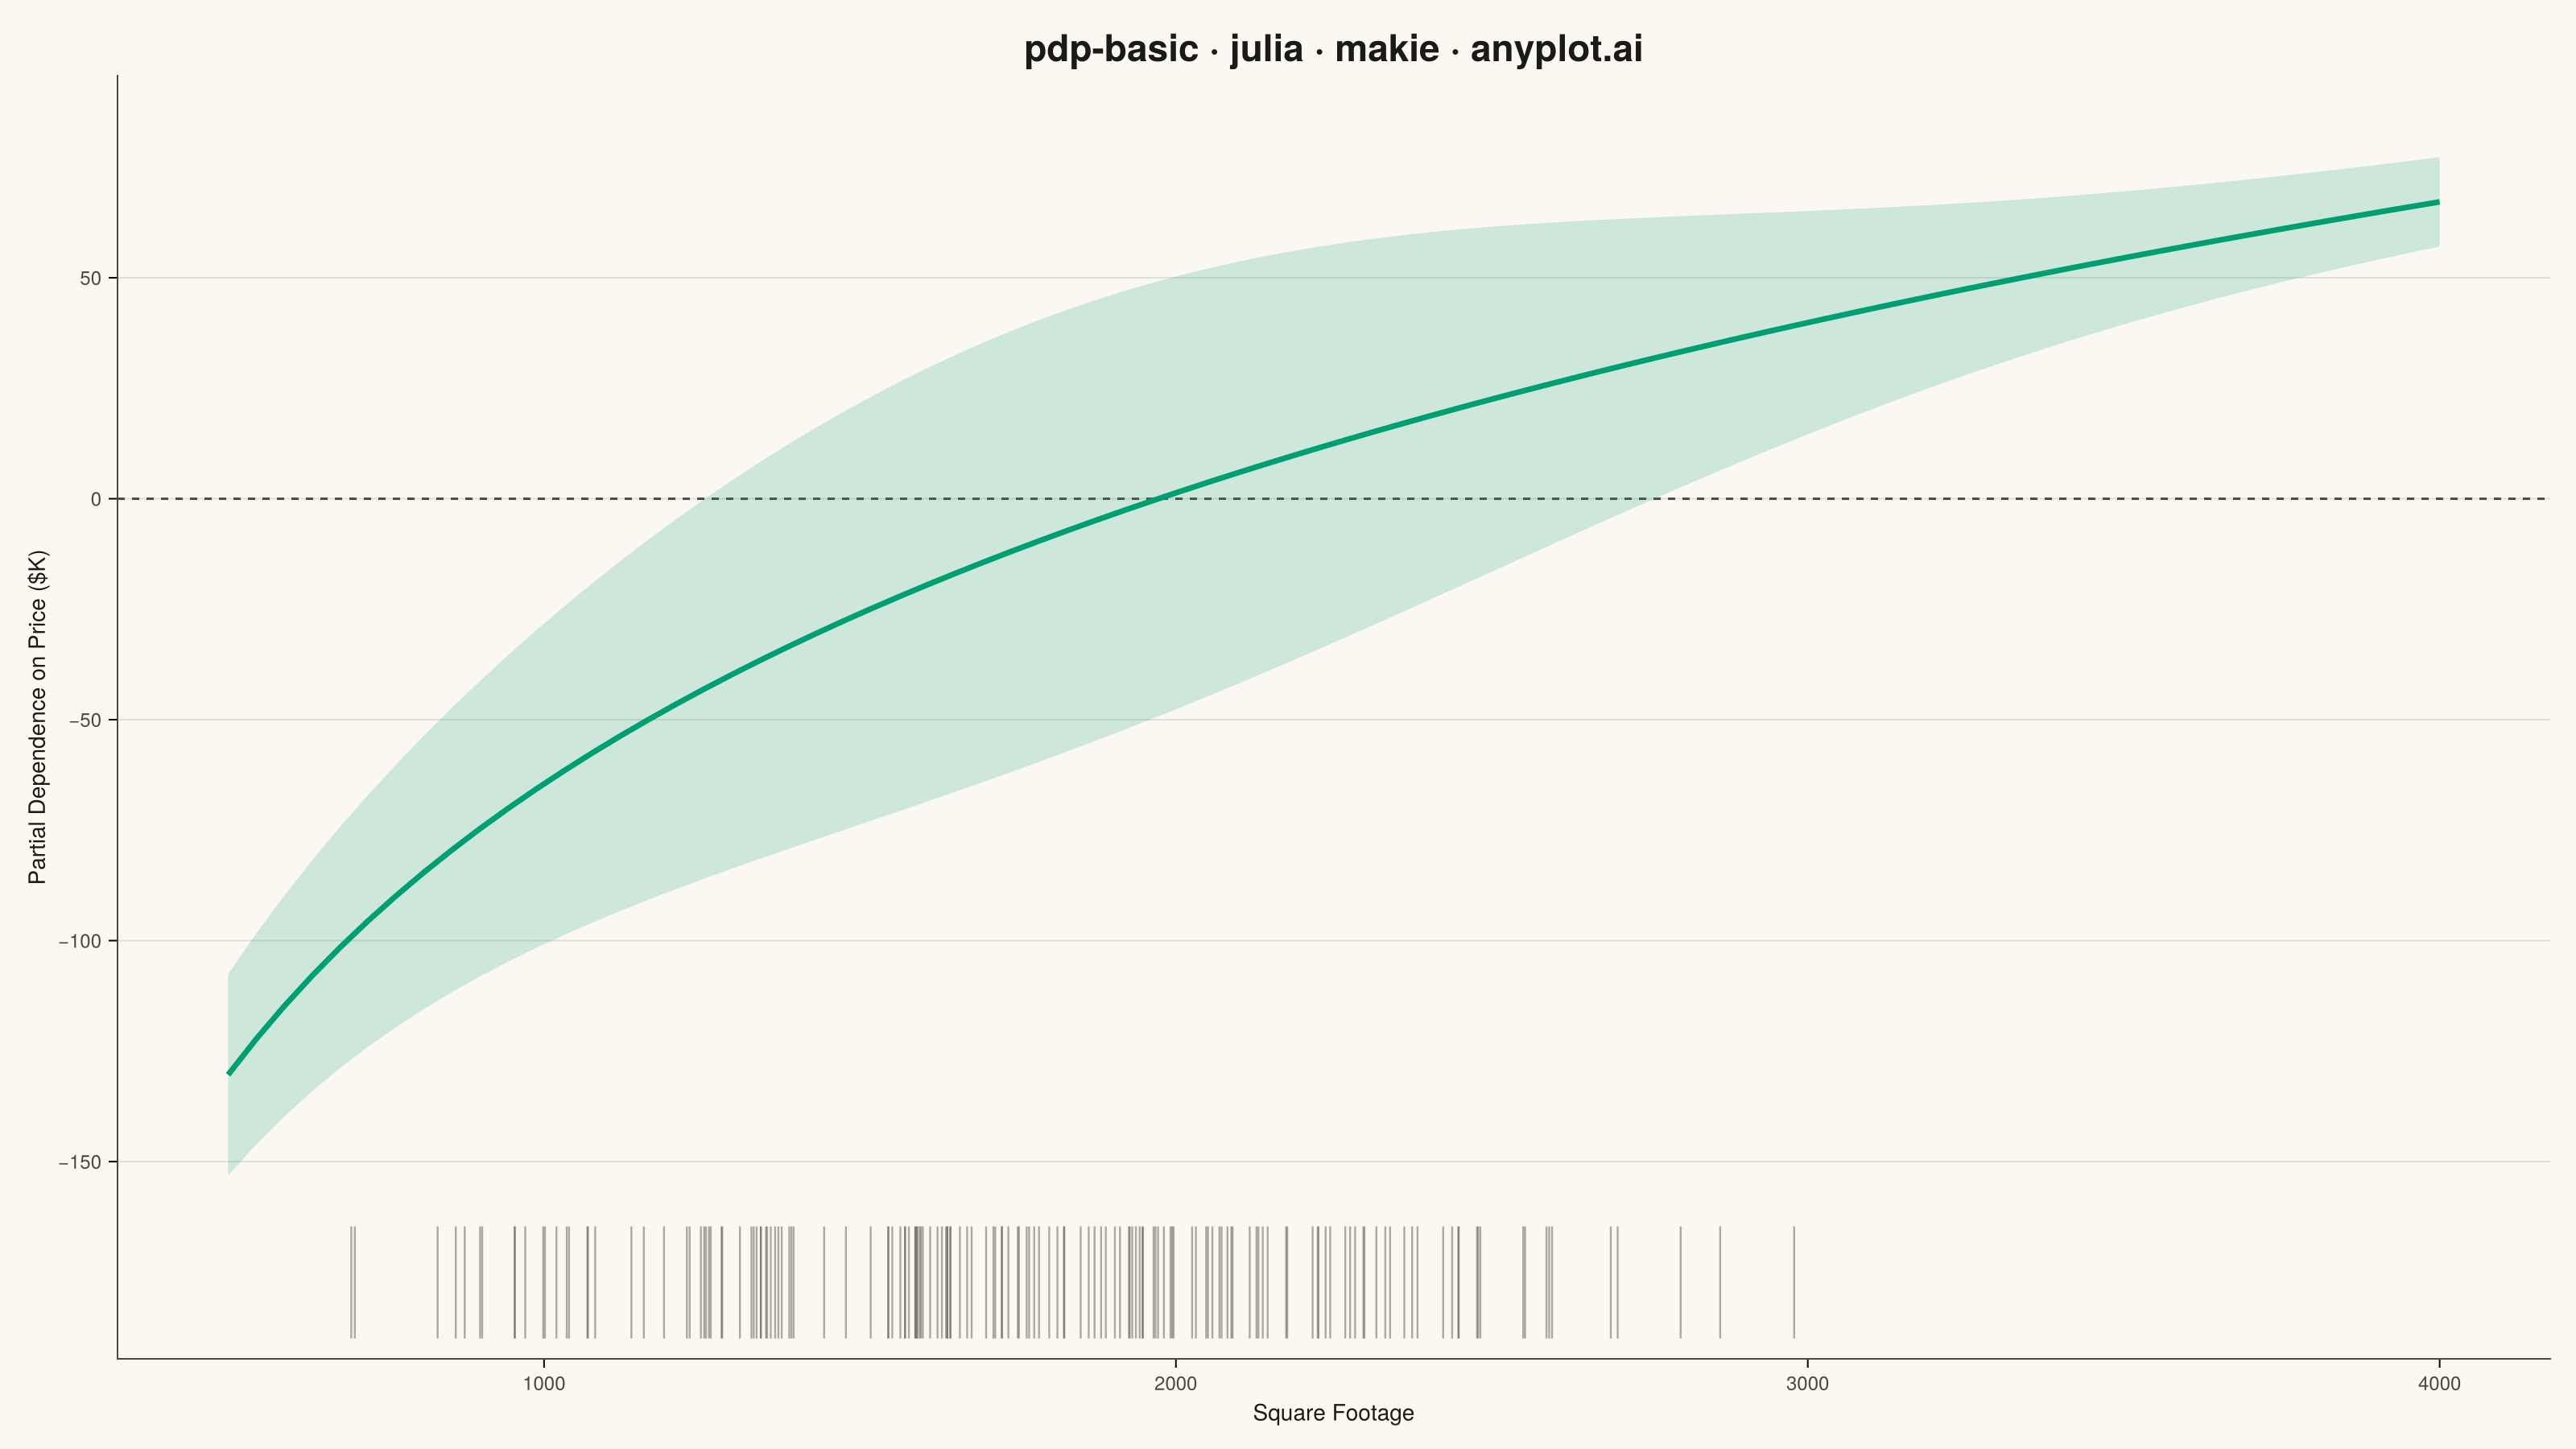
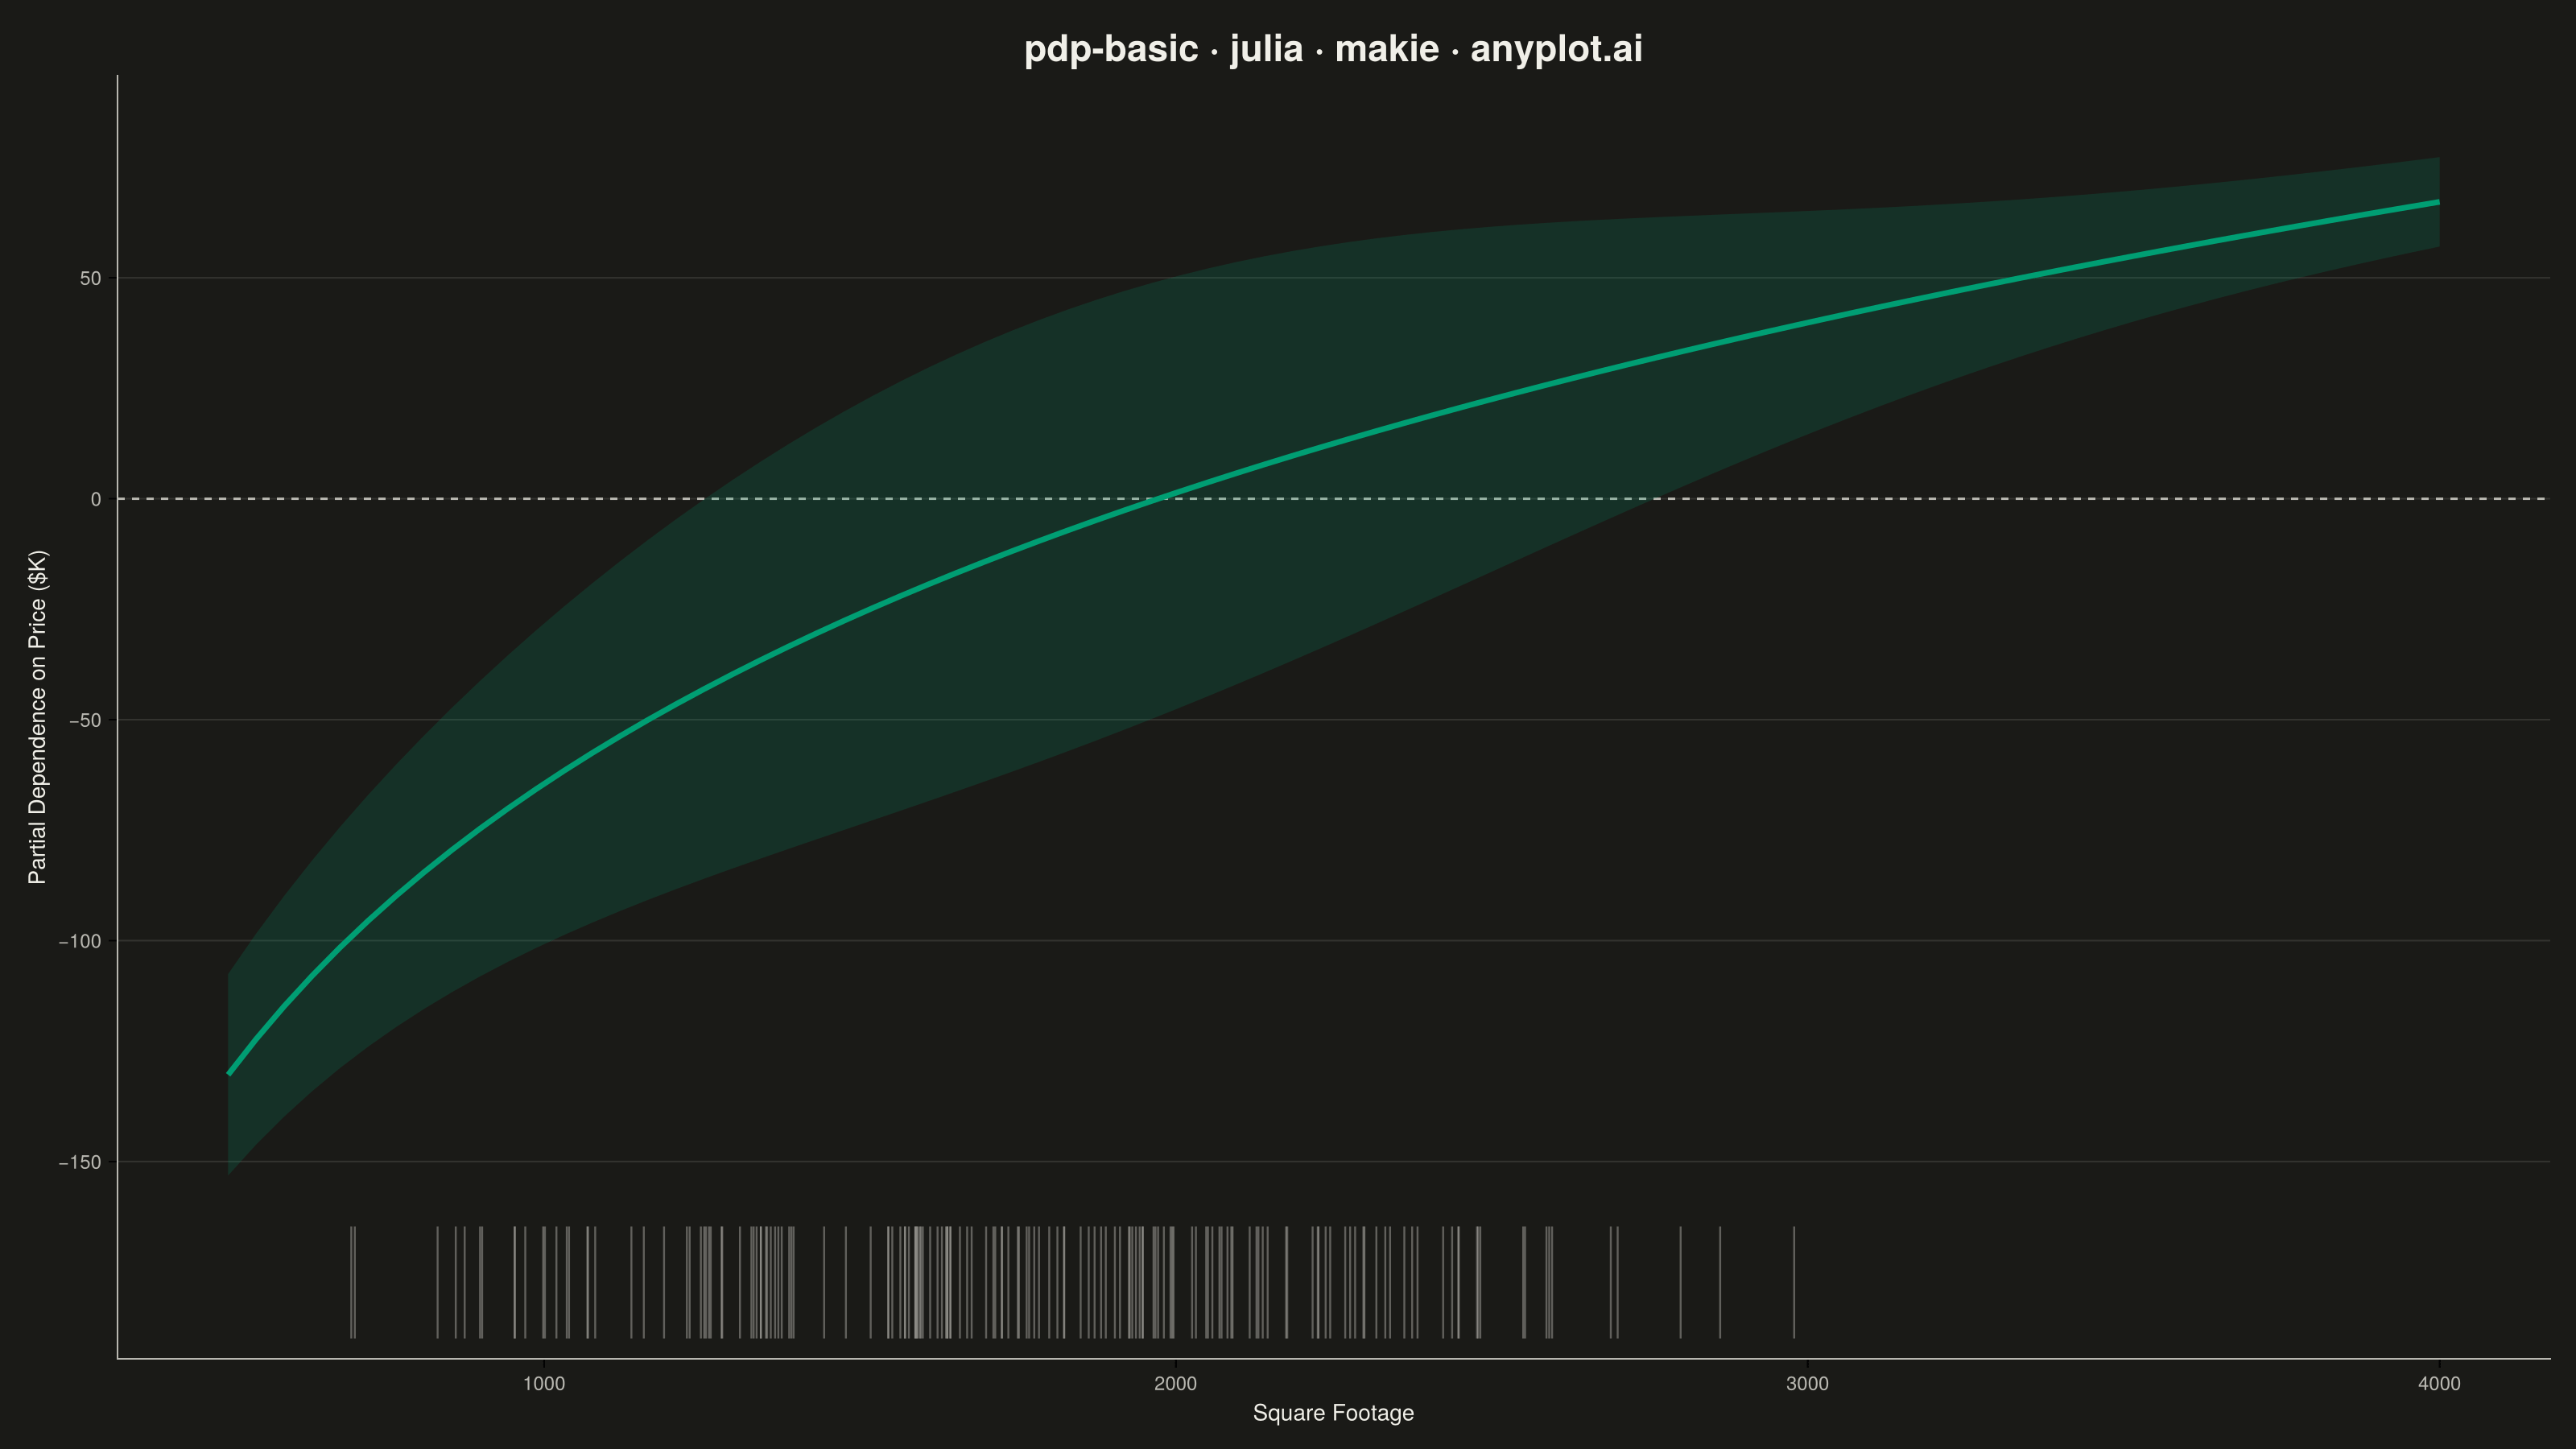
A partial dependence plot (PDP) showing the marginal effect of one feature on the predicted outcome of a machine learning model. The plot displays how predictions change as a feature varies across its range, while averaging over the effects of all other features. This visualization is essential for understanding the relationship between individual features and model predictions in interpretable machine learning.
# anyplot.ai
# pdp-basic: Partial Dependence Plot
# Library: makie 0.21.9 | Julia 1.11.9
# Quality: 92/100 | Created: 2026-09-05

using CairoMakie
using Colors
using Random
using Statistics

Random.seed!(42)

# --- Theme tokens -----------------------------------------------------------
const THEME    = get(ENV, "ANYPLOT_THEME", "light")
const PAGE_BG  = THEME == "light" ? colorant"#FAF8F1" : colorant"#1A1A17"
const INK      = THEME == "light" ? colorant"#1A1A17" : colorant"#F0EFE8"
const INK_SOFT = THEME == "light" ? colorant"#4A4A44" : colorant"#B8B7B0"

# Imprint categorical palette — 8 hues, theme-independent, hybrid-v3 sort
const IMPRINT_PALETTE = [
    colorant"#009E73",  # 1 — brand green, ALWAYS first series
    colorant"#C475FD", colorant"#4467A3", colorant"#BD8233", colorant"#AE3030",
    colorant"#2ABCCD", colorant"#954477", colorant"#99B314",
]

# --- Data ---------------------------------------------------------------
# Partial dependence of a gradient-boosting home-price model on square
# footage: predictions rise steeply for small homes, then saturate past
# ~2,500 sqft — a nonlinear pattern a linear model could never surface.
# Centered at zero, per PDP convention, so the curve reads as a relative
# effect rather than an absolute price.
n_grid = 80
sqft = collect(range(500.0, 4000.0, length = n_grid))

raw_effect = 95.0 .* log.(sqft ./ 500.0)
partial_dependence = raw_effect .- mean(raw_effect)

# Prediction variability (from the underlying trees' bootstrap spread) is
# tightest where training homes cluster around 1,800 sqft and widens toward
# the sparsely sampled extremes.
band_width = 8.0 .+ 42.0 .* exp.(-((sqft .- 1800.0) .^ 2) ./ (2 * 900.0^2))
ci_lower = partial_dependence .- band_width
ci_upper = partial_dependence .+ band_width

# Rug: the training homes' actual square footage, showing where evidence for
# the curve is dense vs. sparse.
n_train = 160
train_sqft = clamp.(1800.0 .+ 520.0 .* randn(n_train), 500.0, 4000.0)

# --- Plot -----------------------------------------------------------------
title_str = "pdp-basic · julia · makie · anyplot.ai"

fig = Figure(
    resolution      = (1600, 900),
    fontsize        = 14,
    backgroundcolor = PAGE_BG,
)

y_lo   = minimum(ci_lower)
y_hi   = maximum(ci_upper)
y_span = y_hi - y_lo

rug_bottom = y_lo - 0.16 * y_span
rug_top    = y_lo - 0.05 * y_span

ax = Axis(
    fig[1, 1];
    title              = title_str,
    titlesize          = 23,
    titlecolor         = INK,
    xlabel             = "Square Footage",
    ylabel             = "Partial Dependence on Price (\$K)",
    xlabelsize         = 14,
    ylabelsize         = 14,
    xlabelcolor        = INK,
    ylabelcolor        = INK,
    xticklabelsize     = 12,
    yticklabelsize     = 12,
    xticklabelcolor    = INK_SOFT,
    yticklabelcolor    = INK_SOFT,
    backgroundcolor    = PAGE_BG,
    topspinevisible    = false,
    rightspinevisible  = false,
    leftspinecolor     = INK_SOFT,
    bottomspinecolor   = INK_SOFT,
    xgridvisible       = false,
    ygridvisible       = true,
    ygridcolor         = RGBAf(INK.r, INK.g, INK.b, 0.12),
    limits             = (nothing, nothing, rug_bottom - 0.02 * y_span, y_hi + 0.08 * y_span),
)

hlines!(ax, [0.0]; color = INK_SOFT, linewidth = 1.5, linestyle = :dash)

band!(ax, sqft, ci_lower, ci_upper; color = (IMPRINT_PALETTE[1], 0.18))
lines!(ax, sqft, partial_dependence; color = IMPRINT_PALETTE[1], linewidth = 3.5)

rug_segments = Vector{Point2f}(undef, 2 * length(train_sqft))
for (i, v) in enumerate(train_sqft)
    rug_segments[2i - 1] = Point2f(v, rug_bottom)
    rug_segments[2i]     = Point2f(v, rug_top)
end
linesegments!(ax, rug_segments; color = (INK_SOFT, 0.45), linewidth = 1.2)

# --- Save -------------------------------------------------------------------
save("plot-$(THEME).png", fig; px_per_unit = 2)
Runnable source as JSON, for any HTTP client: https://api.anyplot.ai/specs/pdp-basic/makie/code. Any spec id and library id listed in llms-full.txt fit the same URL shape; every URL below is complete and callable.
{
  "spec_id": "pdp-basic",
  "language": "julia",
  "library": "makie",
  "page": "https://anyplot.ai/pdp-basic/julia/makie",
  "hub": "https://anyplot.ai/pdp-basic",
  "code_json": "https://api.anyplot.ai/specs/pdp-basic/makie/code",
  "spec_json": "https://api.anyplot.ai/specs/pdp-basic",
  "render_light_png": "https://storage.googleapis.com/anyplot-images/plots/pdp-basic/julia/makie/plot-light.png",
  "render_dark_png": "https://storage.googleapis.com/anyplot-images/plots/pdp-basic/julia/makie/plot-dark.png",
  "quality_score": 92.0,
  "license": "MIT",
  "guide": "https://anyplot.ai/llms.txt"
}
Part of Partial Dependence Plot on anyplot.ai.