The same plot in 14 other libraries — JavaScript: Chart.js, D3.js, Apache ECharts, MUI X Charts; Python: Altair, Bokeh, lets-plot, Matplotlib, Plotly, plotnine, Pygal, Seaborn; R: ggplot2; Julia: Makie.jl. Compare all 15 side by side: Phase Diagram (State Space Plot) in Python, R, Julia and JavaScript.
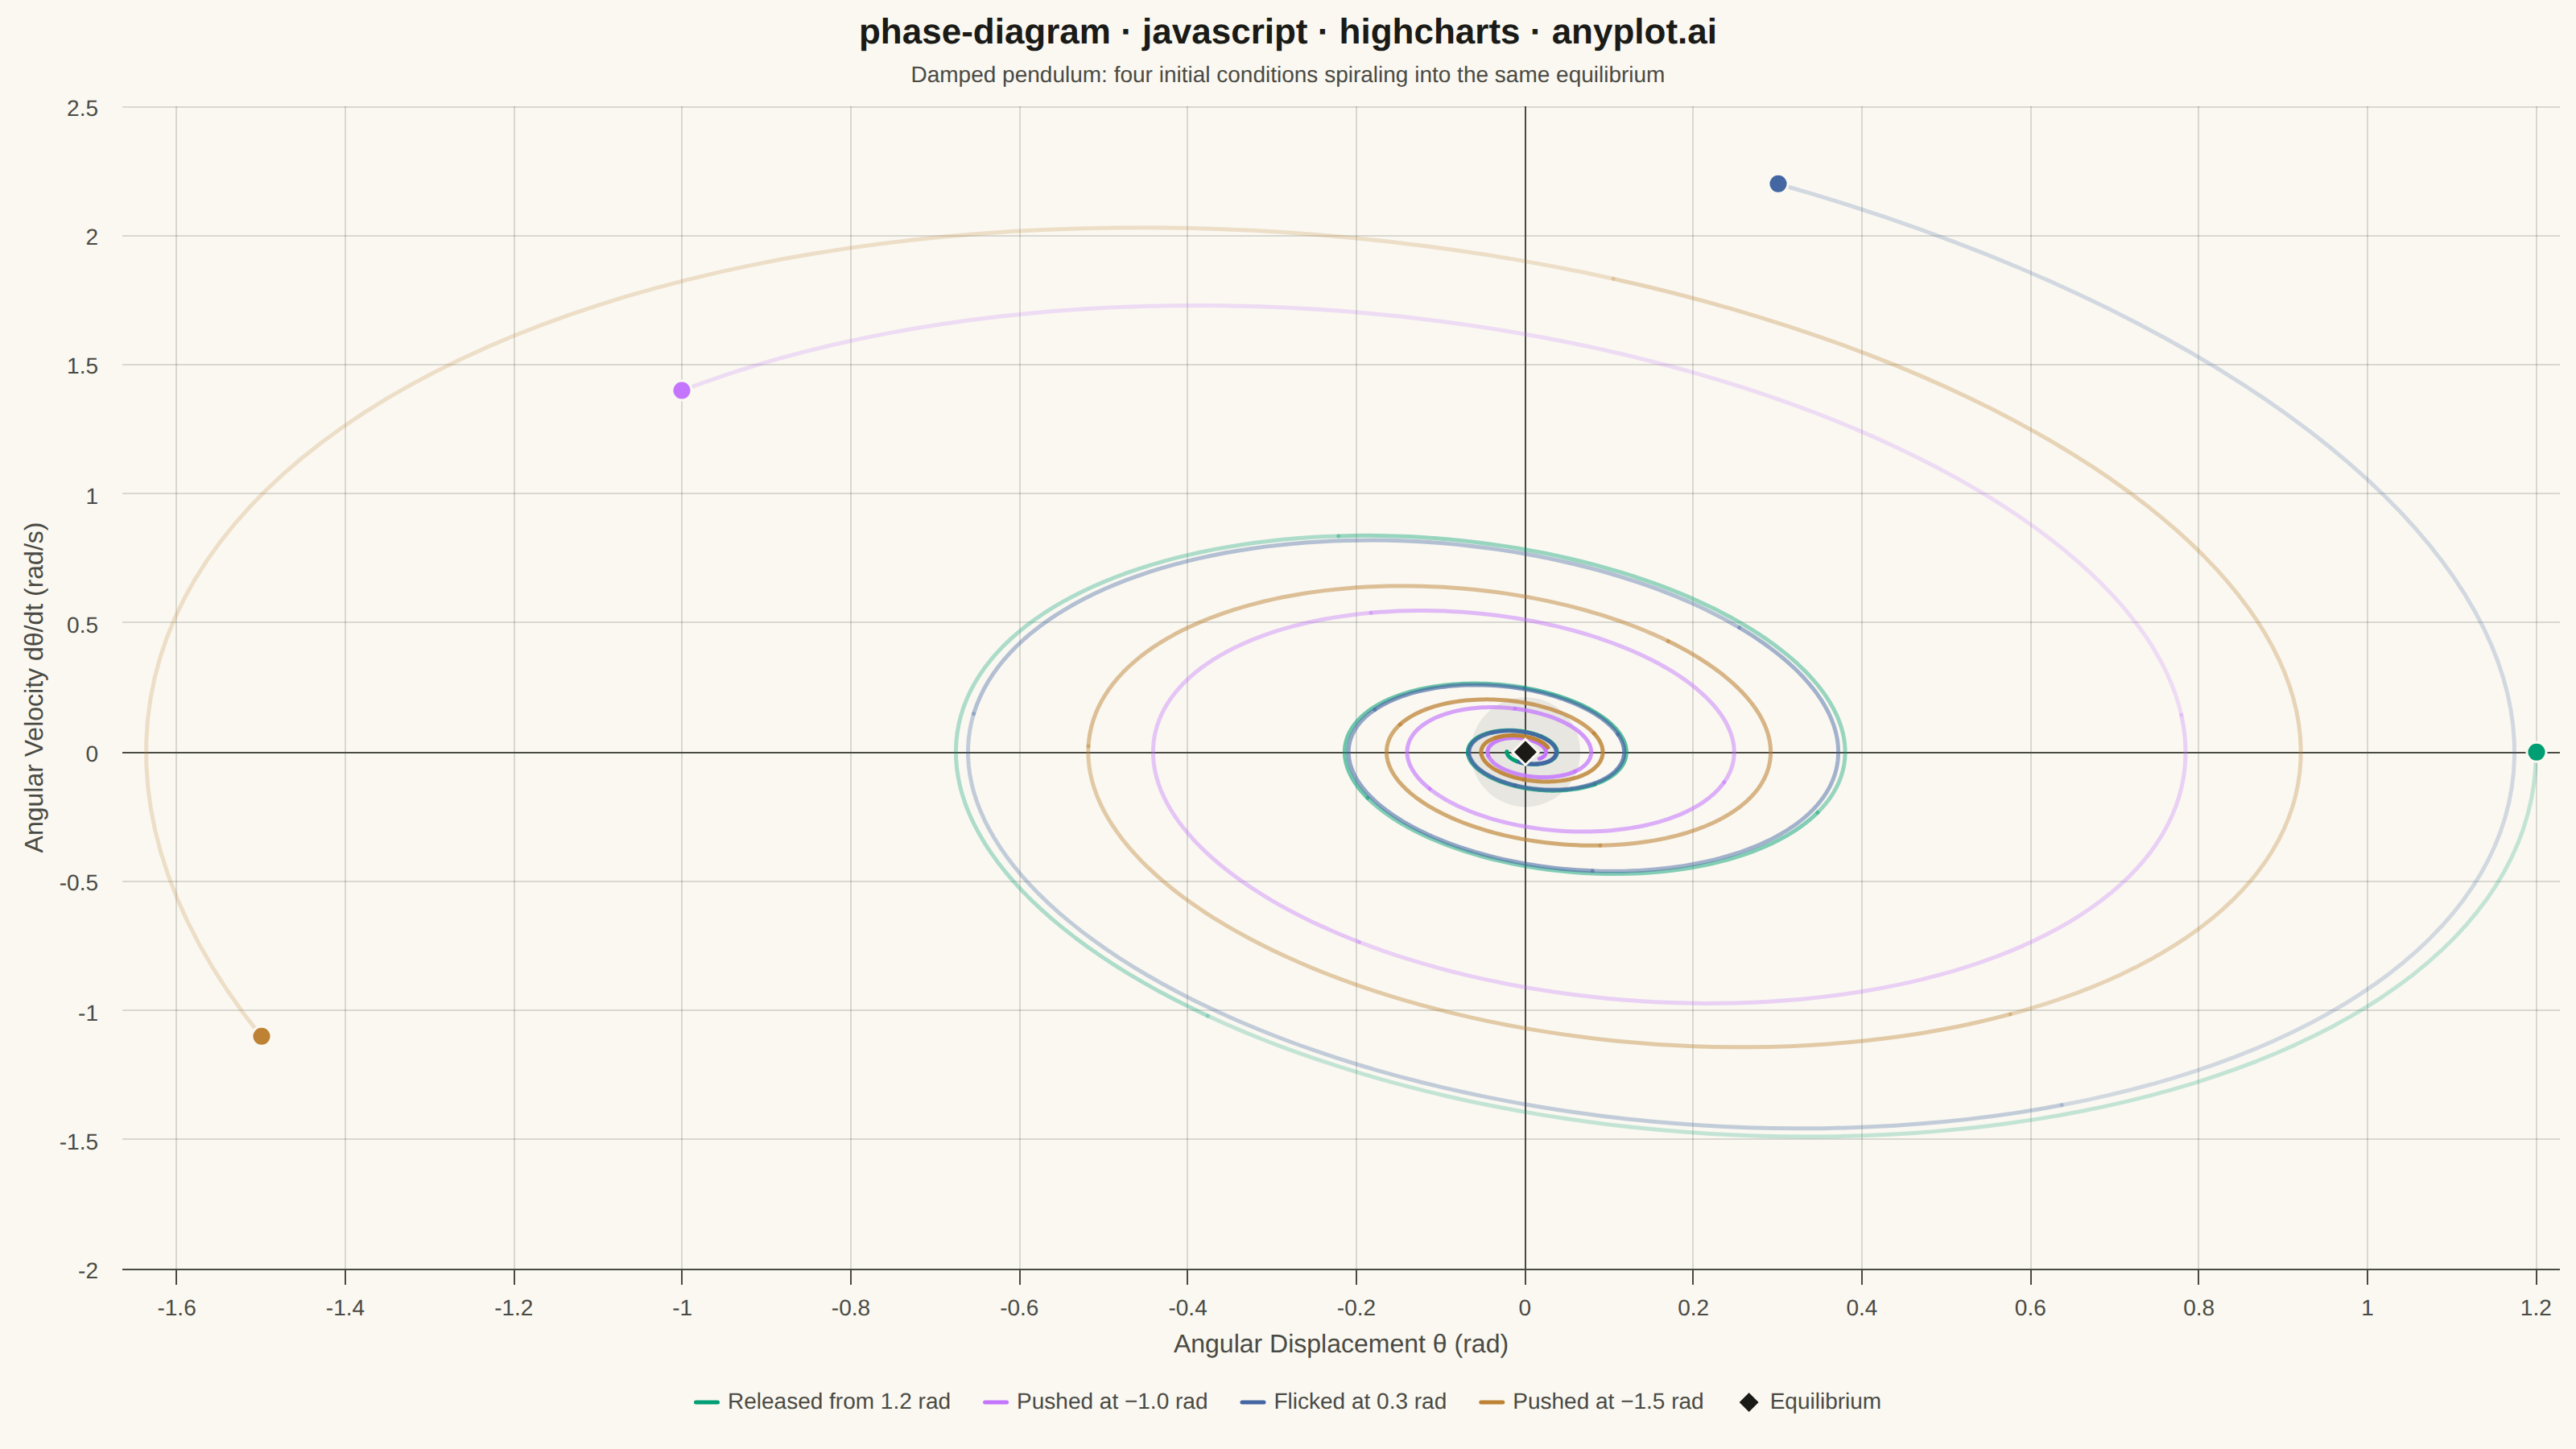
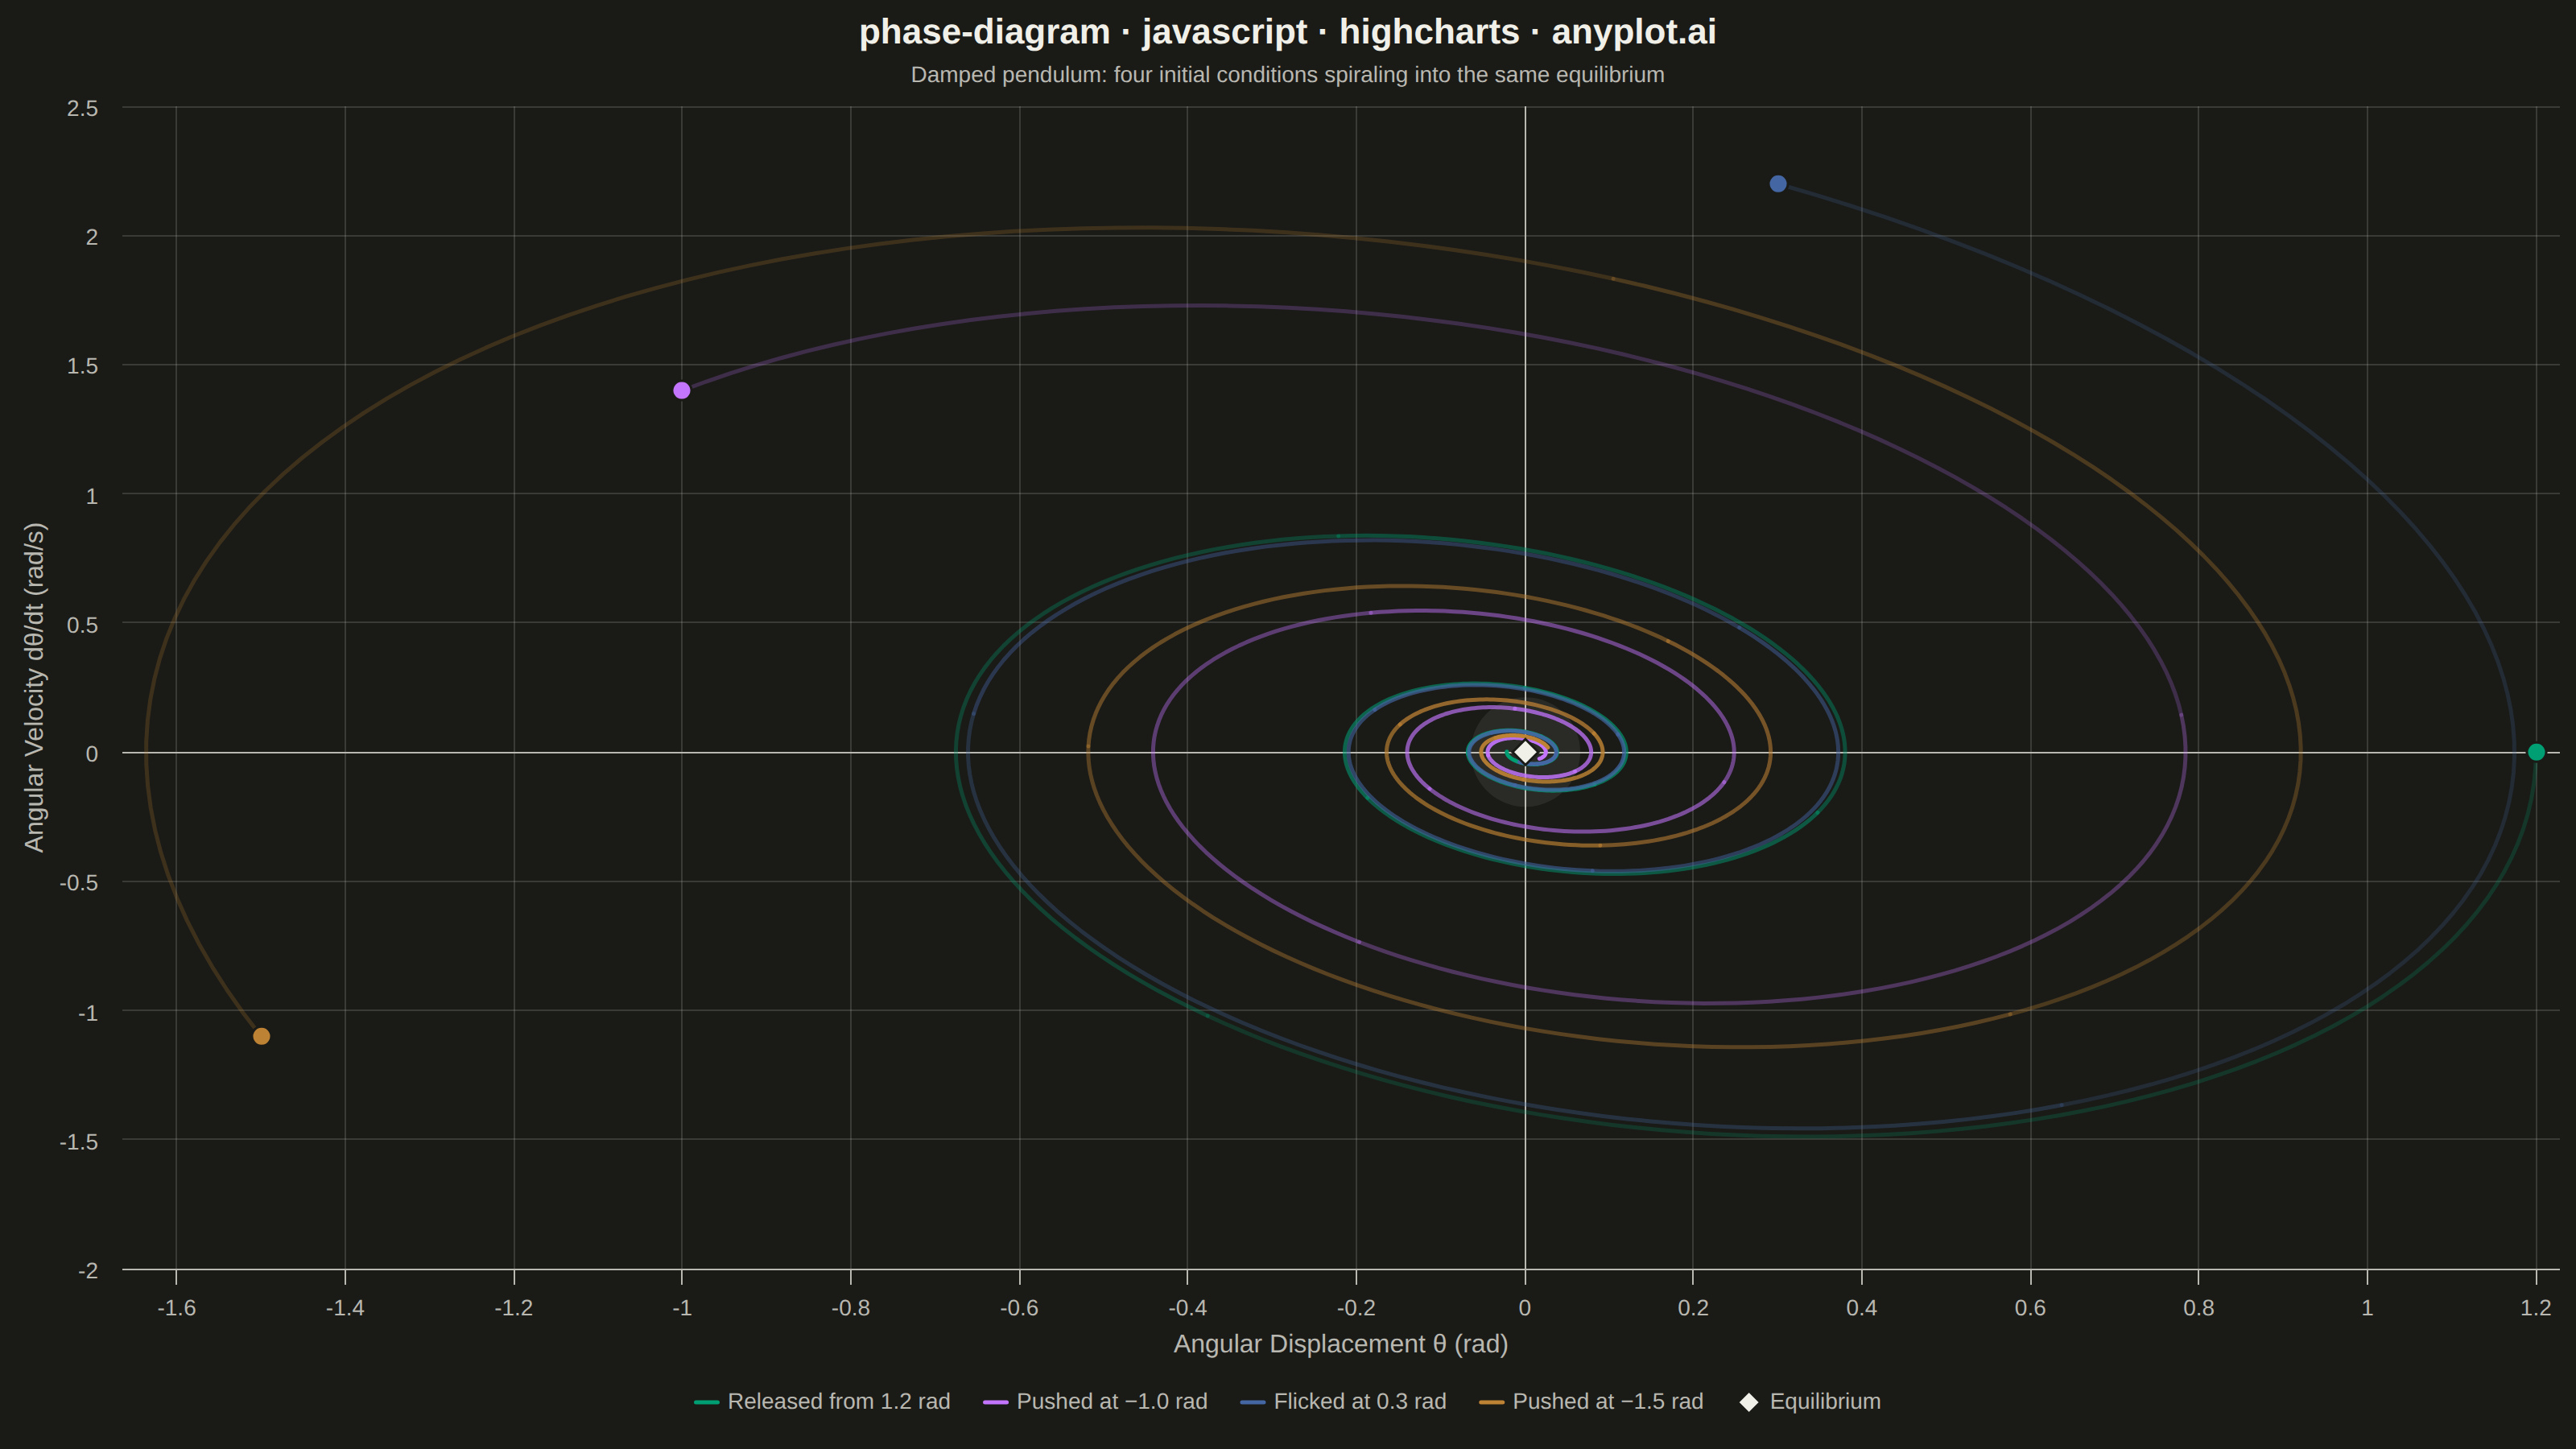
A phase diagram (or state space plot) displays the trajectory of a dynamical system by plotting a variable against its derivative (x vs dx/dt). This visualization reveals the qualitative behavior of systems including fixed points, limit cycles, stability, and oscillation patterns. It is essential for analyzing differential equations without solving them explicitly.
// anyplot.ai
// phase-diagram: Phase Diagram (State Space Plot)
// Library: highcharts 12.6.0 | JavaScript 22.23.2
// Quality: 88/100 | Created: 2026-09-05

const t = window.ANYPLOT_TOKENS;

// --- Data: damped pendulum, dθ/dt vs θ, from four initial displacements -----
// θ'' + 2·ζ·ω·θ' + ω²·θ = 0, integrated with RK4 so every trajectory spirals
// deterministically toward the equilibrium at the origin.
const OMEGA = 1.6; // natural frequency (rad/s)
const ZETA = 0.18; // damping ratio (underdamped -> spiral, not straight decay)
const DT = 0.02;
const STEPS = 700;

function derivative(theta, omega_dot) {
  return [omega_dot, -2 * ZETA * OMEGA * omega_dot - OMEGA * OMEGA * theta];
}

function integrateTrajectory(theta0, omegaDot0) {
  const points = [];
  let theta = theta0;
  let omegaDot = omegaDot0;
  for (let i = 0; i <= STEPS; i++) {
    points.push([theta, omegaDot]);
    const [k1t, k1o] = derivative(theta, omegaDot);
    const [k2t, k2o] = derivative(theta + (DT / 2) * k1t, omegaDot + (DT / 2) * k1o);
    const [k3t, k3o] = derivative(theta + (DT / 2) * k2t, omegaDot + (DT / 2) * k2o);
    const [k4t, k4o] = derivative(theta + DT * k3t, omegaDot + DT * k3o);
    theta += (DT / 6) * (k1t + 2 * k2t + 2 * k3t + k4t);
    omegaDot += (DT / 6) * (k1o + 2 * k2o + 2 * k3o + k4o);
  }
  return points;
}

// Four initial displacements (radians) and angular velocities (rad/s), each
// spiraling into the same stable fixed point at the origin.
const initialConditions = [
  { theta0: 1.2, omegaDot0: 0.0, label: "Released from 1.2 rad" },
  { theta0: -1.0, omegaDot0: 1.4, label: "Pushed at −1.0 rad" },
  { theta0: 0.3, omegaDot0: 2.2, label: "Flicked at 0.3 rad" },
  { theta0: -1.5, omegaDot0: -1.1, label: "Pushed at −1.5 rad" },
];

const trajectories = initialConditions.map((ic) => ({
  ...ic,
  points: integrateTrajectory(ic.theta0, ic.omegaDot0),
}));

function hexToRgba(hex, alpha) {
  const h = hex.replace("#", "");
  const r = parseInt(h.substring(0, 2), 16);
  const g = parseInt(h.substring(2, 4), 16);
  const b = parseInt(h.substring(4, 6), 16);
  return `rgba(${r}, ${g}, ${b}, ${alpha})`;
}

// Each trajectory is drawn as a run of short line segments whose opacity rises
// from faint (t=0, far from equilibrium) to solid (final points, at rest) —
// a time-evolution cue that follows the actual path order, unlike a bounding-box
// SVG gradient which would fade by spatial position instead of by time.
const SEGMENTS = 10;
function fadedTrailSegments(traj, baseColor) {
  const pts = traj.points;
  const segLen = Math.ceil(pts.length / SEGMENTS);
  const segments = [];
  for (let s = 0; s < SEGMENTS; s++) {
    const start = s * segLen;
    if (start >= pts.length - 1) break;
    const end = Math.min(pts.length - 1, start + segLen);
    const alpha = 0.22 + (0.78 * s) / (SEGMENTS - 1);
    segments.push({
      name: traj.label,
      type: "line",
      data: pts.slice(start, end + 1),
      color: hexToRgba(baseColor, alpha),
      lineWidth: 2.5,
      marker: { enabled: false },
      showInLegend: s === SEGMENTS - 1,
    });
  }
  return segments;
}

// --- Chart -------------------------------------------------------------------
Highcharts.chart("container", {
  chart: {
    type: "line",
    backgroundColor: "transparent",
    animation: false,
    style: { fontFamily: "inherit" },
  },
  credits: { enabled: false },
  colors: t.palette,
  title: {
    text: "phase-diagram · javascript · highcharts · anyplot.ai",
    style: { color: t.ink, fontSize: "22px", fontWeight: "600" },
  },
  subtitle: {
    text: "Damped pendulum: four initial conditions spiraling into the same equilibrium",
    style: { color: t.inkSoft, fontSize: "14px" },
  },
  xAxis: {
    title: { text: "Angular Displacement θ (rad)", style: { color: t.inkSoft, fontSize: "16px" } },
    lineColor: t.inkSoft,
    tickColor: t.inkSoft,
    gridLineColor: t.grid,
    gridLineWidth: 1,
    labels: { style: { color: t.inkSoft, fontSize: "14px" } },
    plotLines: [{ value: 0, color: t.inkSoft, width: 1, zIndex: 2 }],
  },
  yAxis: {
    title: { text: "Angular Velocity dθ/dt (rad/s)", style: { color: t.inkSoft, fontSize: "16px" } },
    lineColor: t.inkSoft,
    tickColor: t.inkSoft,
    gridLineColor: t.grid,
    gridLineWidth: 1,
    labels: { style: { color: t.inkSoft, fontSize: "14px" } },
    plotLines: [{ value: 0, color: t.inkSoft, width: 1, zIndex: 2 }],
  },
  legend: {
    itemStyle: { color: t.inkSoft, fontSize: "14px" },
    itemHoverStyle: { color: t.ink },
  },
  tooltip: {
    headerFormat: "<b>{series.name}</b><br/>",
    pointFormat: "θ = {point.x:.2f} rad, dθ/dt = {point.y:.2f} rad/s",
  },
  plotOptions: {
    series: { animation: false },
  },
  series: [
    {
      name: "Equilibrium halo",
      type: "scatter",
      data: [[0, 0]],
      color: hexToRgba(t.ink, 0.08),
      marker: { symbol: "circle", radius: 34, lineWidth: 0 },
      enableMouseTracking: false,
      showInLegend: false,
      zIndex: 0,
    },
    ...trajectories.flatMap((traj, i) => fadedTrailSegments(traj, t.palette[i])),
    ...trajectories.map((traj, i) => ({
      name: `${traj.label} start`,
      type: "scatter",
      data: [traj.points[0]],
      color: t.palette[i],
      marker: { symbol: "circle", radius: 6, lineWidth: 1.5, lineColor: t.pageBg },
      enableMouseTracking: false,
      showInLegend: false,
      zIndex: 4,
    })),
    {
      name: "Equilibrium",
      type: "scatter",
      data: [[0, 0]],
      color: t.ink,
      marker: { symbol: "diamond", radius: 8, lineWidth: 1.5, lineColor: t.pageBg },
      zIndex: 5,
    },
  ],
});
Runnable source as JSON, for any HTTP client: https://api.anyplot.ai/specs/phase-diagram/highcharts/code. Any spec id and library id listed in llms-full.txt fit the same URL shape; every URL below is complete and callable.
{
  "spec_id": "phase-diagram",
  "language": "javascript",
  "library": "highcharts",
  "page": "https://anyplot.ai/phase-diagram/javascript/highcharts",
  "hub": "https://anyplot.ai/phase-diagram",
  "code_json": "https://api.anyplot.ai/specs/phase-diagram/highcharts/code",
  "spec_json": "https://api.anyplot.ai/specs/phase-diagram",
  "render_light_png": "https://storage.googleapis.com/anyplot-images/plots/phase-diagram/javascript/highcharts/plot-light.png",
  "render_dark_png": "https://storage.googleapis.com/anyplot-images/plots/phase-diagram/javascript/highcharts/plot-dark.png",
  "interactive_light_html": "https://storage.googleapis.com/anyplot-images/plots/phase-diagram/javascript/highcharts/plot-light.html",
  "interactive_dark_html": "https://storage.googleapis.com/anyplot-images/plots/phase-diagram/javascript/highcharts/plot-dark.html",
  "quality_score": 88.0,
  "license": "MIT",
  "guide": "https://anyplot.ai/llms.txt"
}
Part of Phase Diagram (State Space Plot) on anyplot.ai.