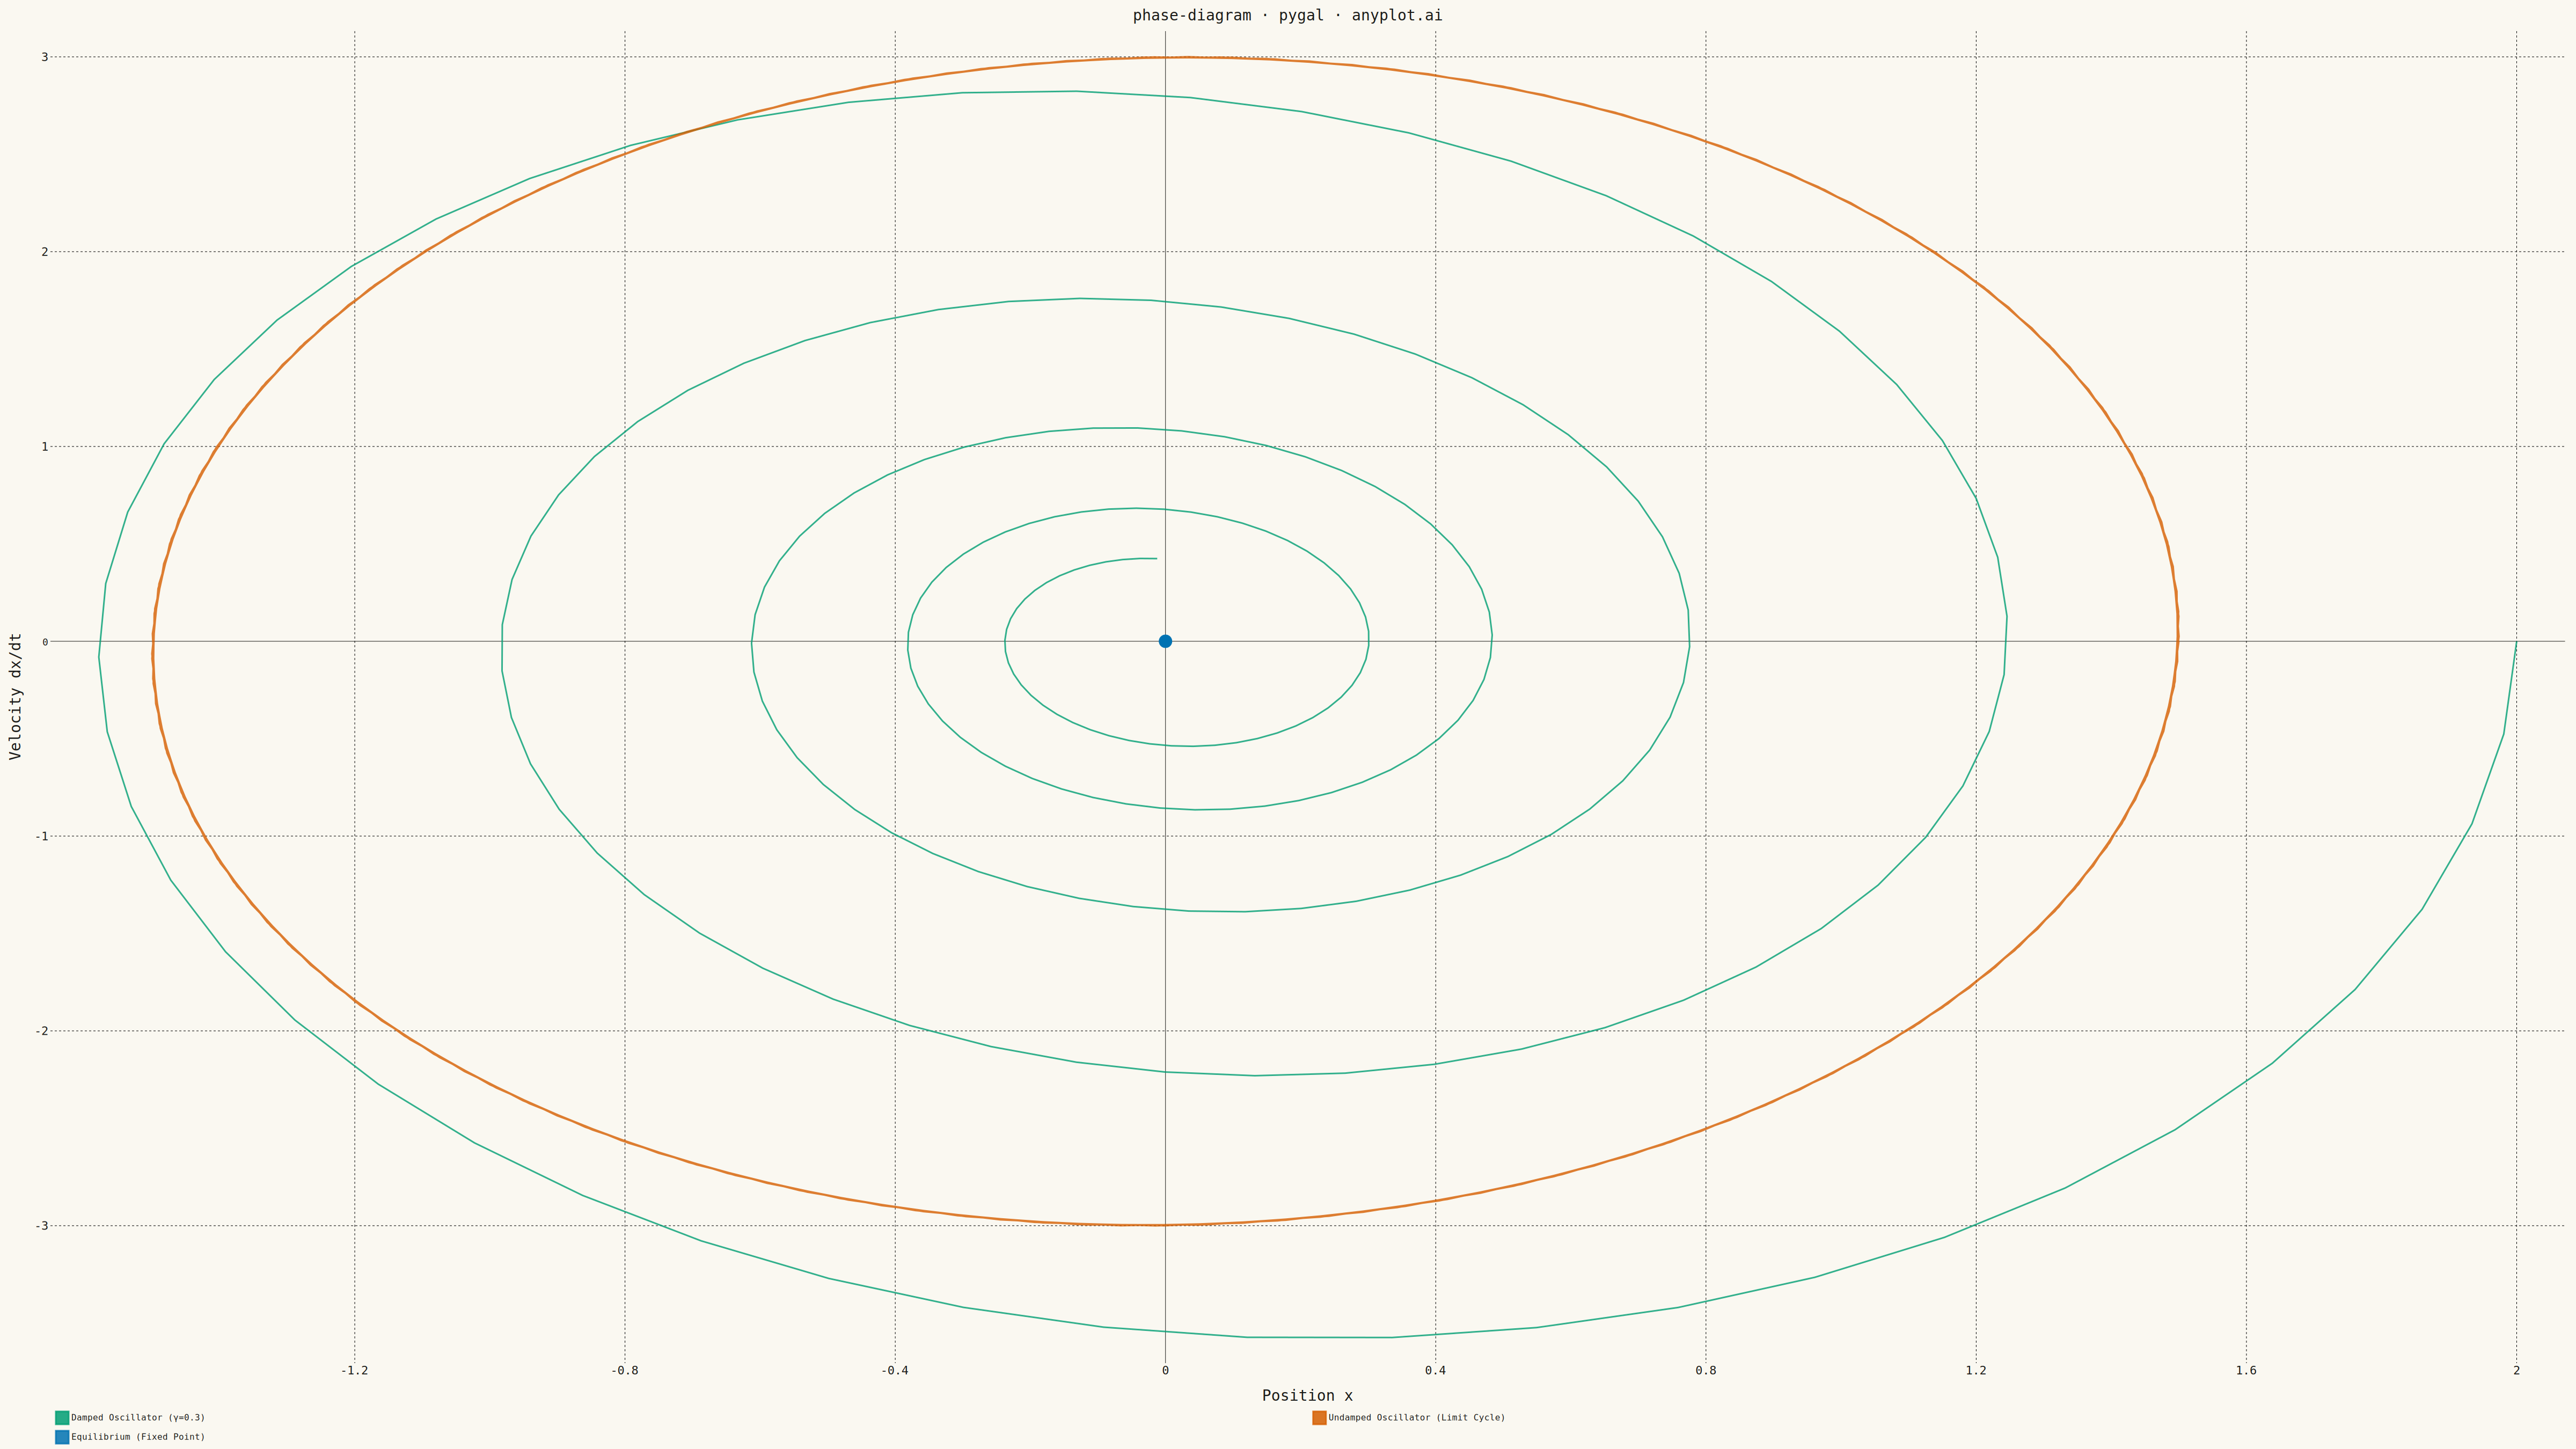
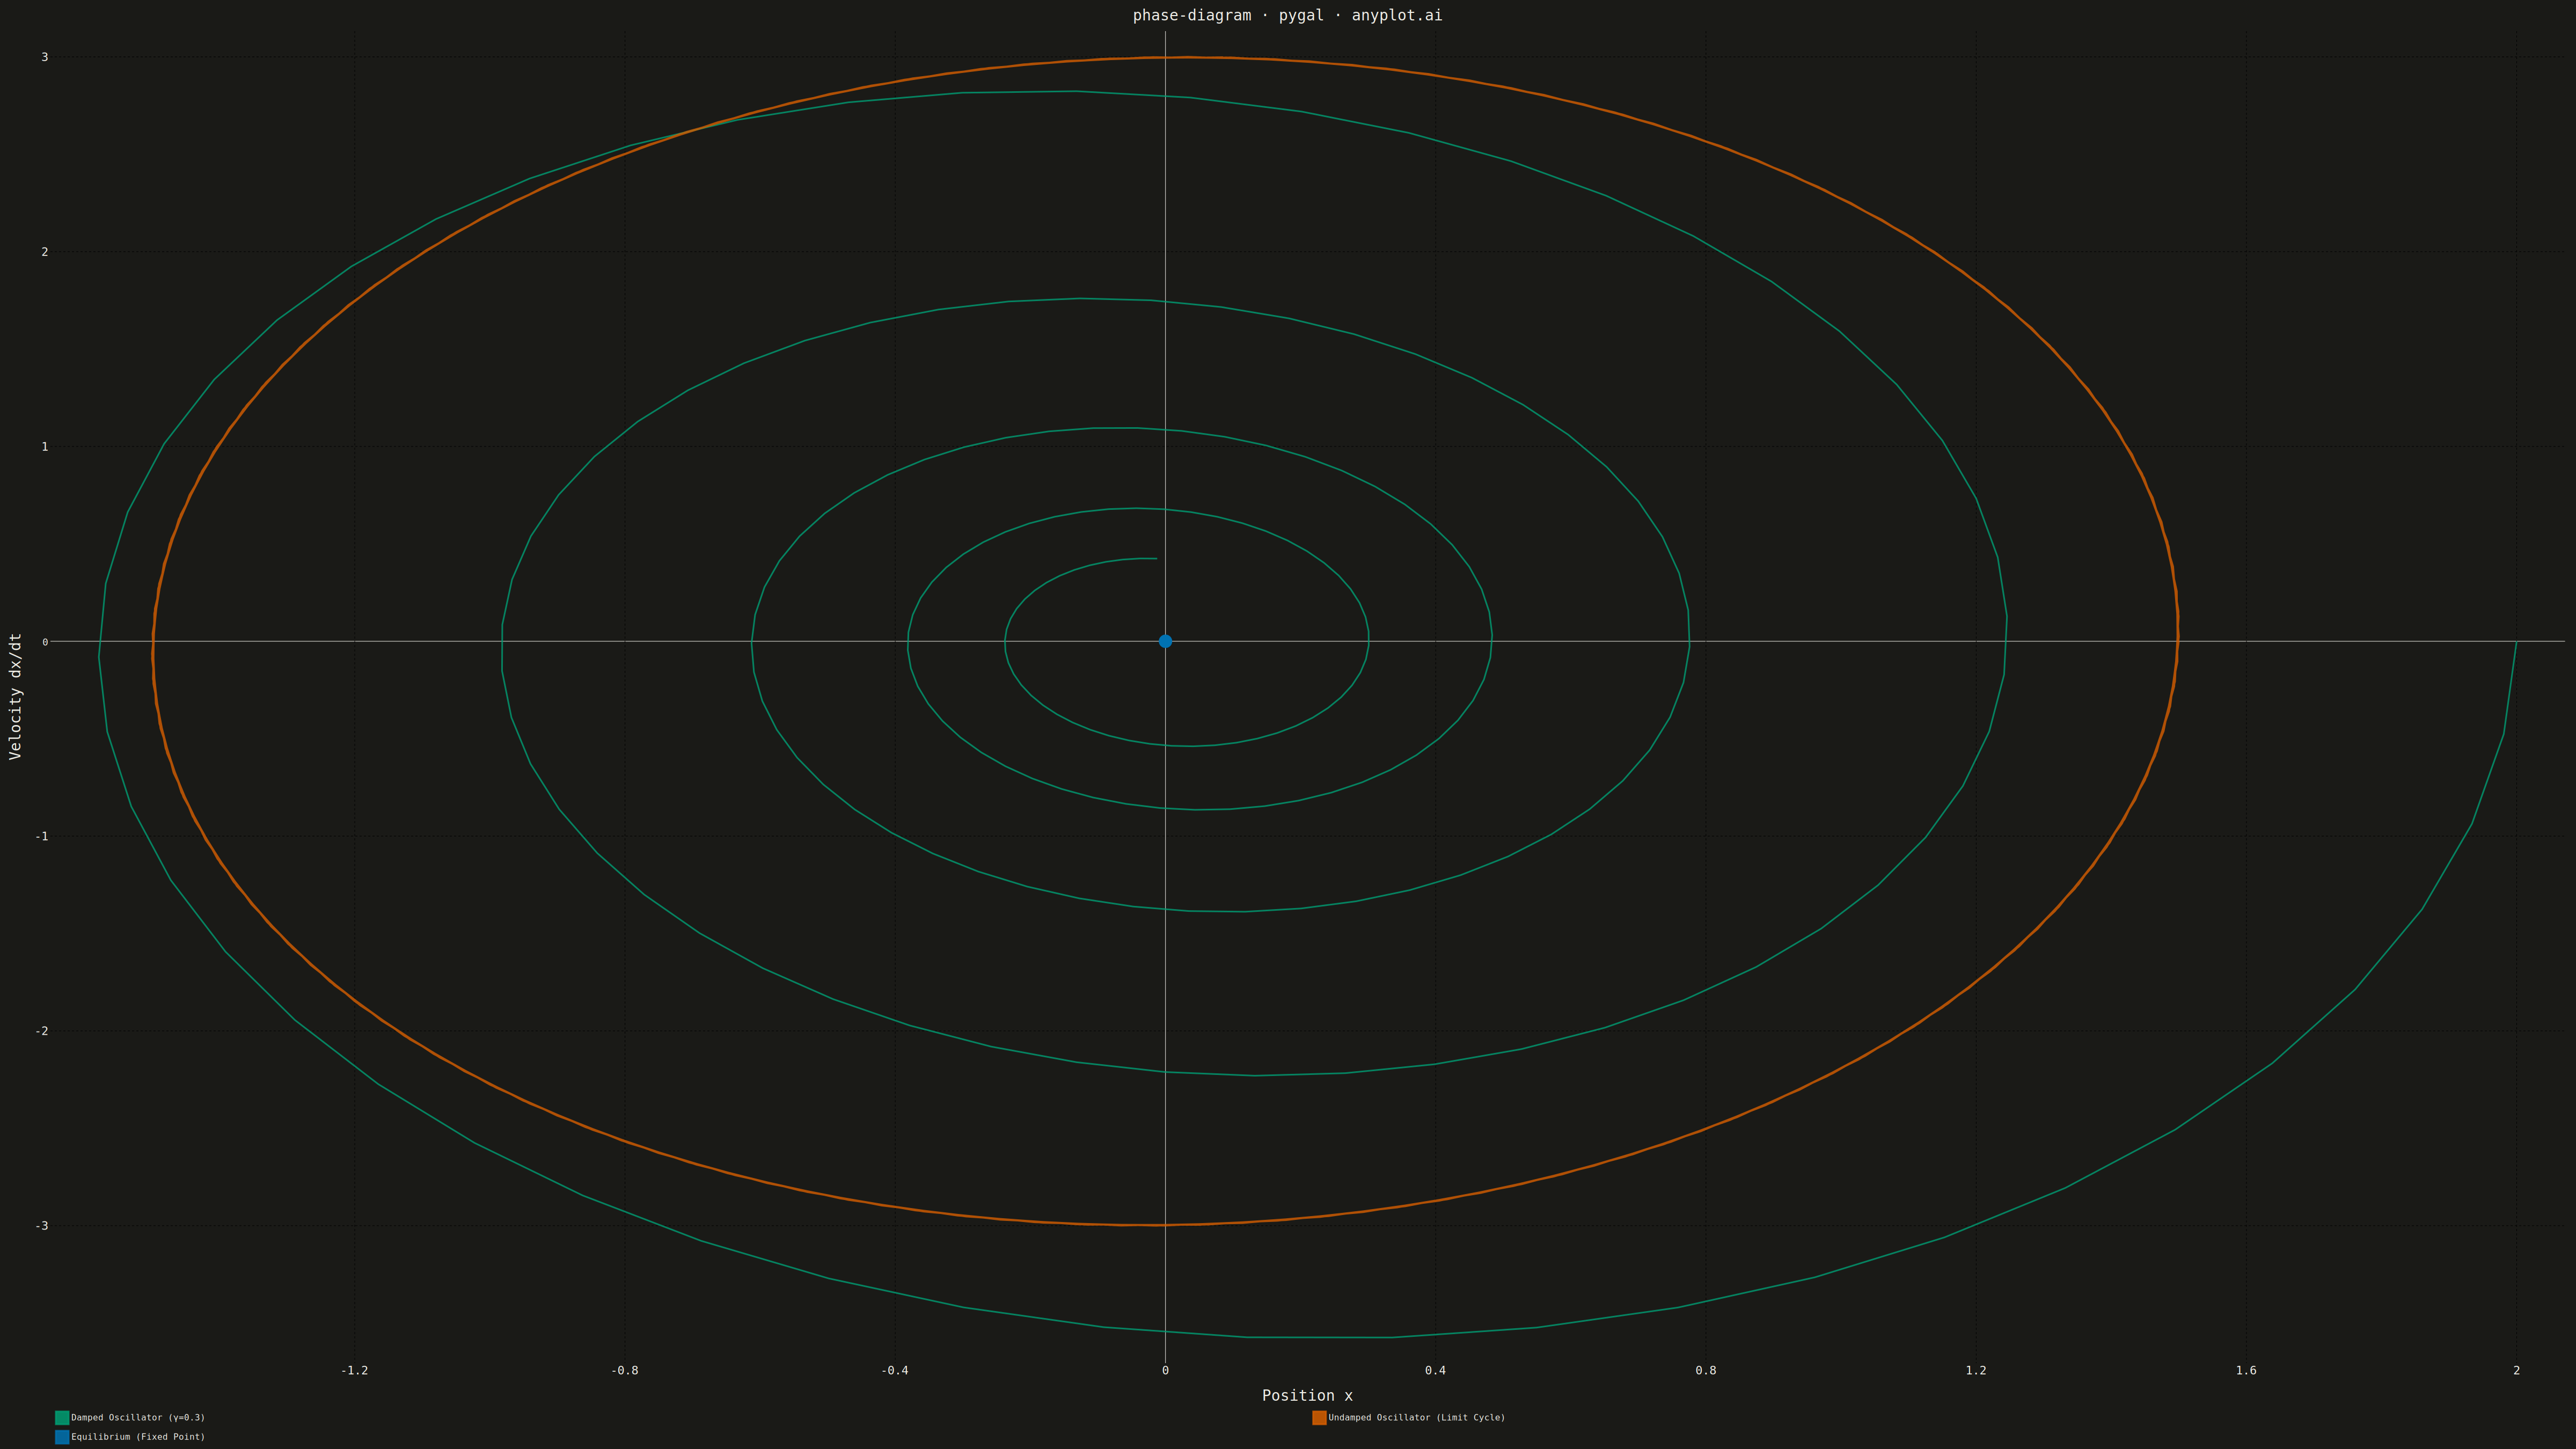
A phase diagram (or state space plot) displays the trajectory of a dynamical system by plotting a variable against its derivative (x vs dx/dt). This visualization reveals the qualitative behavior of systems including fixed points, limit cycles, stability, and oscillation patterns. It is essential for analyzing differential equations without solving them explicitly.
""" anyplot.ai
phase-diagram: Phase Diagram (State Space Plot)
Library: pygal 3.1.0 | Python 3.13.13
Quality: 81/100 | Updated: 2026-05-14
"""

import numpy as np
import pygal
from pygal.style import Style


# Data: Damped pendulum phase space
# The damped pendulum follows: d²x/dt² = -ω²x - γ(dx/dt)
# This creates a spiral trajectory converging to equilibrium

np.random.seed(42)

# Parameters for damped harmonic oscillator
omega = 2.0  # Natural frequency
gamma = 0.3  # Damping coefficient
dt = 0.02  # Time step
t_max = 15  # Total time

# Generate trajectory using numerical integration (Euler method)
t = np.arange(0, t_max, dt)
n_points = len(t)

# Initial conditions: displaced position, zero velocity
x = np.zeros(n_points)
v = np.zeros(n_points)  # v = dx/dt
x[0] = 2.0  # Initial displacement
v[0] = 0.0  # Initial velocity

# Integrate the equations of motion
for i in range(1, n_points):
    # Acceleration: a = -ω²x - γv
    a = -(omega**2) * x[i - 1] - gamma * v[i - 1]
    # Update velocity and position
    v[i] = v[i - 1] + a * dt
    x[i] = x[i - 1] + v[i] * dt

# Also generate an undamped oscillator for comparison (limit cycle)
x_undamped = np.zeros(n_points)
v_undamped = np.zeros(n_points)
x_undamped[0] = 1.5
v_undamped[0] = 0.0

for i in range(1, n_points):
    a = -(omega**2) * x_undamped[i - 1]
    v_undamped[i] = v_undamped[i - 1] + a * dt
    x_undamped[i] = x_undamped[i - 1] + v_undamped[i] * dt

# Custom style for large canvas
custom_style = Style(
    background="white",
    plot_background="white",
    foreground="#333333",
    foreground_strong="#333333",
    foreground_subtle="#666666",
    colors=("#306998", "#FFD43B", "#FF6B6B"),
    title_font_size=60,
    label_font_size=40,
    major_label_font_size=36,
    legend_font_size=36,
    value_font_size=28,
    stroke_width=4,
    opacity=0.85,
    opacity_hover=1.0,
)

# Create XY chart (scatter plot with lines)
chart = pygal.XY(
    width=4800,
    height=2700,
    style=custom_style,
    title="phase-diagram · pygal · pyplots.ai",
    x_title="Position x",
    y_title="Velocity dx/dt",
    show_dots=False,  # Lines only for smooth trajectory
    stroke=True,
    fill=False,
    show_x_guides=True,
    show_y_guides=True,
    dots_size=3,
    stroke_style={"width": 4},
    legend_at_bottom=True,
    legend_box_size=24,
    truncate_legend=-1,
    show_legend=True,
)

# Downsample for visualization (pygal works better with fewer points)
step = 3
damped_points = [(float(x[i]), float(v[i])) for i in range(0, n_points, step)]
undamped_points = [(float(x_undamped[i]), float(v_undamped[i])) for i in range(0, n_points, step)]

# Add trajectories
chart.add("Damped Oscillator (γ=0.3)", damped_points)
chart.add("Undamped Oscillator (Limit Cycle)", undamped_points)

# Add fixed point marker at origin
chart.add("Equilibrium (Fixed Point)", [(0, 0)], dots_size=12, show_dots=True, stroke=False)

# Save outputs
chart.render_to_file("plot.html")
chart.render_to_png("plot.png")
Runnable source as JSON, for any HTTP client: https://api.anyplot.ai/specs/phase-diagram/pygal/code. Any spec id and library id listed in llms-full.txt fit the same URL shape; every URL below is complete and callable.
{
  "spec_id": "phase-diagram",
  "language": "python",
  "library": "pygal",
  "page": "https://anyplot.ai/phase-diagram/python/pygal",
  "hub": "https://anyplot.ai/phase-diagram",
  "code_json": "https://api.anyplot.ai/specs/phase-diagram/pygal/code",
  "spec_json": "https://api.anyplot.ai/specs/phase-diagram",
  "render_light_png": "https://storage.googleapis.com/anyplot-images/plots/phase-diagram/python/pygal/plot-light.png",
  "render_dark_png": "https://storage.googleapis.com/anyplot-images/plots/phase-diagram/python/pygal/plot-dark.png",
  "interactive_light_html": "https://storage.googleapis.com/anyplot-images/plots/phase-diagram/python/pygal/plot-light.html",
  "interactive_dark_html": "https://storage.googleapis.com/anyplot-images/plots/phase-diagram/python/pygal/plot-dark.html",
  "quality_score": 81.0,
  "license": "MIT",
  "guide": "https://anyplot.ai/llms.txt"
}
Part of Phase Diagram (State Space Plot) on anyplot.ai.