The same plot in 14 other libraries — JavaScript: Chart.js, D3.js, Apache ECharts, Highcharts; Python: Altair, Bokeh, lets-plot, Matplotlib, Plotly, plotnine, Pygal, Seaborn; R: ggplot2; Julia: Makie.jl. Compare all 15 side by side: Phase Diagram (State Space Plot) in Python, R, Julia and JavaScript.
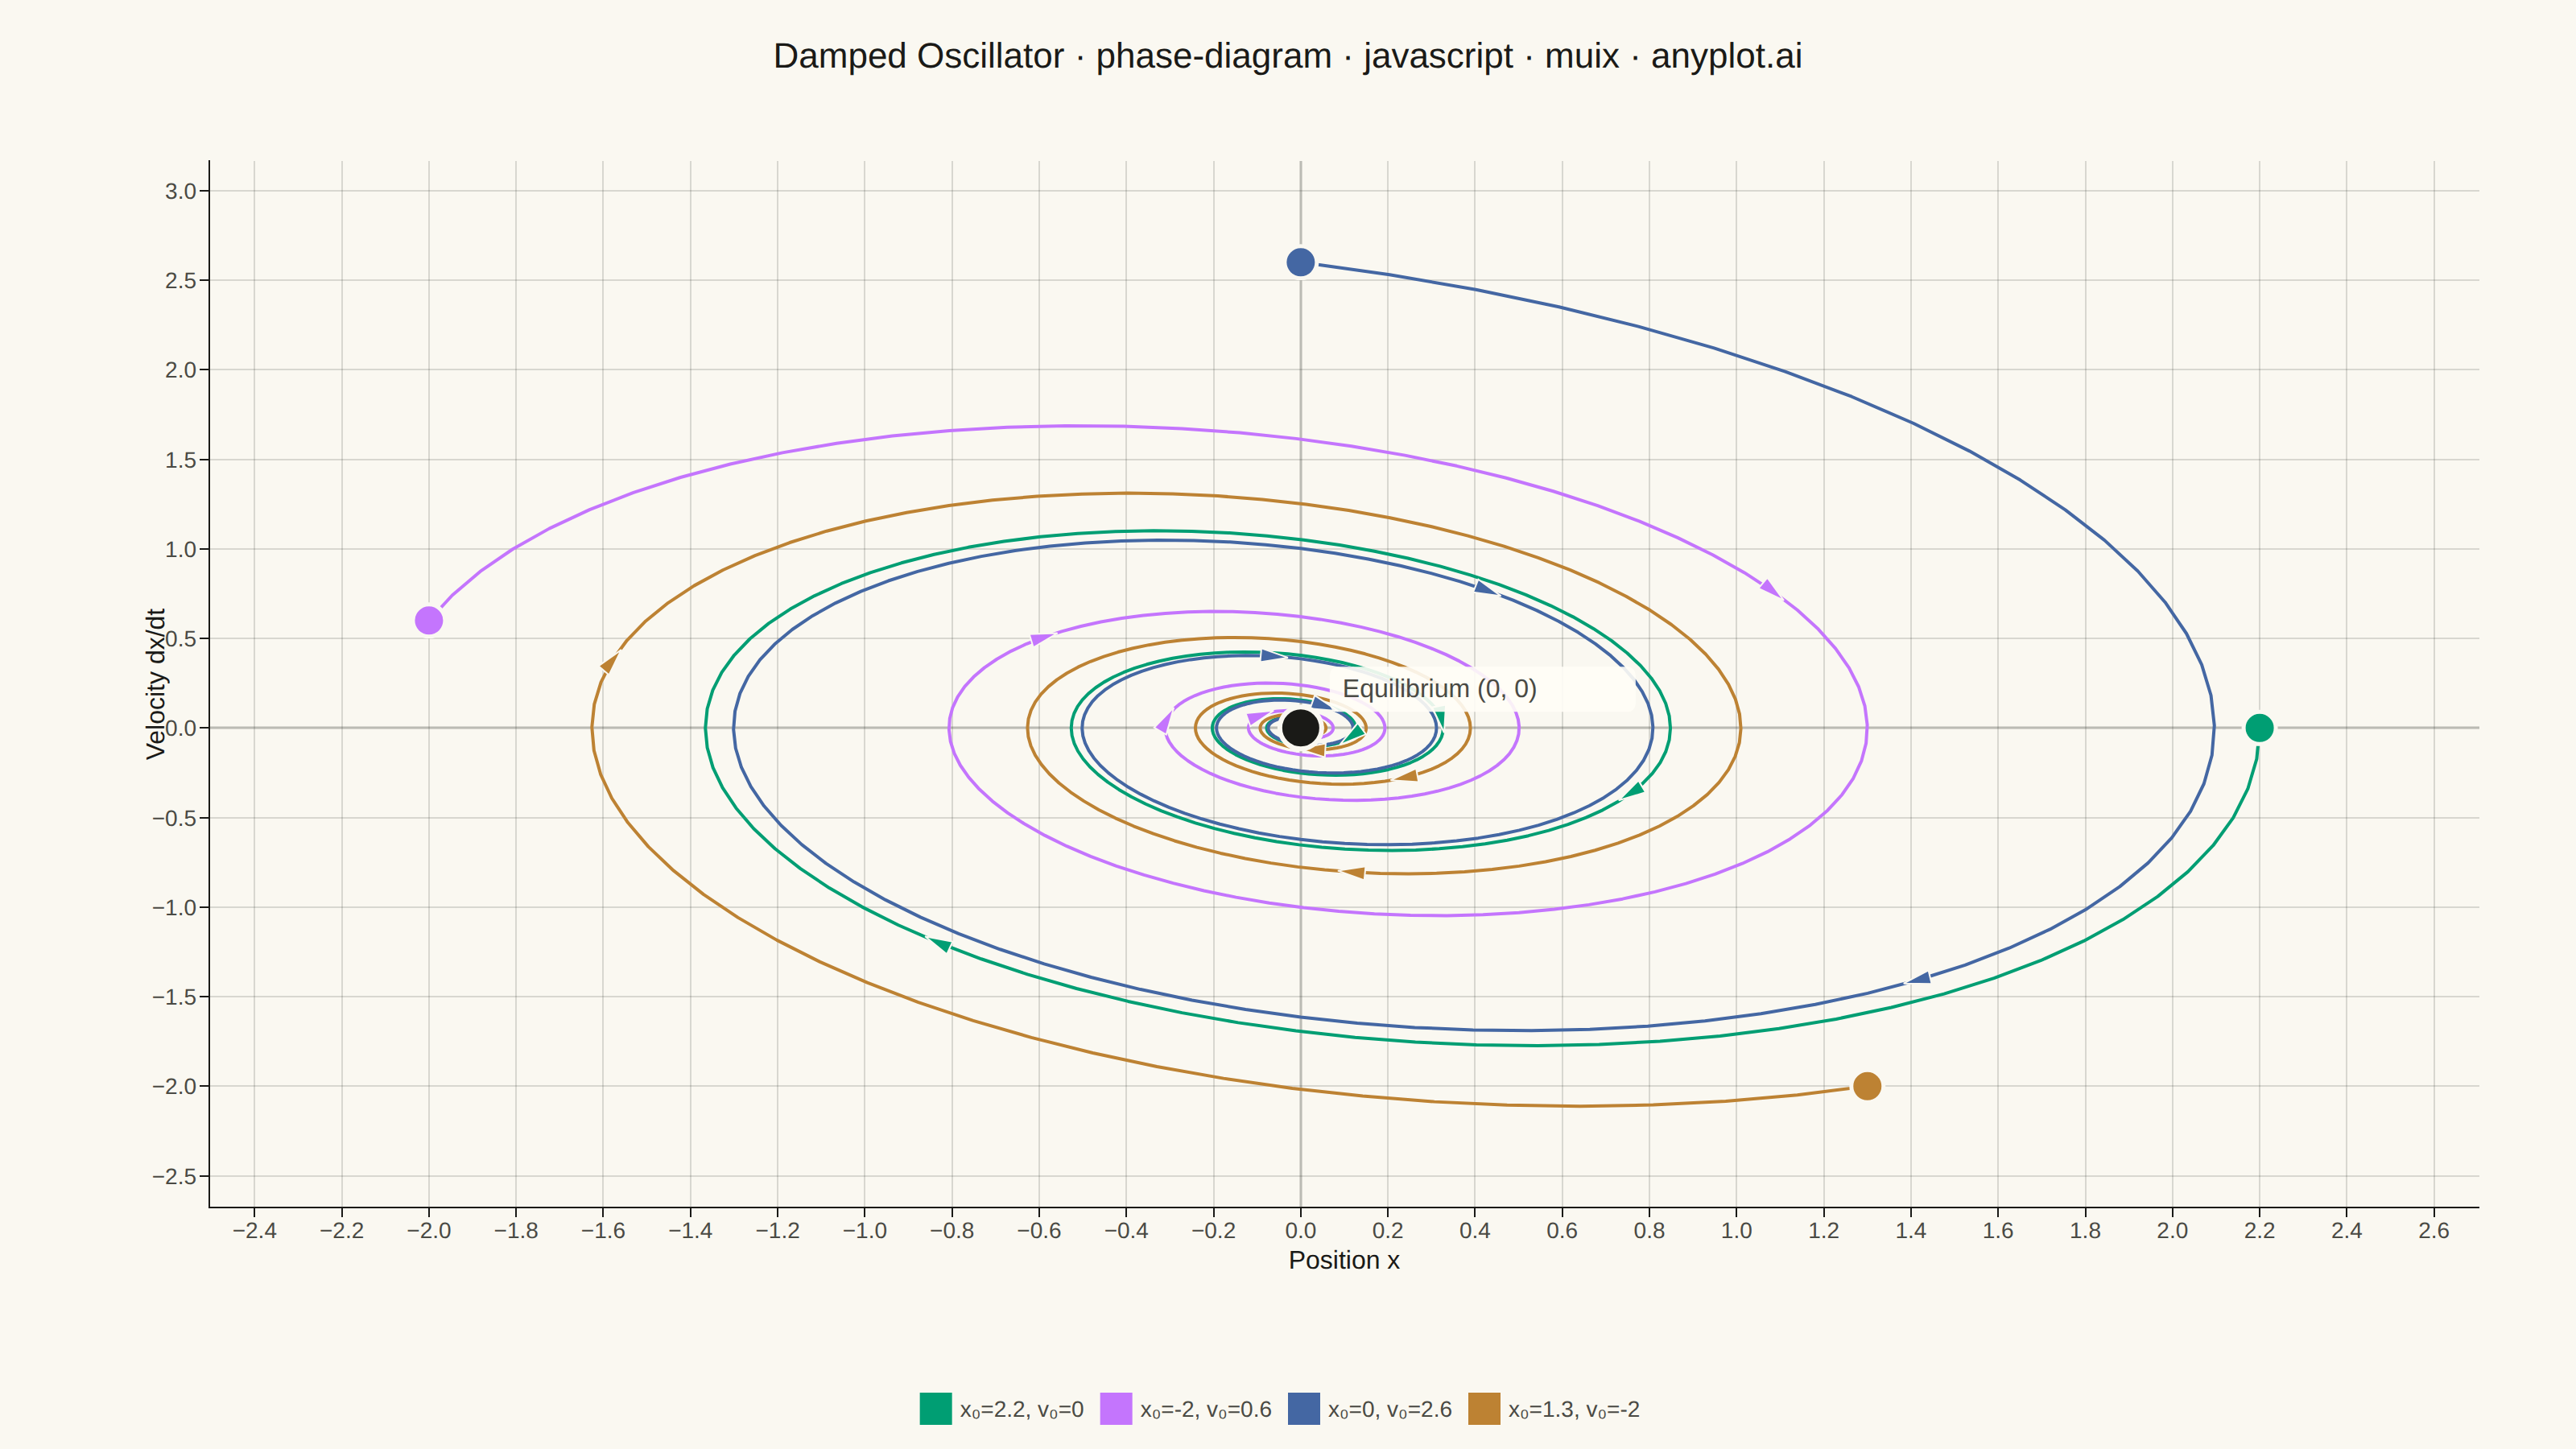
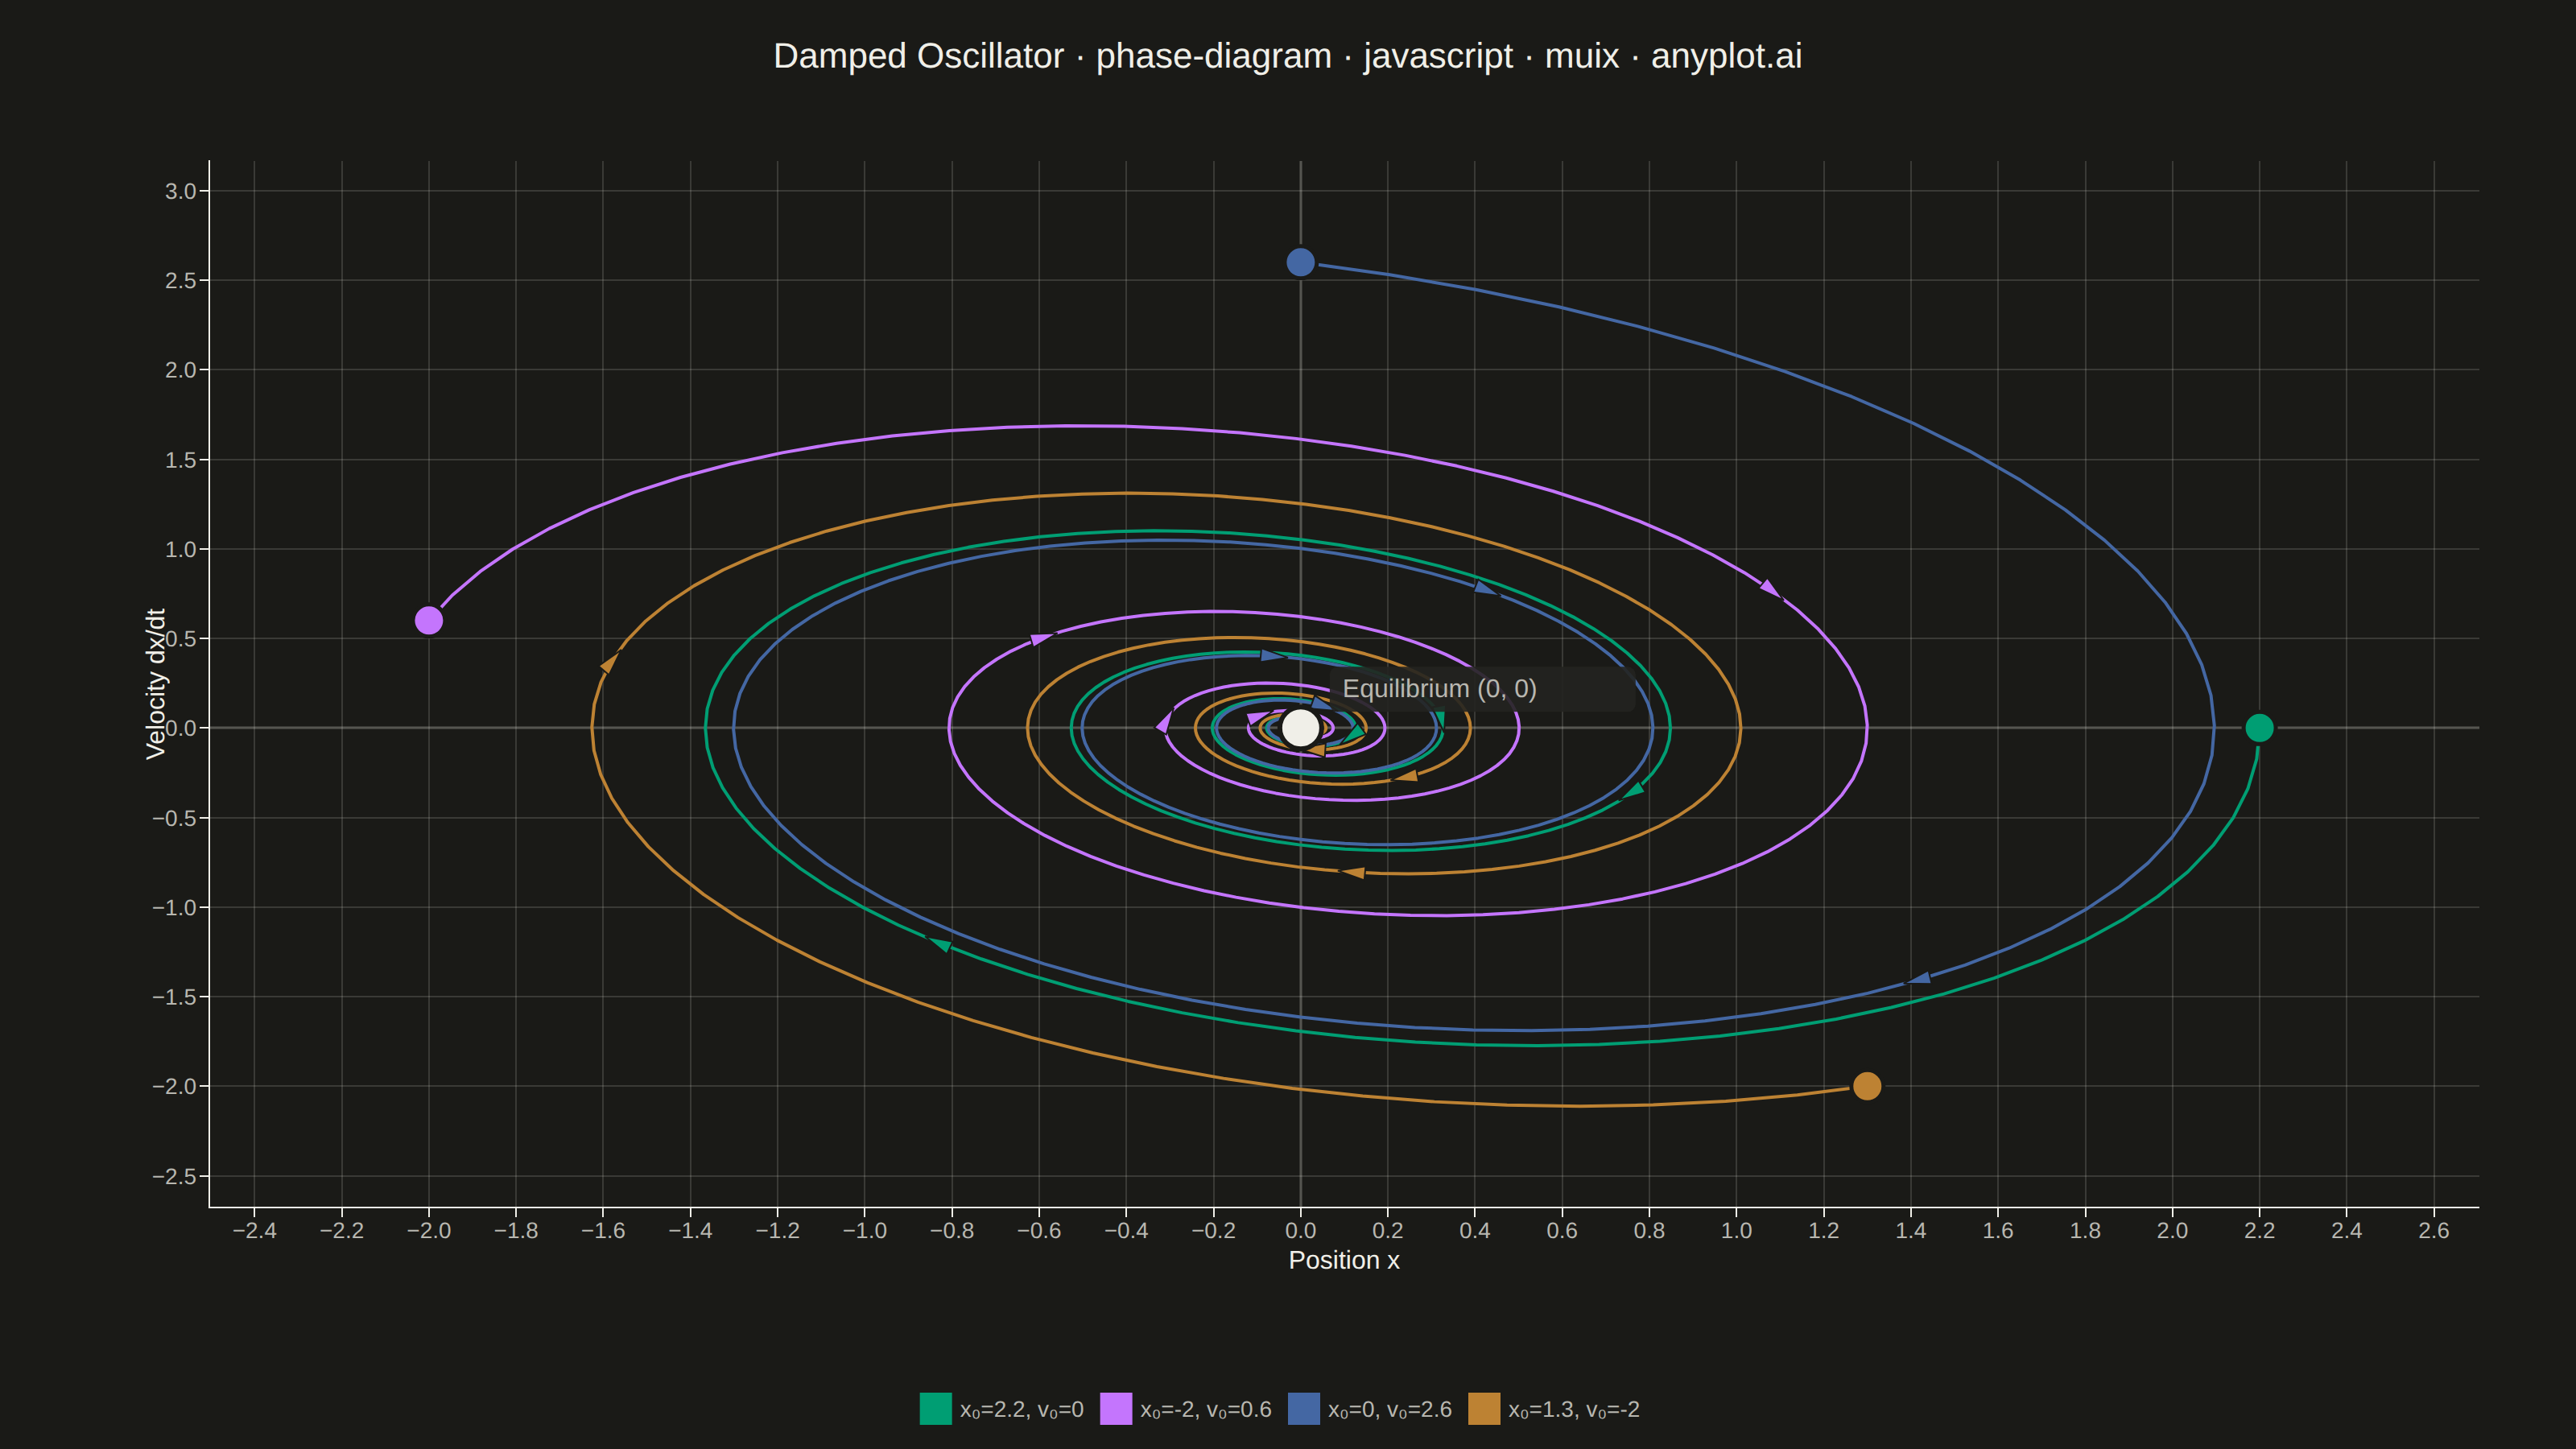
A phase diagram (or state space plot) displays the trajectory of a dynamical system by plotting a variable against its derivative (x vs dx/dt). This visualization reveals the qualitative behavior of systems including fixed points, limit cycles, stability, and oscillation patterns. It is essential for analyzing differential equations without solving them explicitly.
// anyplot.ai
// phase-diagram: Phase Diagram (State Space Plot)
// Library: muix 7.29.1 | JavaScript 22.23.2
// Quality: 93/100 | Created: 2026-09-05
import { ChartContainer } from "@mui/x-charts/ChartContainer";
import { LinePlot } from "@mui/x-charts/LineChart";
import { ChartsXAxis } from "@mui/x-charts/ChartsXAxis";
import { ChartsYAxis } from "@mui/x-charts/ChartsYAxis";
import { ChartsGrid } from "@mui/x-charts/ChartsGrid";
import { ChartsReferenceLine } from "@mui/x-charts/ChartsReferenceLine";
import { ChartsLegend } from "@mui/x-charts/ChartsLegend";
import { ChartsText } from "@mui/x-charts/ChartsText";
import { useXScale, useYScale } from "@mui/x-charts/hooks";

const t = window.ANYPLOT_TOKENS;

// --- Damped harmonic oscillator: x'' + 2*ZETA*OMEGA*x' + OMEGA^2*x = 0 ------
// A linear system has a closed-form underdamped solution, so every
// trajectory is generated analytically instead of via numeric integration.
const OMEGA = 1; // natural frequency, rad/s
const ZETA = 0.15; // damping ratio (< 1 -> underdamped, spirals to the origin)
const OMEGA_D = OMEGA * Math.sqrt(1 - ZETA * ZETA);
const STEPS_PER_TRAJECTORY = 360;
const T_MAX = (4.5 * 2 * Math.PI) / OMEGA_D; // ~4.5 decaying oscillation periods

function trajectory(x0, v0) {
  const A = x0;
  const B = (v0 + ZETA * OMEGA * A) / OMEGA_D;
  const x = [];
  const v = [];
  for (let i = 0; i <= STEPS_PER_TRAJECTORY; i++) {
    const time = (i / STEPS_PER_TRAJECTORY) * T_MAX;
    const decay = Math.exp(-ZETA * OMEGA * time);
    const cosTerm = Math.cos(OMEGA_D * time);
    const sinTerm = Math.sin(OMEGA_D * time);
    x.push(decay * (A * cosTerm + B * sinTerm));
    v.push(
      decay *
        (-ZETA * OMEGA * (A * cosTerm + B * sinTerm) +
          OMEGA_D * (-A * sinTerm + B * cosTerm)),
    );
  }
  return { x, v, x0, v0 };
}

// --- Data: four initial conditions spiralling into the same equilibrium —
// together they trace the shared basin of attraction. Each trajectory gets
// its own xAxisId because x is non-monotonic (a spiral revisits x values),
// which rules out a single shared/sorted xAxis. -----------------------------
const trajectories = [
  trajectory(2.2, 0),
  trajectory(-2.0, 0.6),
  trajectory(0, 2.6),
  trajectory(1.3, -2.0),
].map((traj, i) => ({
  ...traj,
  axisId: `x-axis-${i}`,
  color: t.palette[i],
  label: `x₀=${traj.x0}, v₀=${traj.v0}`,
}));

const allX = trajectories.flatMap((traj) => traj.x);
const allV = trajectories.flatMap((traj) => traj.v);
const xSpan = Math.max(...allX) - Math.min(...allX);
const vSpan = Math.max(...allV) - Math.min(...allV);
const X_MIN = Math.min(...allX) - xSpan * 0.12;
const X_MAX = Math.max(...allX) + xSpan * 0.12;
const V_MIN = Math.min(...allV) - vSpan * 0.12;
const V_MAX = Math.max(...allV) + vSpan * 0.12;

const TITLE =
  "Damped Oscillator · phase-diagram · javascript · muix · anyplot.ai";
const TITLE_HEIGHT = 70;
const TITLE_FONT_SIZE = Math.max(
  15,
  Math.round(22 * Math.min(1, 67 / TITLE.length)),
);

const MARGIN = { top: 30, bottom: 150, left: 130, right: 60 };

// --- Time-direction arrowheads: small triangles dropped at fixed points
// along each trajectory's arc (as fractions of its 0..STEPS_PER_TRAJECTORY
// index range), oriented along the local tangent. The spec explicitly
// suggests a direction cue since motion along a spiral is otherwise
// ambiguous in a static render. -------------------------------------------
const ARROW_FRACTIONS = [0.08, 0.24, 0.44, 0.68];
const ARROW_TANGENT_STEP = 2;
const ARROW_SIZE = 9;
const ARROW_SPREAD = 0.5; // radians between each back corner and the tip

function arrowPoints(cx, cy, angle, size) {
  const backAngle = angle + Math.PI;
  const tip = [cx + Math.cos(angle) * size, cy + Math.sin(angle) * size];
  const left = [
    cx + Math.cos(backAngle - ARROW_SPREAD) * size,
    cy + Math.sin(backAngle - ARROW_SPREAD) * size,
  ];
  const right = [
    cx + Math.cos(backAngle + ARROW_SPREAD) * size,
    cy + Math.sin(backAngle + ARROW_SPREAD) * size,
  ];
  return `${tip.join(",")} ${left.join(",")} ${right.join(",")}`;
}

// --- Custom overlay: the shared equilibrium, each trajectory's starting
// point, and direction-of-travel arrowheads. Community `@mui/x-charts/hooks`
// (useXScale/useYScale) map data coordinates to pixels so the markers stay
// aligned with the lines at any size. Hooks are called unconditionally, once
// per (fixed) trajectory. ---------------------------------------------------
function PhaseMarkers() {
  const yScale = useYScale();
  const xScale0 = useXScale(trajectories[0].axisId);
  const xScale1 = useXScale(trajectories[1].axisId);
  const xScale2 = useXScale(trajectories[2].axisId);
  const xScale3 = useXScale(trajectories[3].axisId);
  const xScales = [xScale0, xScale1, xScale2, xScale3];

  const origin = { x: xScale0(0), y: yScale(0) };

  return (
    <g>
      {trajectories.map((traj, i) => {
        const xScale = xScales[i];
        const start = { x: xScale(traj.x[0]), y: yScale(traj.v[0]) };
        return (
          <g key={traj.axisId}>
            {ARROW_FRACTIONS.map((frac) => {
              const idx = Math.round(frac * STEPS_PER_TRAJECTORY);
              const p0 = { x: xScale(traj.x[idx]), y: yScale(traj.v[idx]) };
              const p1 = {
                x: xScale(traj.x[idx + ARROW_TANGENT_STEP]),
                y: yScale(traj.v[idx + ARROW_TANGENT_STEP]),
              };
              const angle = Math.atan2(p1.y - p0.y, p1.x - p0.x);
              return (
                <polygon
                  key={`${traj.axisId}-arrow-${frac}`}
                  points={arrowPoints(p0.x, p0.y, angle, ARROW_SIZE)}
                  fill={traj.color}
                  stroke={t.pageBg}
                  strokeWidth={1}
                />
              );
            })}
            <circle
              cx={start.x}
              cy={start.y}
              r={10}
              fill={traj.color}
              stroke={t.pageBg}
              strokeWidth={2.5}
            />
          </g>
        );
      })}
      <circle
        cx={origin.x}
        cy={origin.y}
        r={13}
        fill={t.ink}
        stroke={t.pageBg}
        strokeWidth={3}
      />
      {/* Backing plate keeps the label legible over the densely wound spirals */}
      <rect
        x={origin.x + 18}
        y={origin.y - 38}
        width={190}
        height={28}
        rx={5}
        fill={t.elevatedBg}
        opacity={0.9}
      />
      <ChartsText
        x={origin.x + 26}
        y={origin.y - 24}
        text="Equilibrium (0, 0)"
        style={{ fontSize: 16, fill: t.inkSoft, dominantBaseline: "central" }}
      />
    </g>
  );
}

// --- Chart (default-exported component — the harness mounts it) -------------
export default function Chart() {
  return (
    <div
      style={{
        width: window.ANYPLOT_SIZE.width,
        height: window.ANYPLOT_SIZE.height,
        display: "flex",
        flexDirection: "column",
      }}
    >
      <div
        style={{
          height: TITLE_HEIGHT,
          display: "flex",
          alignItems: "center",
          justifyContent: "center",
          fontSize: TITLE_FONT_SIZE,
          fontWeight: 500,
          color: t.ink,
        }}
      >
        {TITLE}
      </div>
      <ChartContainer
        width={window.ANYPLOT_SIZE.width}
        height={window.ANYPLOT_SIZE.height - TITLE_HEIGHT}
        margin={MARGIN}
        skipAnimation
        xAxis={trajectories.map((traj) => ({
          id: traj.axisId,
          scaleType: "linear",
          data: traj.x,
          min: X_MIN,
          max: X_MAX,
        }))}
        yAxis={[{ scaleType: "linear", min: V_MIN, max: V_MAX }]}
        series={trajectories.map((traj) => ({
          type: "line",
          data: traj.v,
          xAxisId: traj.axisId,
          color: traj.color,
          label: traj.label,
          curve: "linear",
          showMark: false,
        }))}
      >
        <ChartsGrid horizontal vertical />
        <ChartsReferenceLine
          x={0}
          lineStyle={{ stroke: t.grid, strokeWidth: 2 }}
        />
        <ChartsReferenceLine
          y={0}
          lineStyle={{ stroke: t.grid, strokeWidth: 2 }}
        />
        <LinePlot />
        <PhaseMarkers />
        <ChartsXAxis
          axisId={trajectories[0].axisId}
          label="Position x"
          labelStyle={{ fontSize: 16, fill: t.ink, fontWeight: 500 }}
          tickLabelStyle={{ fontSize: 14, fill: t.inkSoft }}
          stroke={t.inkSoft}
        />
        <ChartsYAxis
          label="Velocity dx/dt"
          labelStyle={{ fontSize: 16, fill: t.ink, fontWeight: 500 }}
          tickLabelStyle={{ fontSize: 14, fill: t.inkSoft }}
          stroke={t.inkSoft}
        />
        <ChartsLegend
          direction="row"
          position={{ vertical: "bottom", horizontal: "middle" }}
          slotProps={{
            legend: { labelStyle: { fontSize: 14, fill: t.inkSoft } },
          }}
        />
      </ChartContainer>
    </div>
  );
}
Runnable source as JSON, for any HTTP client: https://api.anyplot.ai/specs/phase-diagram/muix/code. Any spec id and library id listed in llms-full.txt fit the same URL shape; every URL below is complete and callable.
{
  "spec_id": "phase-diagram",
  "language": "javascript",
  "library": "muix",
  "page": "https://anyplot.ai/phase-diagram/javascript/muix",
  "hub": "https://anyplot.ai/phase-diagram",
  "code_json": "https://api.anyplot.ai/specs/phase-diagram/muix/code",
  "spec_json": "https://api.anyplot.ai/specs/phase-diagram",
  "render_light_png": "https://storage.googleapis.com/anyplot-images/plots/phase-diagram/javascript/muix/plot-light.png",
  "render_dark_png": "https://storage.googleapis.com/anyplot-images/plots/phase-diagram/javascript/muix/plot-dark.png",
  "interactive_light_html": "https://storage.googleapis.com/anyplot-images/plots/phase-diagram/javascript/muix/plot-light.html",
  "interactive_dark_html": "https://storage.googleapis.com/anyplot-images/plots/phase-diagram/javascript/muix/plot-dark.html",
  "quality_score": 93.0,
  "license": "MIT",
  "guide": "https://anyplot.ai/llms.txt"
}
Part of Phase Diagram (State Space Plot) on anyplot.ai.