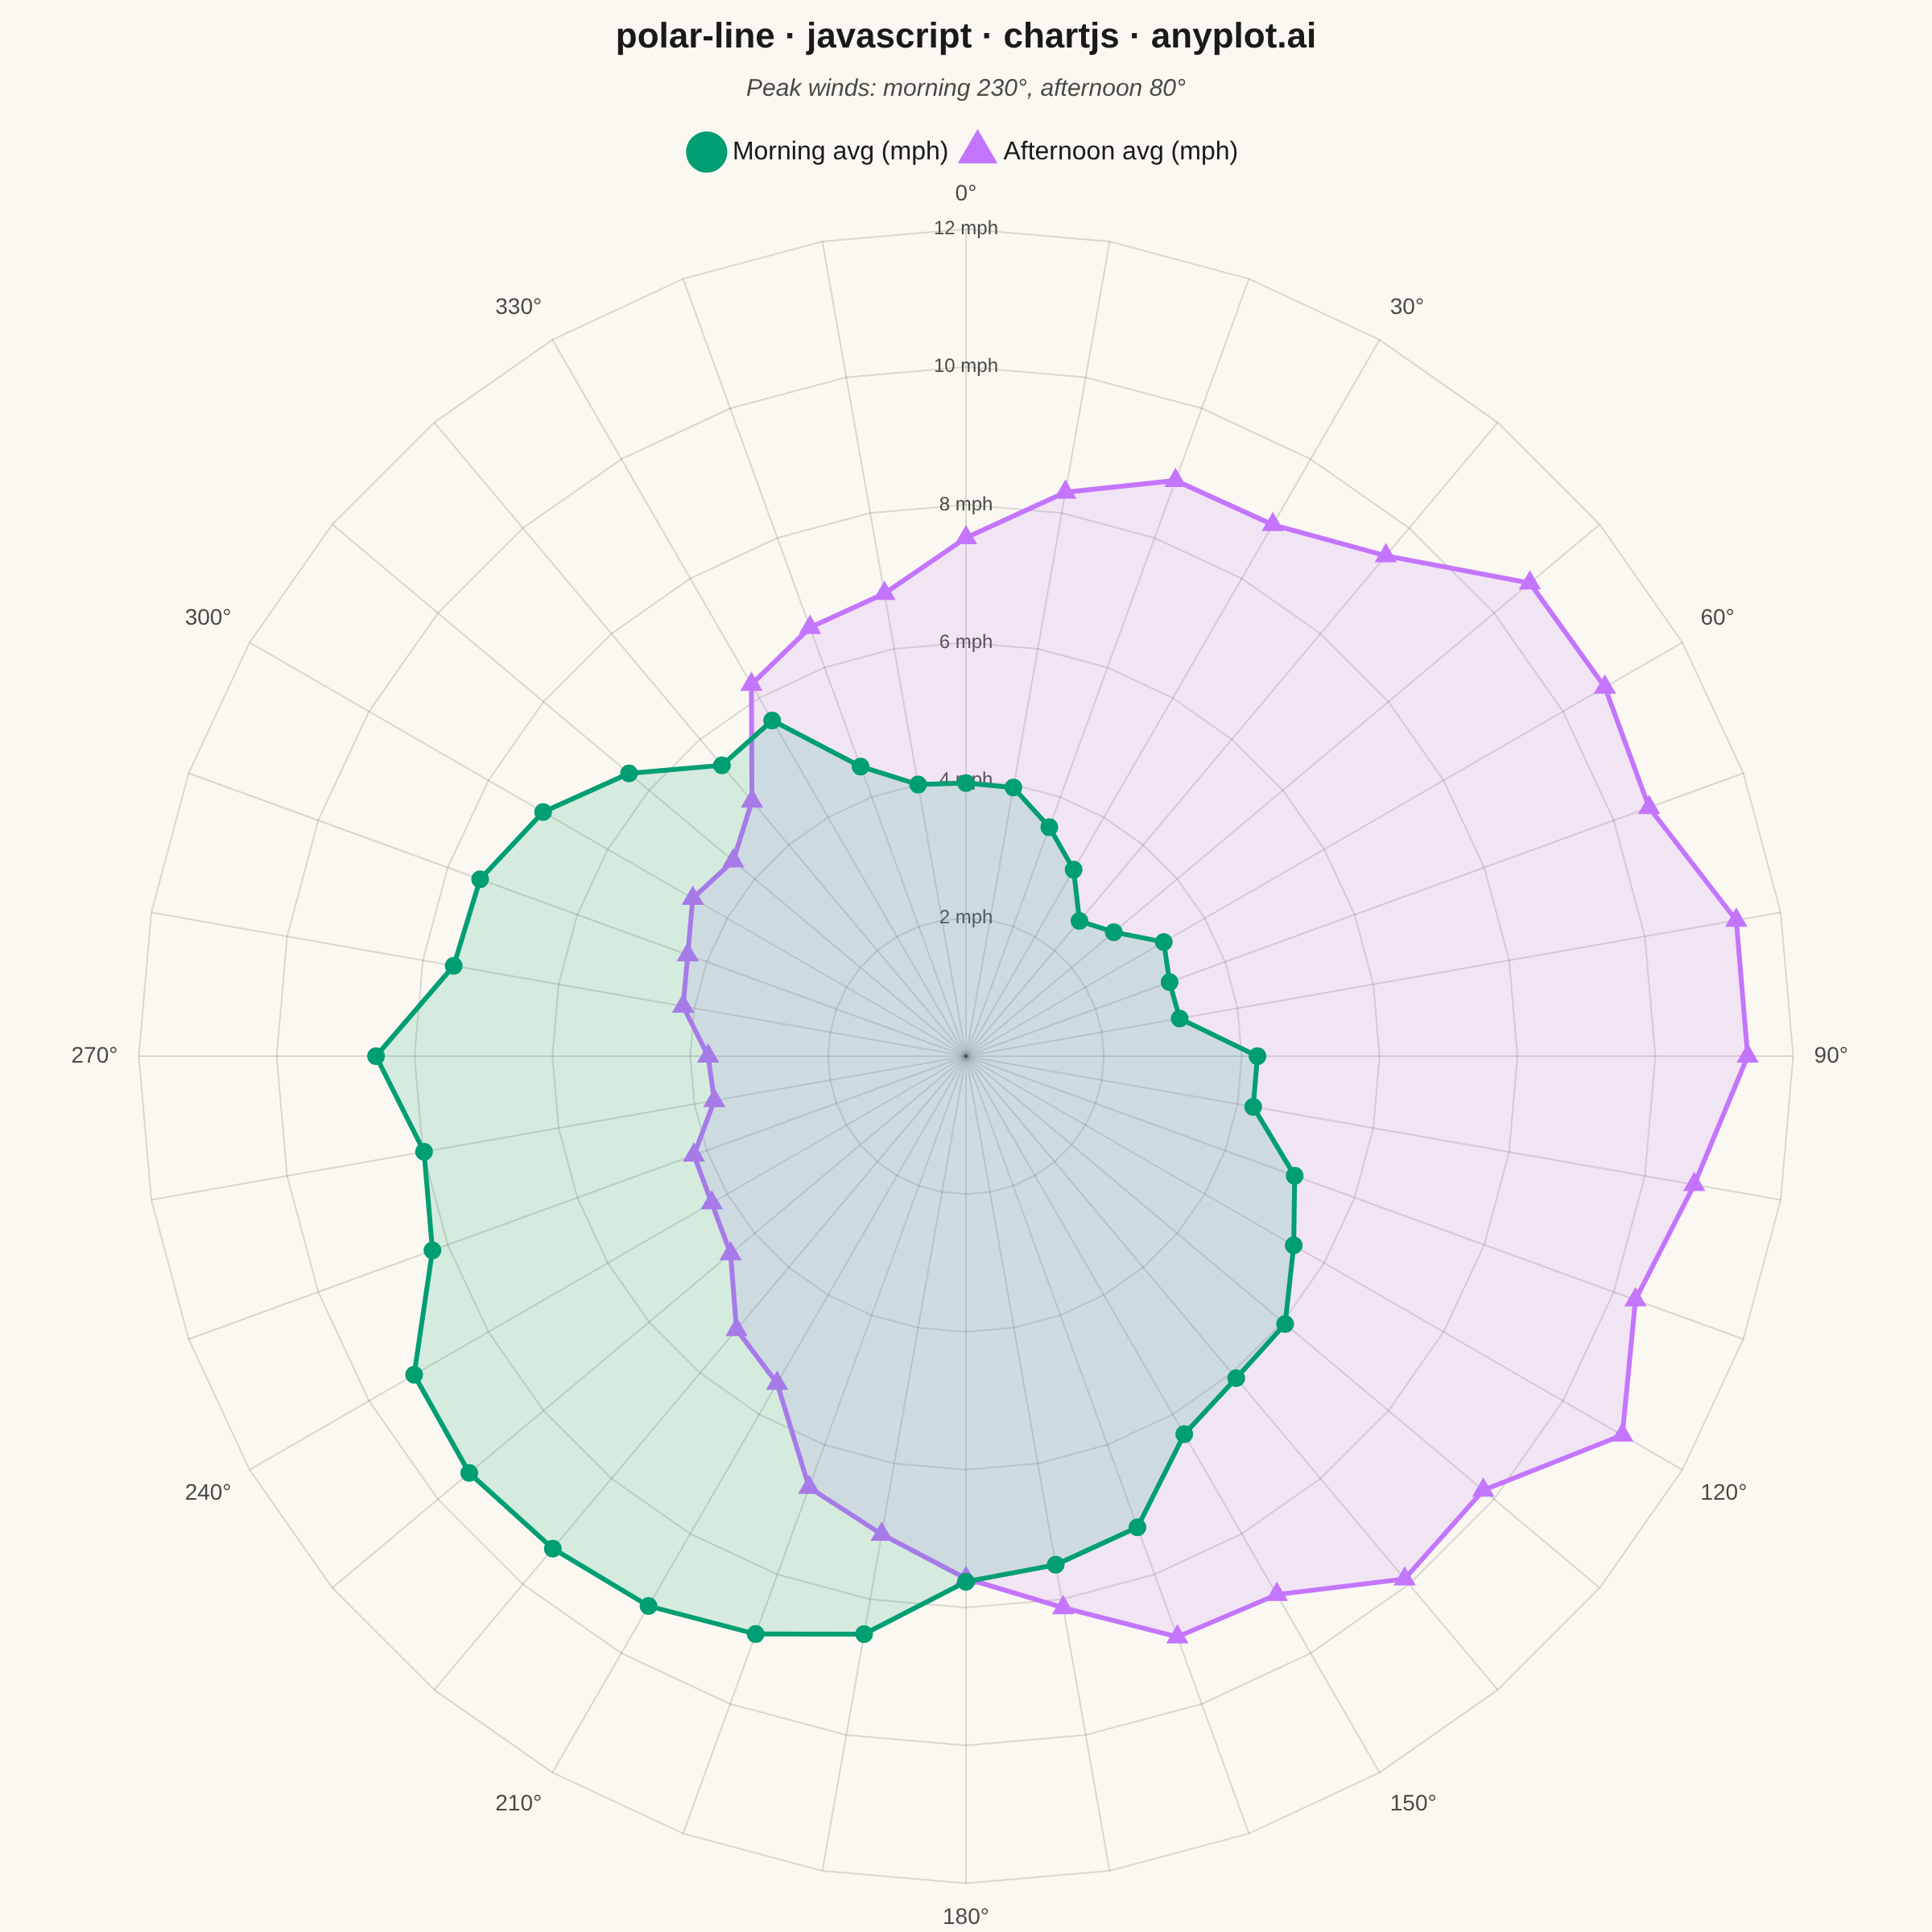
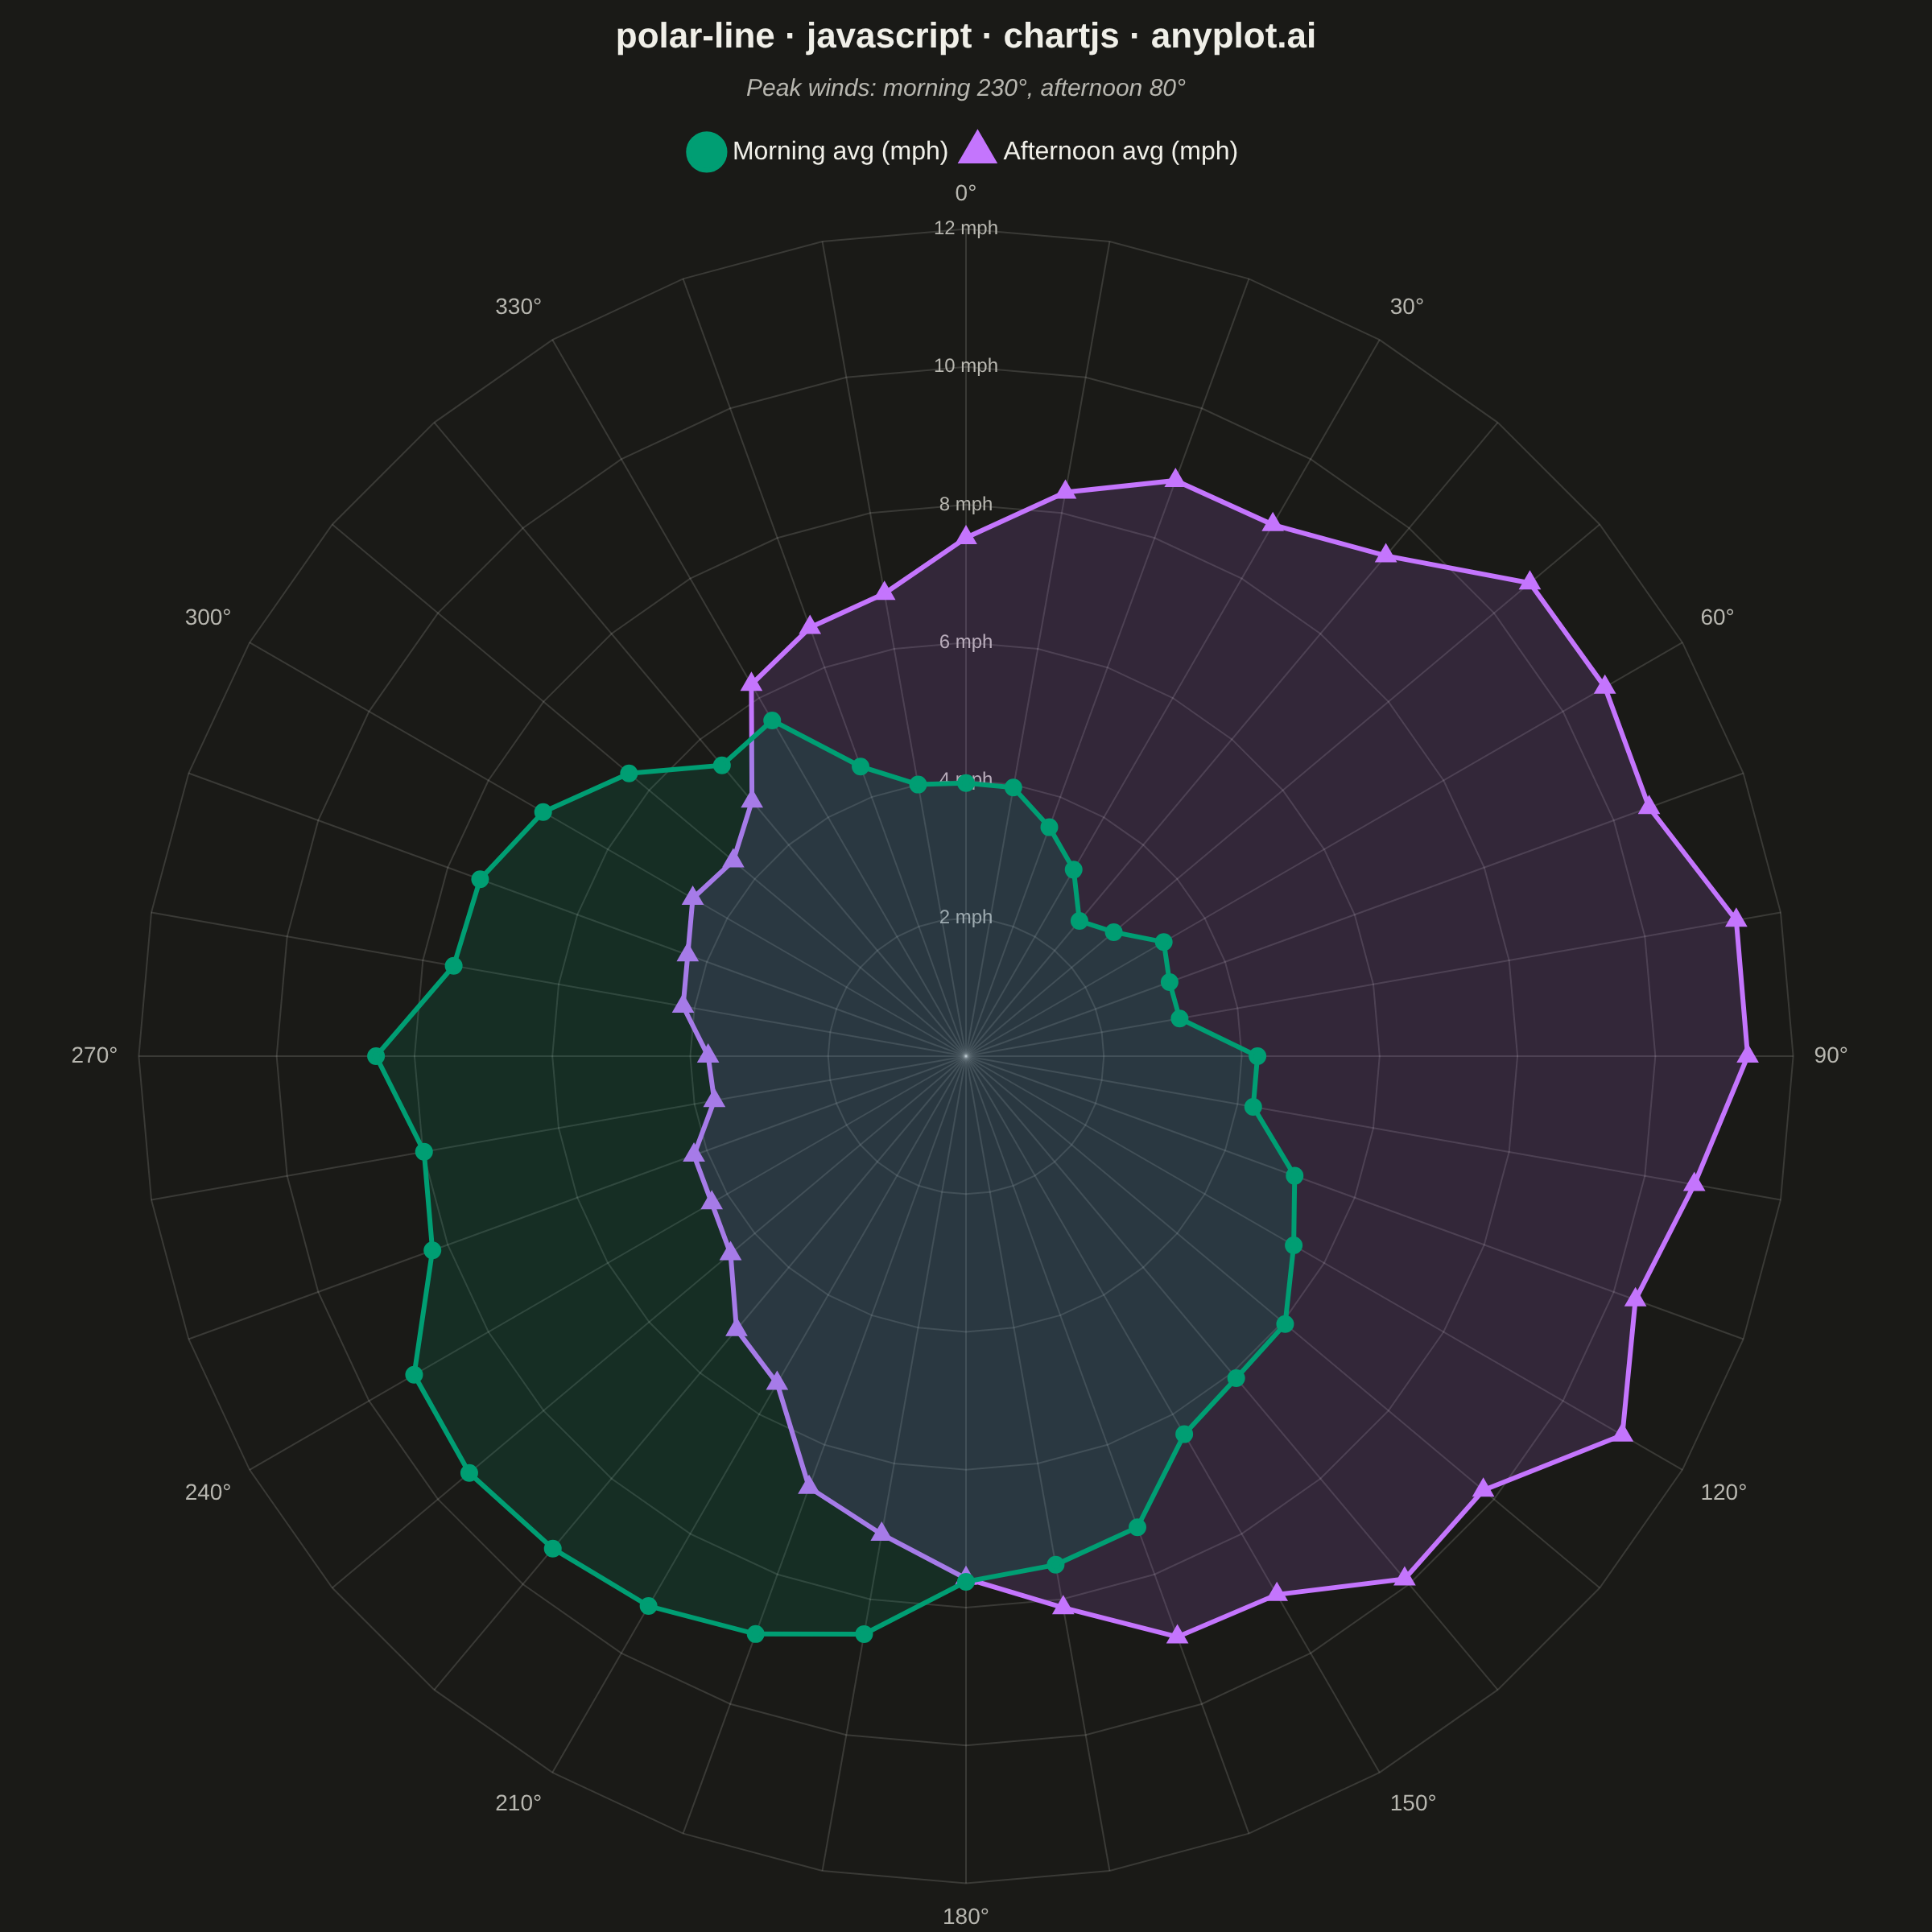
The same plot in 14 other libraries — JavaScript: D3.js, Apache ECharts, Highcharts, MUI X Charts; Python: Altair, Bokeh, lets-plot, Matplotlib, Plotly, plotnine, Pygal, Seaborn; R: ggplot2; Julia: Makie.jl. Compare all 15 side by side: Polar Line Plot in Python, R, Julia and JavaScript.
A line plot rendered in polar coordinates, where data points are connected with lines around a circular axis. The angle (theta) typically represents a cyclical variable while the radius shows magnitude.
// anyplot.ai
// polar-line: Polar Line Plot
// Library: chartjs 4.4.7 | JavaScript 22.23.2
// Quality: 87/100 | Created: 2026-09-05

//# anyplot-orientation: square

const t = window.ANYPLOT_TOKENS;

// --- Data: average wind speed (mph) by compass direction, morning vs afternoon ---
// Chart.js has no continuous polar-line primitive; the "radar" chart type is a
// line plot in polar coordinates with evenly-spaced angular axes, which is
// exactly the spec's shape (theta = direction, radius = magnitude, line
// connects points in theta order, closing the loop back to 0 degrees).
const N_DIRECTIONS = 36;
const directionLabels = [];
const morningSpeed = [];
const afternoonSpeed = [];

// Tiny fixed-seed LCG for deterministic jitter (browser has no seeded RNG).
let seed = 42;
function nextRandom() {
  seed = (seed * 1103515245 + 12345) % 2147483648;
  return seed / 2147483648;
}

for (let i = 0; i < N_DIRECTIONS; i++) {
  const degrees = i * (360 / N_DIRECTIONS);
  directionLabels.push(`${degrees}°`);
  const morningJitter = (nextRandom() - 0.5) * 1;
  const afternoonJitter = (nextRandom() - 0.5) * 1;
  // Prevailing-wind amplitudes toned down to a ~3x calm/dominant ratio,
  // which reads as a more believable average-wind-speed profile than the
  // ~6x swing of the previous attempt.
  morningSpeed.push(
    Math.max(2, 6 + 3 * Math.cos((degrees - 225) * (Math.PI / 180)) + morningJitter)
  );
  afternoonSpeed.push(
    Math.max(2, 7.5 + 3.5 * Math.cos((degrees - 90) * (Math.PI / 180)) + afternoonJitter)
  );
}

const morningPeakIndex = morningSpeed.indexOf(Math.max(...morningSpeed));
const afternoonPeakIndex = afternoonSpeed.indexOf(Math.max(...afternoonSpeed));

// --- Mount -----------------------------------------------------------------
const canvas = document.createElement("canvas");
document.getElementById("container").appendChild(canvas);

// --- Chart -------------------------------------------------------------------
new Chart(canvas, {
  type: "radar",
  data: {
    labels: directionLabels,
    datasets: [
      {
        label: "Morning avg (mph)",
        data: morningSpeed,
        borderColor: t.palette[0],
        pointBackgroundColor: t.palette[0],
        pointStyle: "circle",
        pointRadius: 4,
        borderWidth: 3,
        backgroundColor: `${t.palette[0]}26`,
        fill: "origin",
        tension: 0,
      },
      {
        label: "Afternoon avg (mph)",
        data: afternoonSpeed,
        borderColor: t.palette[1],
        pointBackgroundColor: t.palette[1],
        pointStyle: "triangle",
        pointRadius: 5,
        borderWidth: 3,
        backgroundColor: `${t.palette[1]}26`,
        fill: "origin",
        tension: 0,
      },
    ],
  },
  options: {
    responsive: true,
    maintainAspectRatio: false,
    animation: false,
    plugins: {
      title: {
        display: true,
        text: "polar-line · javascript · chartjs · anyplot.ai",
        color: t.ink,
        font: { size: 22 },
      },
      subtitle: {
        display: true,
        text: `Peak winds: morning ${directionLabels[morningPeakIndex]}, afternoon ${directionLabels[afternoonPeakIndex]}`,
        color: t.inkSoft,
        font: { size: 15, style: "italic" },
        padding: { bottom: 12 },
      },
      legend: {
        labels: {
          color: t.ink,
          font: { size: 16 },
          usePointStyle: true,
        },
      },
    },
    scales: {
      r: {
        beginAtZero: true,
        angleLines: { color: t.grid },
        grid: { color: t.grid },
        pointLabels: {
          color: t.inkSoft,
          font: { size: 14 },
          callback: (label, index) => (index % 3 === 0 ? label : ""),
        },
        ticks: {
          color: t.inkSoft,
          backdropColor: "transparent",
          font: { size: 12 },
          callback: (value) => `${value} mph`,
        },
      },
    },
  },
});
Runnable source as JSON, for any HTTP client: https://api.anyplot.ai/specs/polar-line/chartjs/code. Any spec id and library id listed in llms-full.txt fit the same URL shape; every URL below is complete and callable.
{
  "spec_id": "polar-line",
  "language": "javascript",
  "library": "chartjs",
  "page": "https://anyplot.ai/polar-line/javascript/chartjs",
  "hub": "https://anyplot.ai/polar-line",
  "code_json": "https://api.anyplot.ai/specs/polar-line/chartjs/code",
  "spec_json": "https://api.anyplot.ai/specs/polar-line",
  "render_light_png": "https://storage.googleapis.com/anyplot-images/plots/polar-line/javascript/chartjs/plot-light.png",
  "render_dark_png": "https://storage.googleapis.com/anyplot-images/plots/polar-line/javascript/chartjs/plot-dark.png",
  "interactive_light_html": "https://storage.googleapis.com/anyplot-images/plots/polar-line/javascript/chartjs/plot-light.html",
  "interactive_dark_html": "https://storage.googleapis.com/anyplot-images/plots/polar-line/javascript/chartjs/plot-dark.html",
  "quality_score": 87.0,
  "license": "MIT",
  "guide": "https://anyplot.ai/llms.txt"
}
Part of Polar Line Plot on anyplot.ai.