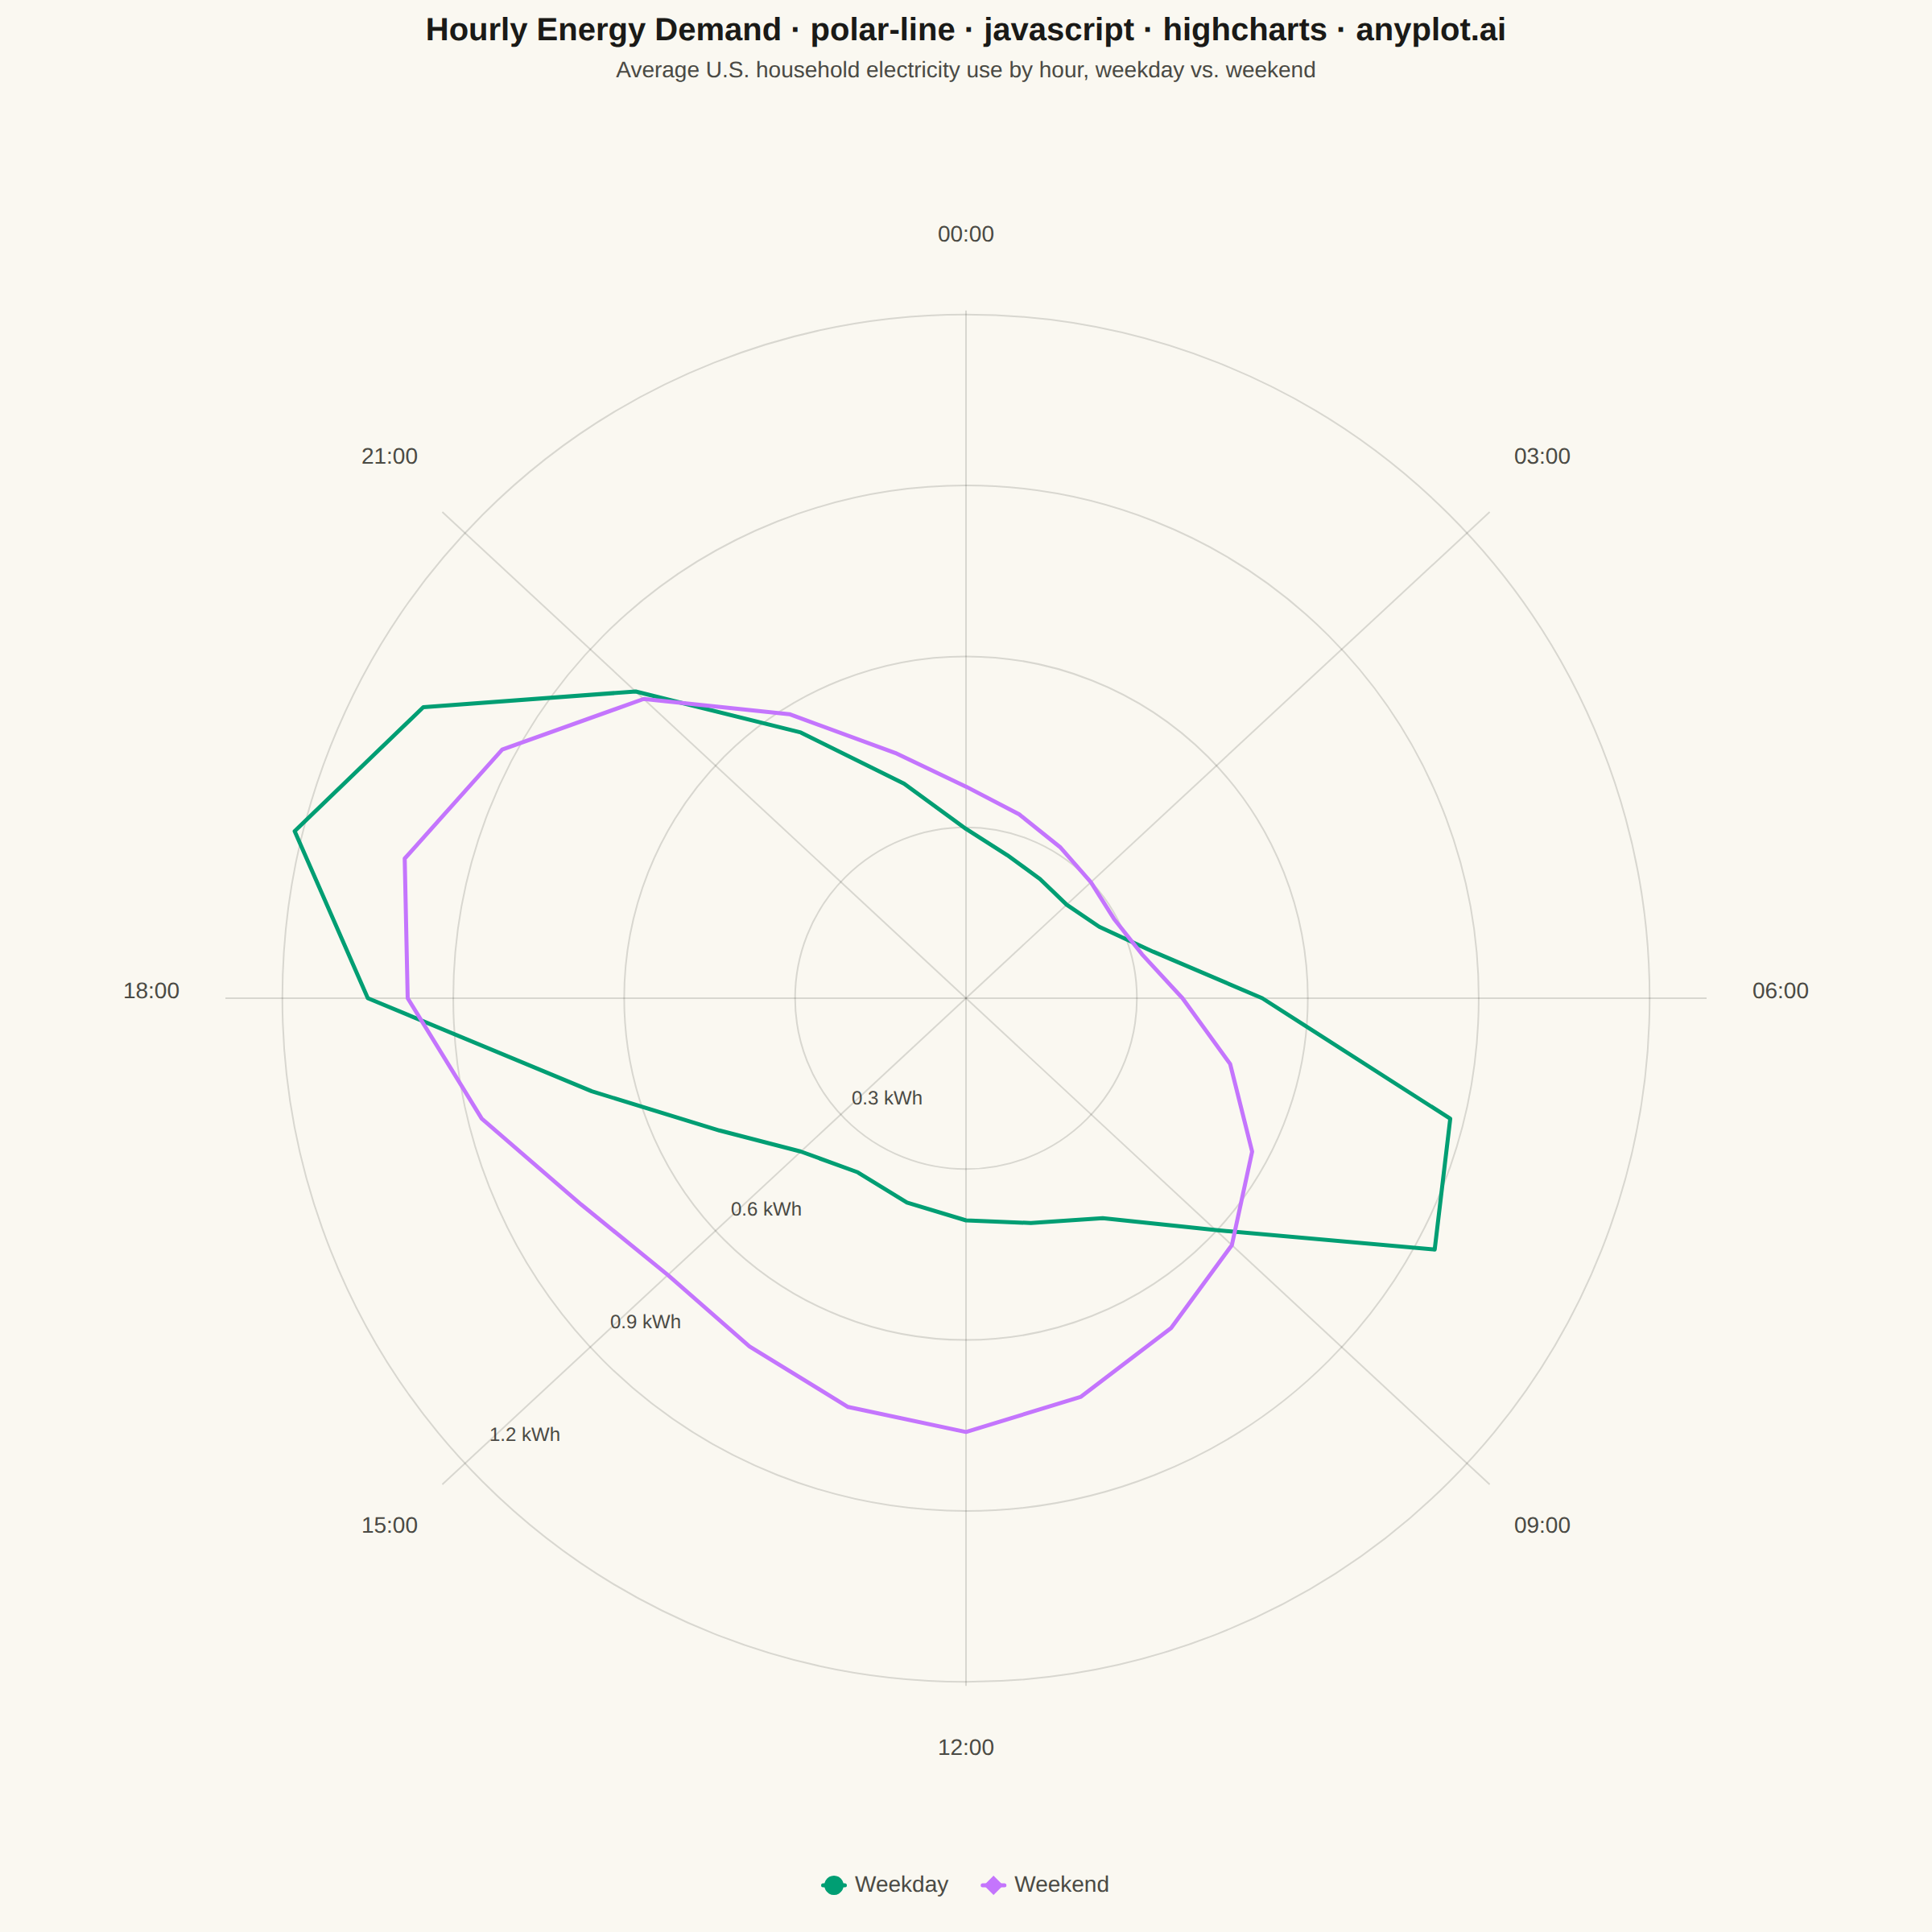
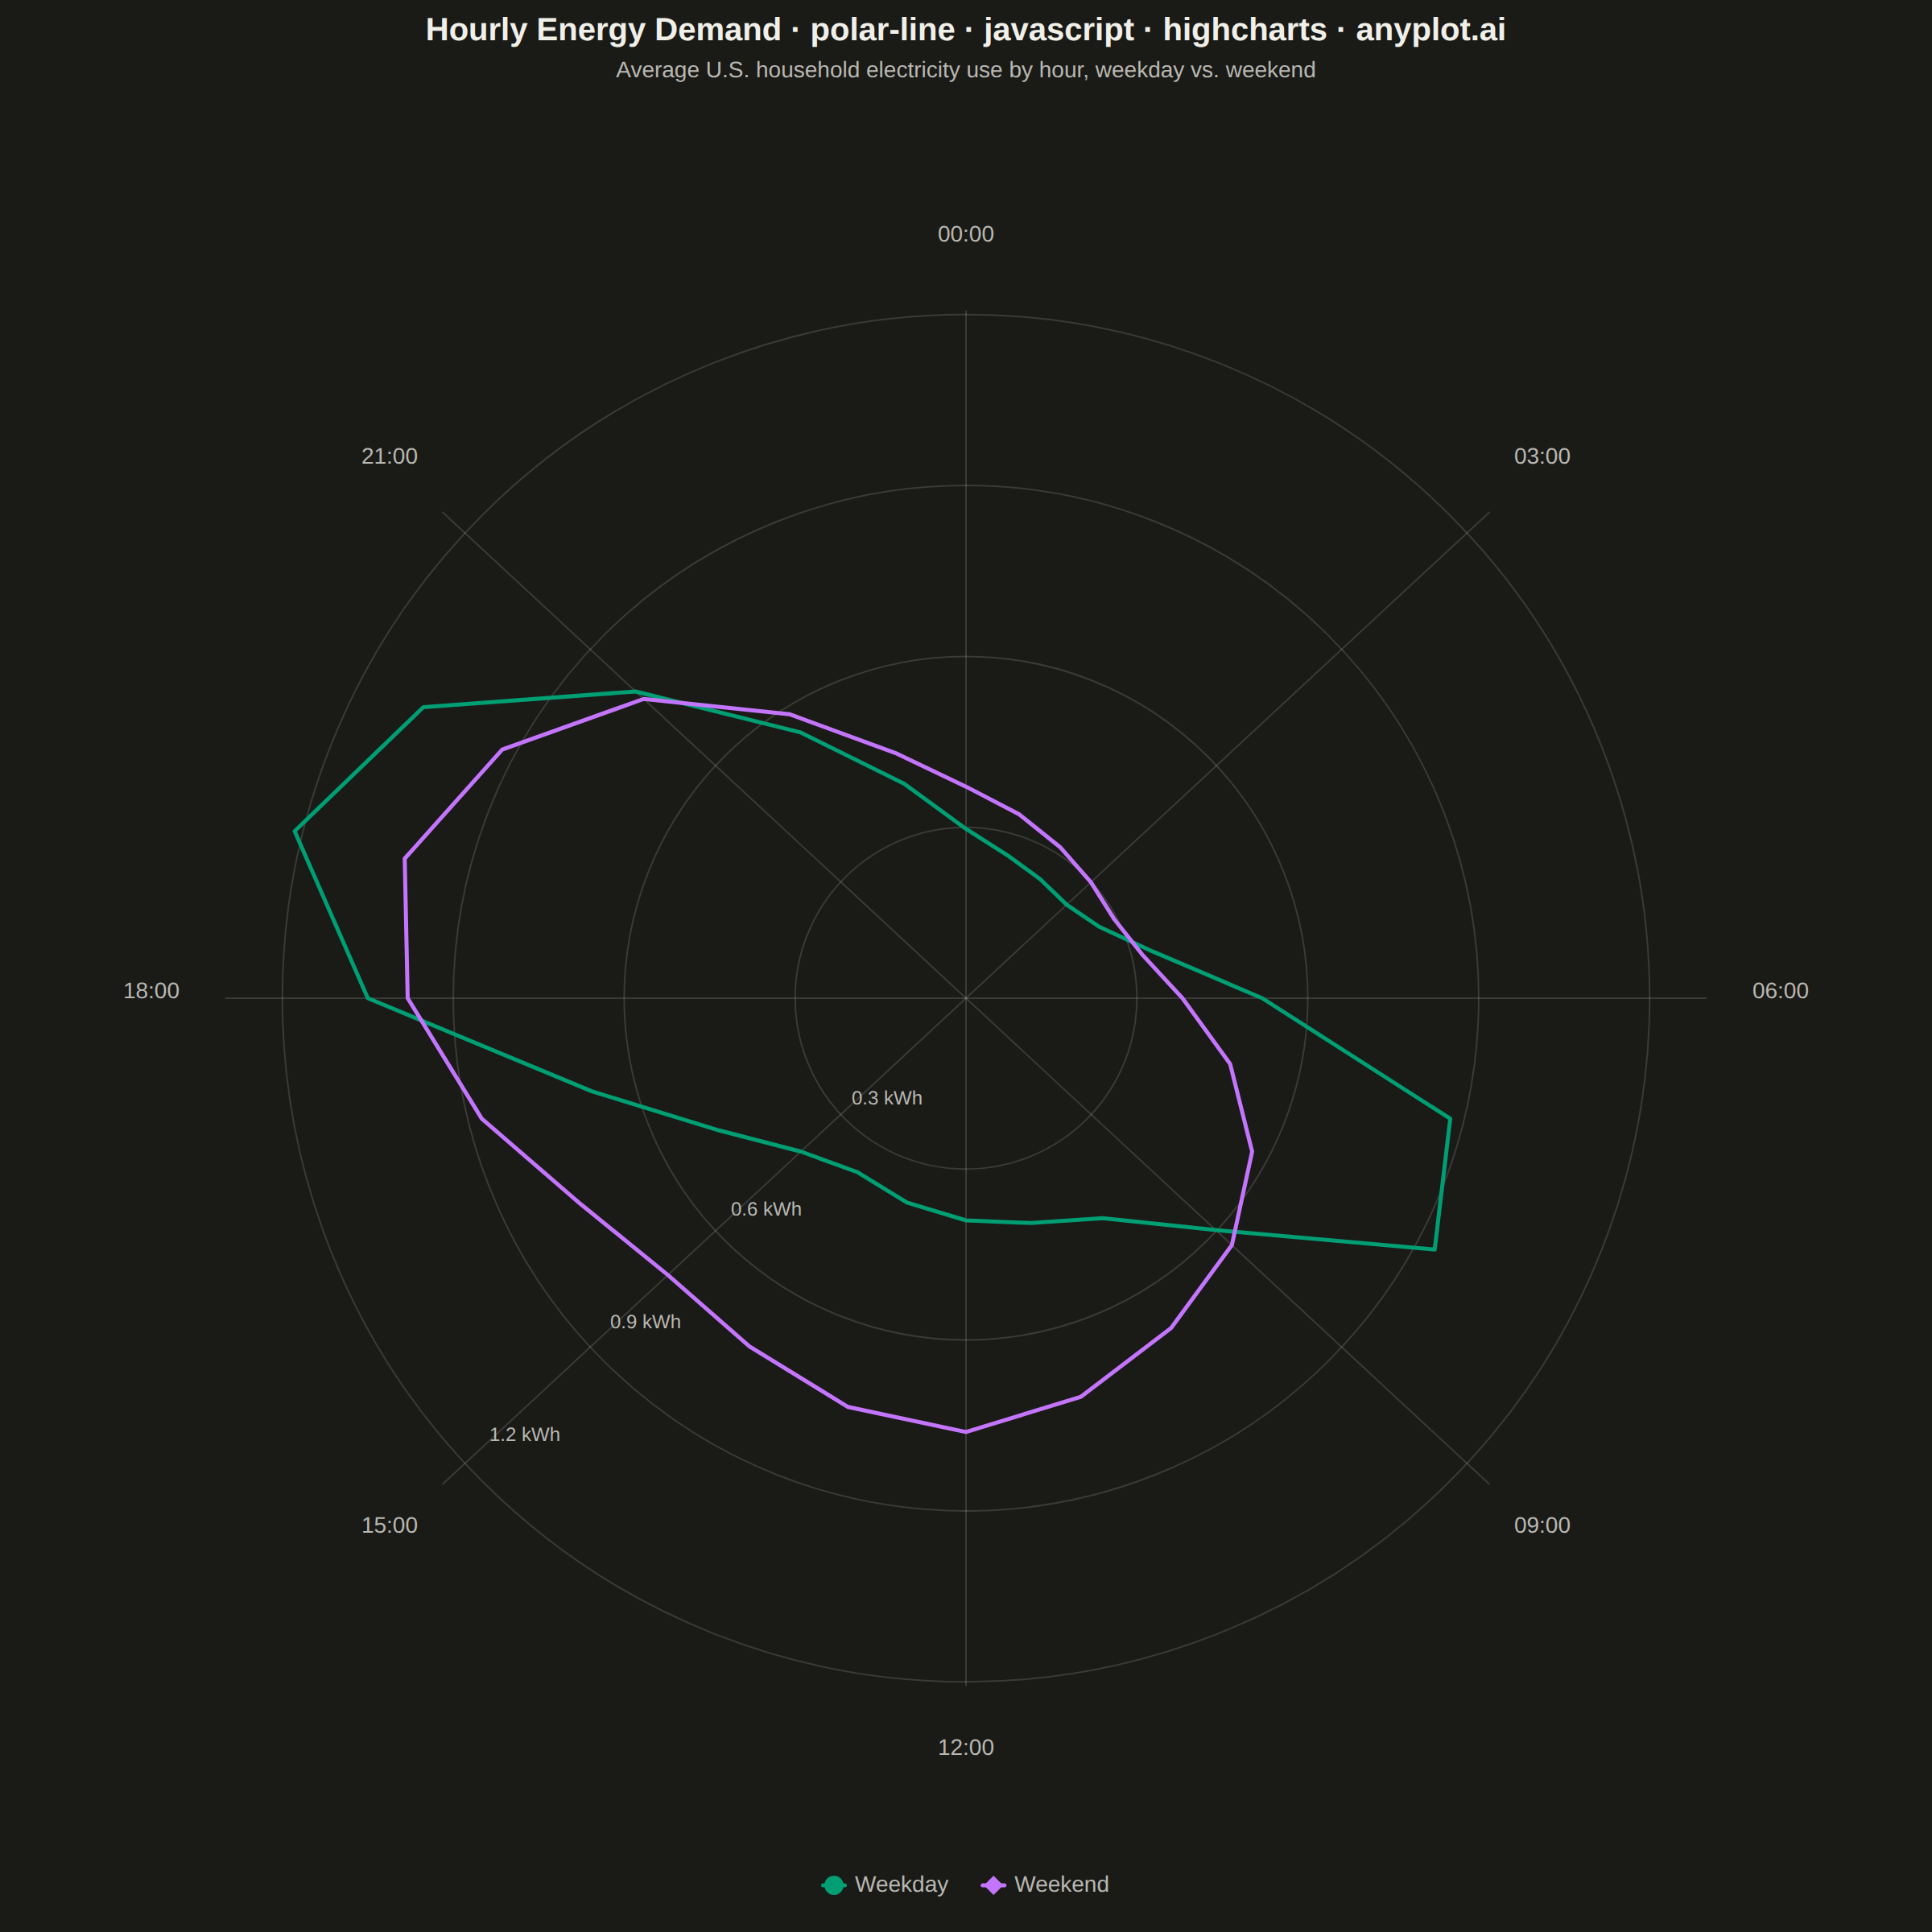
The same plot in 14 other libraries — JavaScript: Chart.js, D3.js, Apache ECharts, MUI X Charts; Python: Altair, Bokeh, lets-plot, Matplotlib, Plotly, plotnine, Pygal, Seaborn; R: ggplot2; Julia: Makie.jl. Compare all 15 side by side: Polar Line Plot in Python, R, Julia and JavaScript.
A line plot rendered in polar coordinates, where data points are connected with lines around a circular axis. The angle (theta) typically represents a cyclical variable while the radius shows magnitude.
// anyplot.ai
// polar-line: Polar Line Plot
// Library: highcharts 12.6.0 | JavaScript 22.23.2
// Quality: 90/100 | Created: 2026-09-05
//# anyplot-orientation: square

const t = window.ANYPLOT_TOKENS;

// --- Data (in-memory, deterministic) ----------------------------------------
// Average household electricity demand (kWh) by hour of day. Weekday shows the
// classic double peak (commute-driven morning ramp, evening cooking/lighting);
// weekend is flatter with one broad midday-into-evening bump instead of a sharp
// morning spike.
const weekdayKwh = [
  0.32, 0.28, 0.26, 0.25, 0.27, 0.34, 0.52, 0.88, 0.95, 0.62, 0.48, 0.44, 0.42,
  0.4, 0.38, 0.41, 0.5, 0.68, 1.05, 1.22, 1.1, 0.82, 0.58, 0.42,
];
const weekendKwh = [
  0.4, 0.36, 0.33, 0.31, 0.3, 0.32, 0.38, 0.48, 0.58, 0.66, 0.72, 0.78, 0.82,
  0.8, 0.76, 0.74, 0.78, 0.88, 0.98, 1.02, 0.94, 0.8, 0.62, 0.48,
];

// --- Polar -> Cartesian ------------------------------------------------------
// Core Highcharts has no `chart.polar` (that lives in the unloaded highcharts-more
// module — see prompts/library/highcharts.md "No add-on modules"). Instead of
// returning NOT_FEASIBLE, the polar geometry is built by hand: each (hour, kWh)
// reading is converted to an (x, y) pair and drawn as a genuine line series on a
// hidden, equal-range Cartesian grid, with the angular/radial gridlines drawn to
// the same scale via the renderer — real coordinates, not a picture of a polar
// chart.
const HOURS = 24;
const AXIS_MAX = 1.3; // kWh — outer ring radius, headroom over the 1.22 peak
const RADIUS_TICKS = [0.3, 0.6, 0.9, 1.2];

function polarPoint(radius, hour) {
  const theta = (hour / HOURS) * 2 * Math.PI; // 0 = top (midnight), clockwise
  return { x: radius * Math.sin(theta), y: radius * Math.cos(theta) };
}

function seriesData(values, name) {
  const points = values.map((kwh, hour) => ({
    ...polarPoint(kwh, hour),
    custom: { hour, kwh },
  }));
  points.push({ ...points[0] }); // close the loop: repeat hour 0 at the end
  return { name, data: points };
}

const weekday = seriesData(weekdayKwh, "Weekday");
const weekend = seriesData(weekendKwh, "Weekend");

// --- Chart -------------------------------------------------------------------
Highcharts.chart("container", {
  chart: {
    type: "line",
    backgroundColor: "transparent",
    animation: false,
    margin: [160, 140, 120, 140],
    style: { fontFamily: "inherit" },
    events: {
      render() {
        const chart = this;
        if (chart.polarGrid) chart.polarGrid.destroy();
        const group = chart.renderer.g("polar-grid").add();
        group.attr({ zIndex: 1 });
        const xAxis = chart.xAxis[0];
        const yAxis = chart.yAxis[0];
        const cx = xAxis.toPixels(0);
        const cy = yAxis.toPixels(0);

        // Concentric radius rings, labeled along the 15:00 spoke — at that hour
        // both series sit comfortably clear of every ring, unlike the 01:00
        // spoke where the 0.3 ring used to crowd the lines (values ~0.28-0.36
        // kWh at hour 1, right on top of the ring).
        RADIUS_TICKS.forEach((r) => {
          const rPix = Math.abs(xAxis.toPixels(r) - cx);
          chart.renderer
            .circle(cx, cy, rPix)
            .attr({ fill: "none", stroke: t.grid, "stroke-width": 1 })
            .add(group);
          const labelAt = polarPoint(r, 15);
          chart.renderer
            .text(`${r.toFixed(1)} kWh`, xAxis.toPixels(labelAt.x) + 4, yAxis.toPixels(labelAt.y) - 4)
            .css({ color: t.inkSoft, fontSize: "12px" })
            .add(group);
        });

        // Radial spokes + hour labels every 3 hours.
        for (let hour = 0; hour < HOURS; hour += 3) {
          const edge = polarPoint(AXIS_MAX, hour);
          chart.renderer
            .path(["M", cx, cy, "L", xAxis.toPixels(edge.x), yAxis.toPixels(edge.y)])
            .attr({ stroke: t.grid, "stroke-width": 1 })
            .add(group);

          const labelAt = polarPoint(AXIS_MAX * 1.1, hour);
          chart.renderer
            .text(`${String(hour).padStart(2, "0")}:00`, xAxis.toPixels(labelAt.x), yAxis.toPixels(labelAt.y))
            .attr({ align: "center" })
            .css({ color: t.inkSoft, fontSize: "14px" })
            .add(group);
        }

        chart.polarGrid = group;
      },
    },
  },
  credits: { enabled: false },
  colors: t.palette,
  title: {
    text: "Hourly Energy Demand · polar-line · javascript · highcharts · anyplot.ai",
    style: { color: t.ink, fontSize: "20px", fontWeight: "600" },
  },
  subtitle: {
    text: "Average U.S. household electricity use by hour, weekday vs. weekend",
    style: { color: t.inkSoft, fontSize: "14px" },
  },
  xAxis: { min: -AXIS_MAX, max: AXIS_MAX, visible: false },
  yAxis: { min: -AXIS_MAX, max: AXIS_MAX, visible: false, title: { text: null } },
  legend: {
    itemStyle: { color: t.inkSoft, fontSize: "14px" },
    itemHoverStyle: { color: t.ink },
  },
  tooltip: {
    backgroundColor: t.elevatedBg,
    style: { color: t.ink },
    formatter() {
      const { hour, kwh } = this.point.custom;
      return `<b>${this.series.name}</b><br>${String(hour).padStart(2, "0")}:00 — ${kwh.toFixed(2)} kWh`;
    },
  },
  plotOptions: {
    series: {
      animation: false,
      lineWidth: 2.5,
      marker: { radius: 6, lineWidth: 0 },
    },
  },
  series: [weekday, weekend],
});
Runnable source as JSON, for any HTTP client: https://api.anyplot.ai/specs/polar-line/highcharts/code. Any spec id and library id listed in llms-full.txt fit the same URL shape; every URL below is complete and callable.
{
  "spec_id": "polar-line",
  "language": "javascript",
  "library": "highcharts",
  "page": "https://anyplot.ai/polar-line/javascript/highcharts",
  "hub": "https://anyplot.ai/polar-line",
  "code_json": "https://api.anyplot.ai/specs/polar-line/highcharts/code",
  "spec_json": "https://api.anyplot.ai/specs/polar-line",
  "render_light_png": "https://storage.googleapis.com/anyplot-images/plots/polar-line/javascript/highcharts/plot-light.png",
  "render_dark_png": "https://storage.googleapis.com/anyplot-images/plots/polar-line/javascript/highcharts/plot-dark.png",
  "interactive_light_html": "https://storage.googleapis.com/anyplot-images/plots/polar-line/javascript/highcharts/plot-light.html",
  "interactive_dark_html": "https://storage.googleapis.com/anyplot-images/plots/polar-line/javascript/highcharts/plot-dark.html",
  "quality_score": 90.0,
  "license": "MIT",
  "guide": "https://anyplot.ai/llms.txt"
}
Part of Polar Line Plot on anyplot.ai.