The same plot in 14 other libraries — JavaScript: Chart.js, D3.js, Highcharts, MUI X Charts; Python: Altair, Bokeh, lets-plot, Matplotlib, Plotly, plotnine, Pygal, Seaborn; R: ggplot2; Julia: Makie.jl. Compare all 15 side by side: Polar Line Plot in Python, R, Julia and JavaScript.
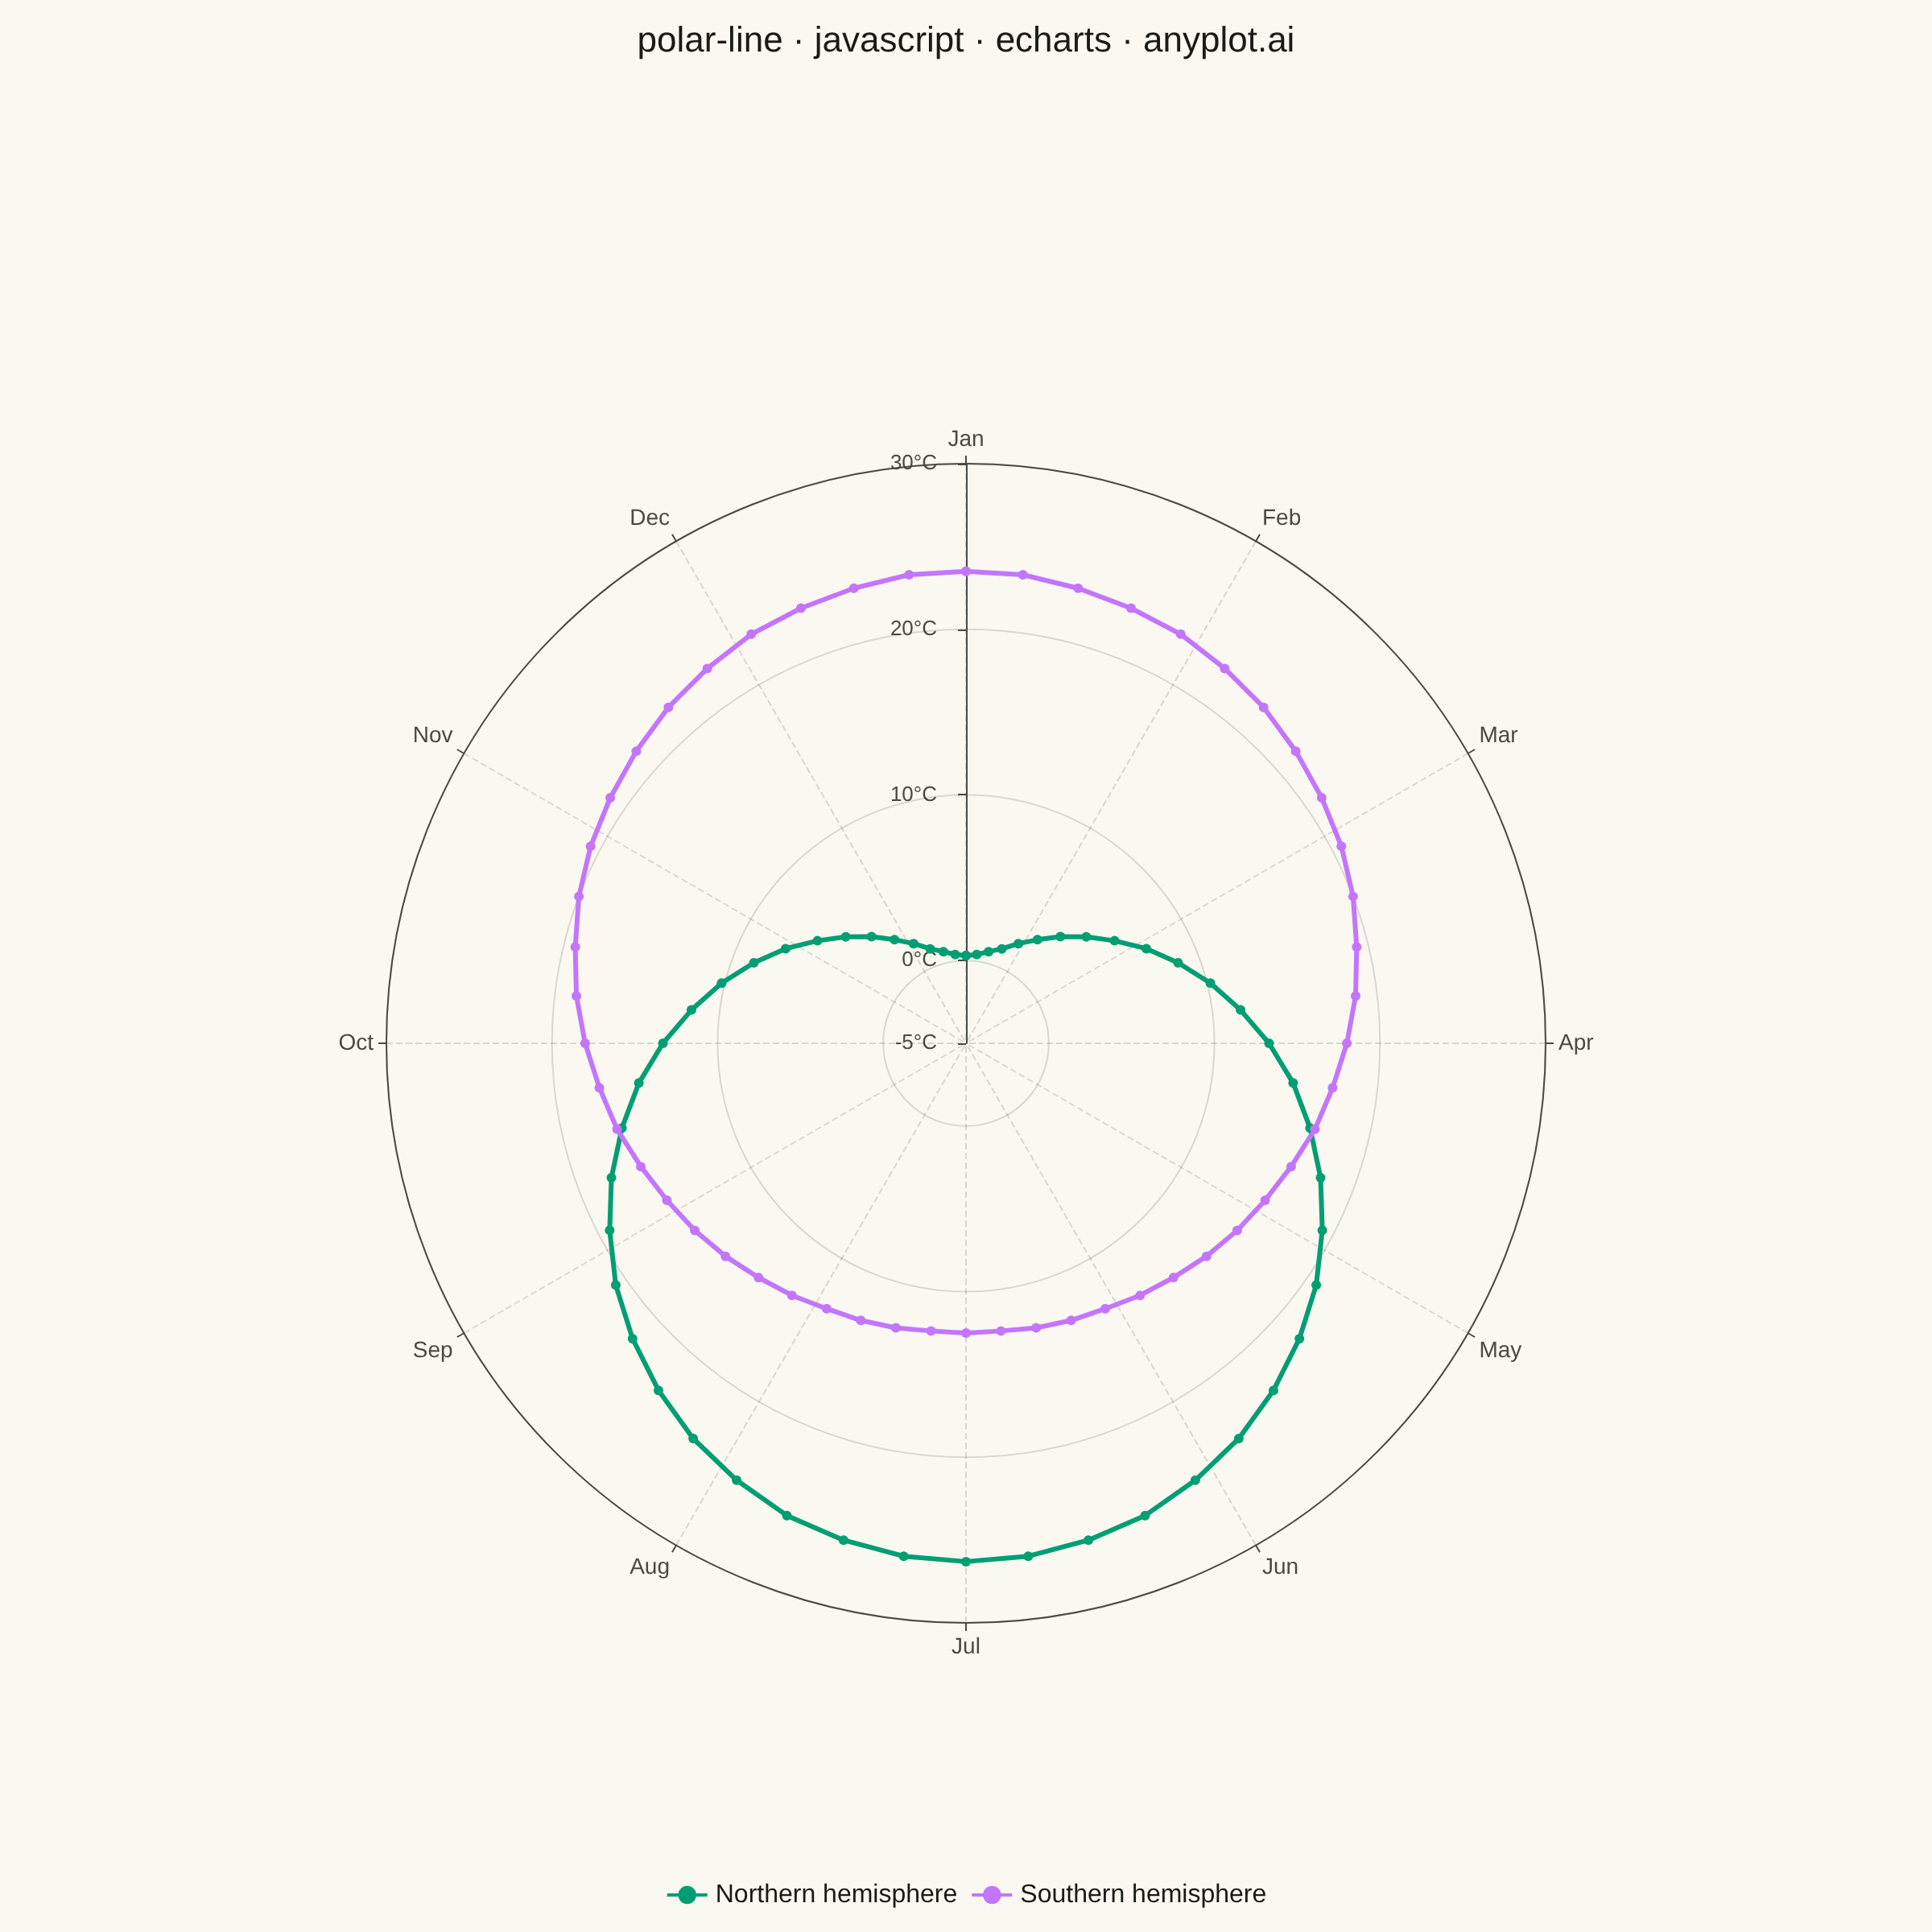
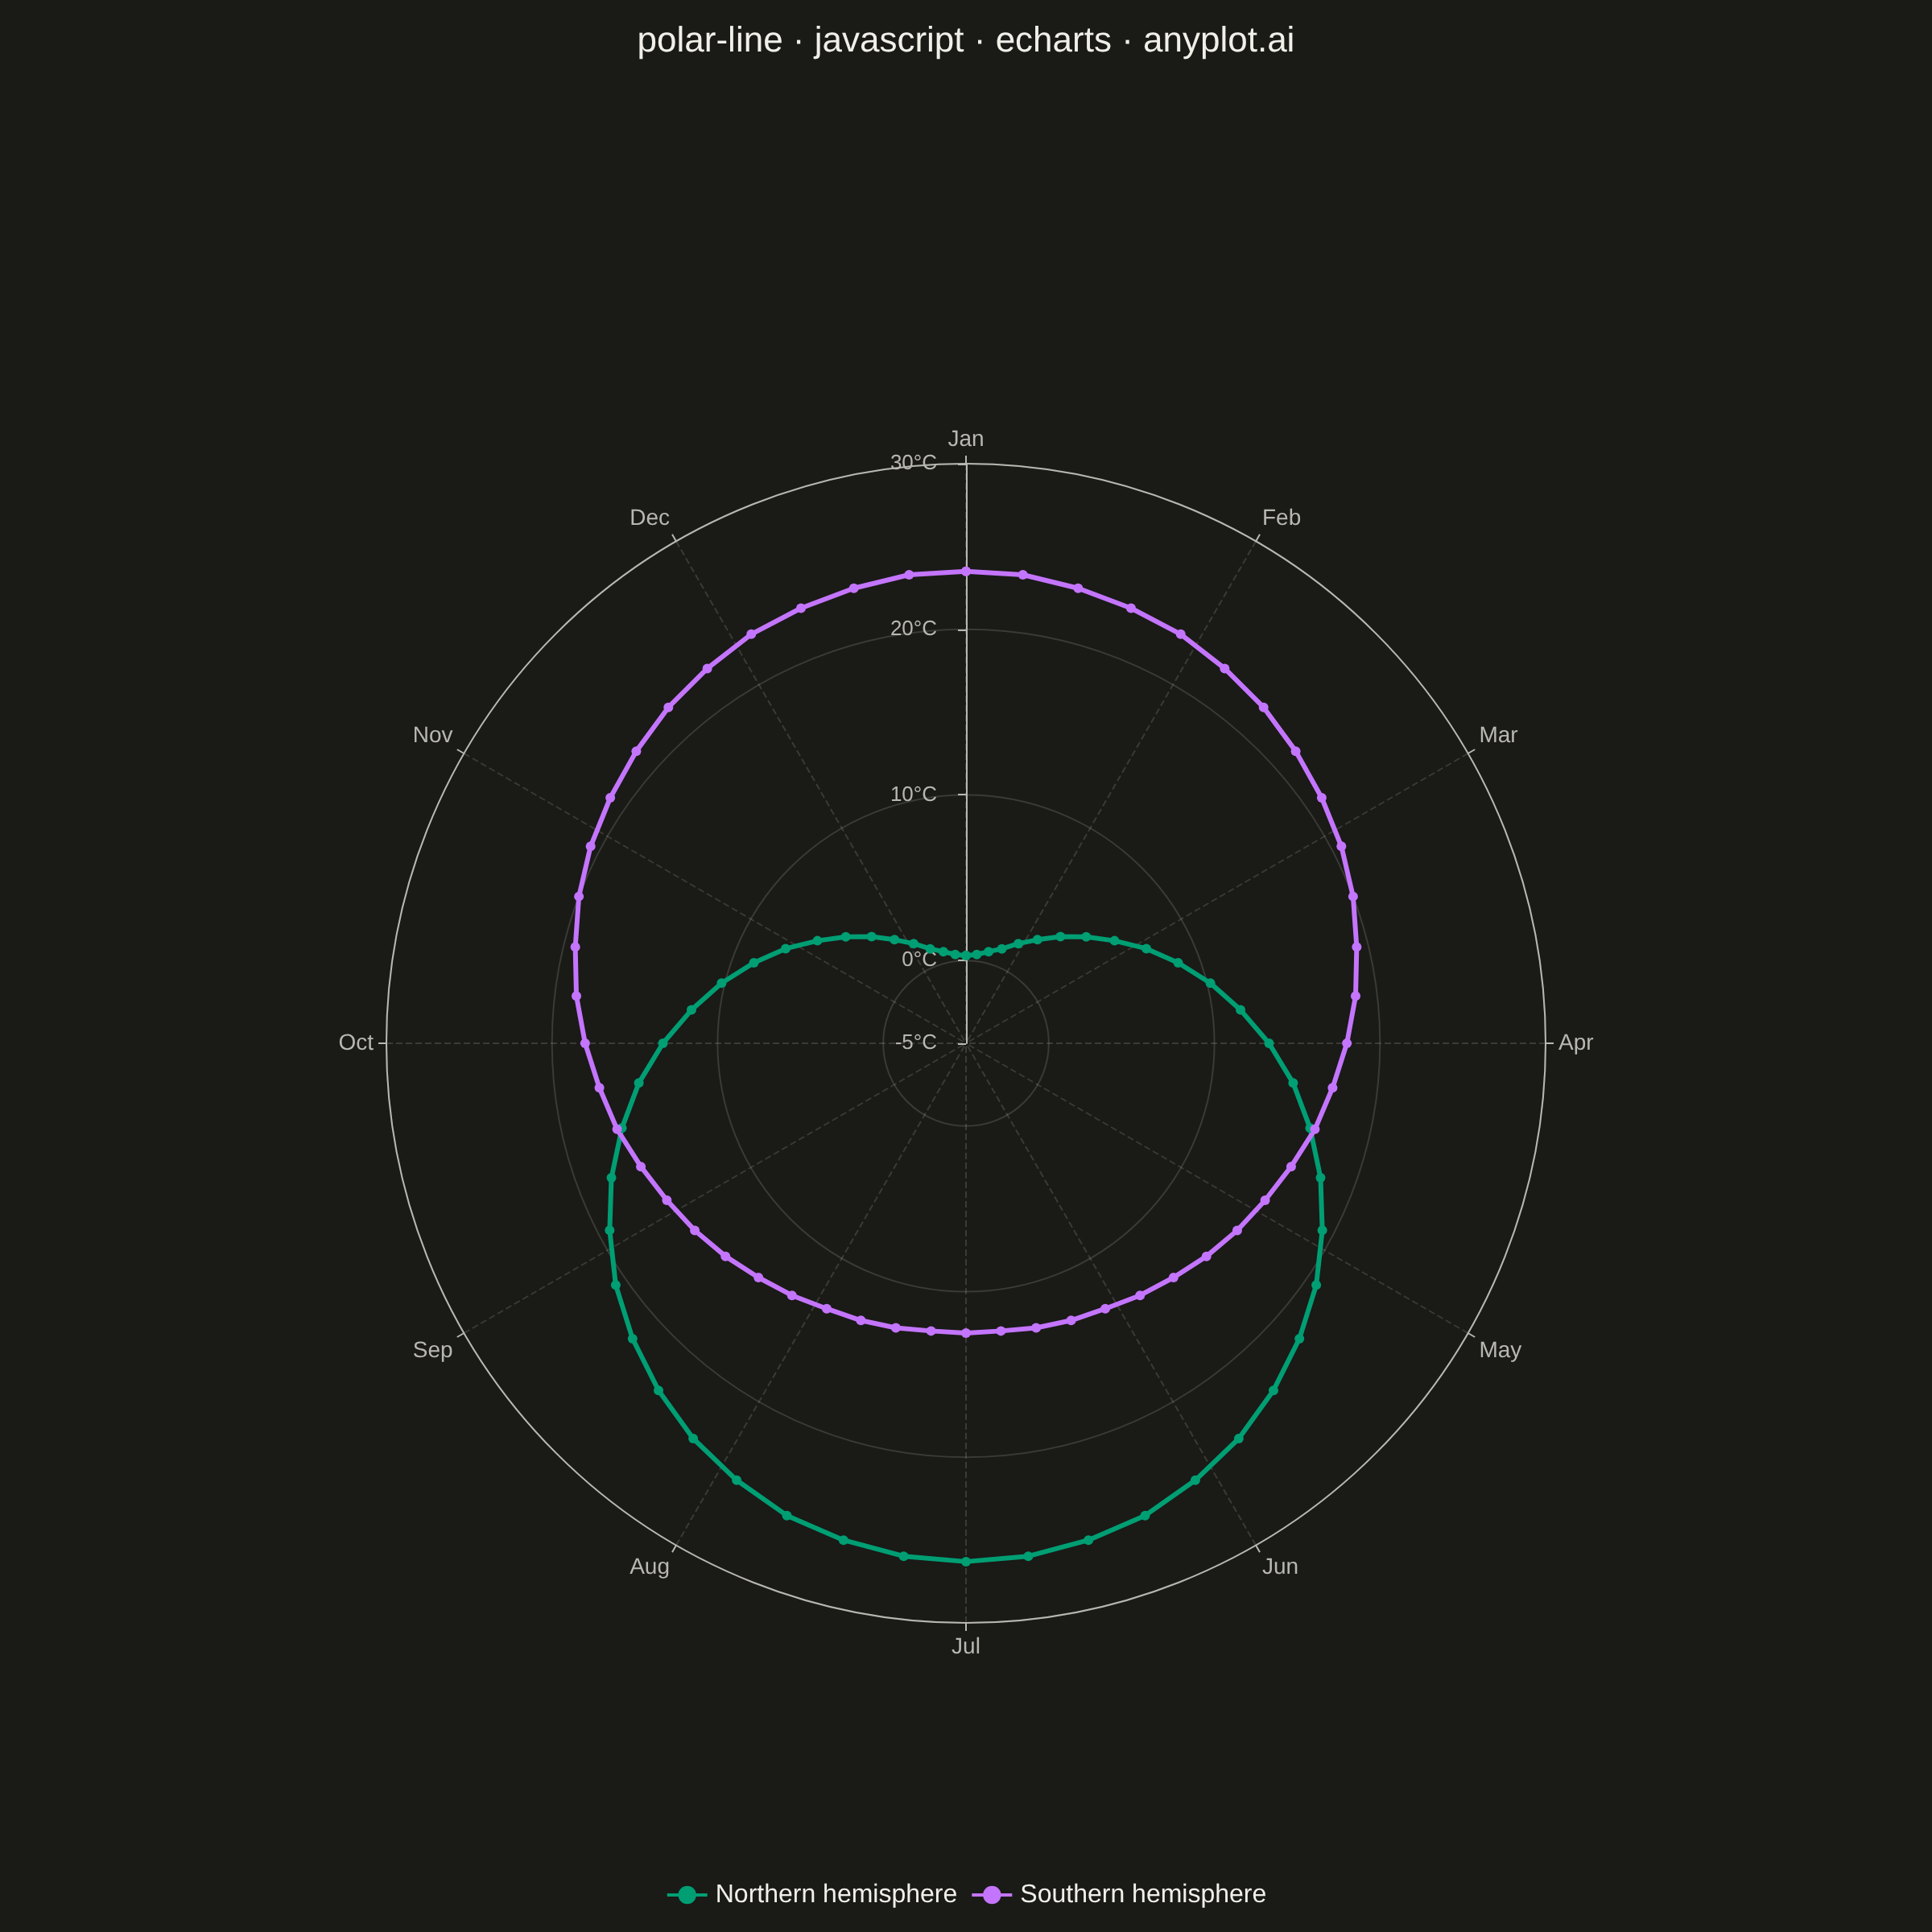
A line plot rendered in polar coordinates, where data points are connected with lines around a circular axis. The angle (theta) typically represents a cyclical variable while the radius shows magnitude.
// anyplot.ai
// polar-line: Polar Line Plot
// Library: echarts 6.1.0 | JavaScript 22.23.2
// Quality: 88/100 | Created: 2026-09-05

//# anyplot-orientation: square
const t = window.ANYPLOT_TOKENS;

// --- Data (in-memory, deterministic) ----------------------------------------
// Weekly average temperature (°C) for two hemispheres — opposite seasonal phase.
// A single annual sinusoid per hemisphere (calibrated to typical monthly climate
// normals) gives a smooth 52-point ring instead of 12 sparse vertices.
const months = ["Jan", "Feb", "Mar", "Apr", "May", "Jun", "Jul", "Aug", "Sep", "Oct", "Nov", "Dec"];
const WEEKS_PER_YEAR = 52;
const monthOf = (week) => (week / WEEKS_PER_YEAR) * 12;

const northernHemisphere = Array.from({ length: WEEKS_PER_YEAR }, (_, week) => {
  const month = monthOf(week);
  return Math.round((13.3 - 13 * Math.cos((2 * Math.PI * month) / 12)) * 10) / 10;
});
const southernHemisphere = Array.from({ length: WEEKS_PER_YEAR }, (_, week) => {
  const month = monthOf(week);
  return Math.round((18 + 5.5 * Math.cos((2 * Math.PI * month) / 12)) * 10) / 10;
});

// A category angleAxis would break alignment if a 13th slot were appended just
// to close the loop, so the axis runs on a continuous 0-12 value scale instead
// (one unit per month) and each series repeats its January value at month 12 —
// same angle as month 0 — to draw a fully closed ring. Polar series data pairs
// are [radiusValue, angleValue] (radiusAxis is dimension 0), not the reverse.
const closeLoop = (values) => values.map((v, i) => [v, monthOf(i)]).concat([[values[0], 12]]);

// --- Init --------------------------------------------------------------------
const chart = echarts.init(document.getElementById("container"));

// --- Option --------------------------------------------------------------------
chart.setOption({
  animation: false,
  color: t.palette,
  backgroundColor: "transparent",
  title: {
    text: "polar-line · javascript · echarts · anyplot.ai",
    left: "center",
    top: 10,
    textStyle: { color: t.ink, fontSize: 22, fontWeight: 500 },
  },
  legend: {
    bottom: 10,
    data: ["Northern hemisphere", "Southern hemisphere"],
    textStyle: { color: t.ink, fontSize: 16 },
  },
  polar: { center: ["50%", "54%"], radius: "60%" },
  angleAxis: {
    type: "value",
    min: 0,
    max: 12,
    interval: 1,
    startAngle: 90,
    axisLabel: { color: t.inkSoft, fontSize: 14, formatter: (value) => months[value] || "" },
    axisLine: { lineStyle: { color: t.inkSoft } },
    splitLine: { lineStyle: { color: t.grid, type: "dashed" } },
  },
  radiusAxis: {
    type: "value",
    min: -5,
    max: 30,
    axisLabel: { color: t.inkSoft, fontSize: 13, formatter: "{value}°C", margin: 18 },
    axisLine: { lineStyle: { color: t.inkSoft } },
    splitLine: { lineStyle: { color: t.grid } },
  },
  series: [
    {
      name: "Northern hemisphere",
      type: "line",
      coordinateSystem: "polar",
      data: closeLoop(northernHemisphere),
      symbol: "circle",
      symbolSize: 6,
      lineStyle: { width: 3 },
    },
    {
      name: "Southern hemisphere",
      type: "line",
      coordinateSystem: "polar",
      data: closeLoop(southernHemisphere),
      symbol: "circle",
      symbolSize: 6,
      lineStyle: { width: 3 },
    },
  ],
});
Runnable source as JSON, for any HTTP client: https://api.anyplot.ai/specs/polar-line/echarts/code. Any spec id and library id listed in llms-full.txt fit the same URL shape; every URL below is complete and callable.
{
  "spec_id": "polar-line",
  "language": "javascript",
  "library": "echarts",
  "page": "https://anyplot.ai/polar-line/javascript/echarts",
  "hub": "https://anyplot.ai/polar-line",
  "code_json": "https://api.anyplot.ai/specs/polar-line/echarts/code",
  "spec_json": "https://api.anyplot.ai/specs/polar-line",
  "render_light_png": "https://storage.googleapis.com/anyplot-images/plots/polar-line/javascript/echarts/plot-light.png",
  "render_dark_png": "https://storage.googleapis.com/anyplot-images/plots/polar-line/javascript/echarts/plot-dark.png",
  "interactive_light_html": "https://storage.googleapis.com/anyplot-images/plots/polar-line/javascript/echarts/plot-light.html",
  "interactive_dark_html": "https://storage.googleapis.com/anyplot-images/plots/polar-line/javascript/echarts/plot-dark.html",
  "quality_score": 88.0,
  "license": "MIT",
  "guide": "https://anyplot.ai/llms.txt"
}
Part of Polar Line Plot on anyplot.ai.