The same plot in 14 other libraries — JavaScript: Chart.js, Apache ECharts, Highcharts, MUI X Charts; Python: Altair, Bokeh, lets-plot, Matplotlib, Plotly, plotnine, Pygal, Seaborn; R: ggplot2; Julia: Makie.jl. Compare all 15 side by side: Polar Line Plot in Python, R, Julia and JavaScript.
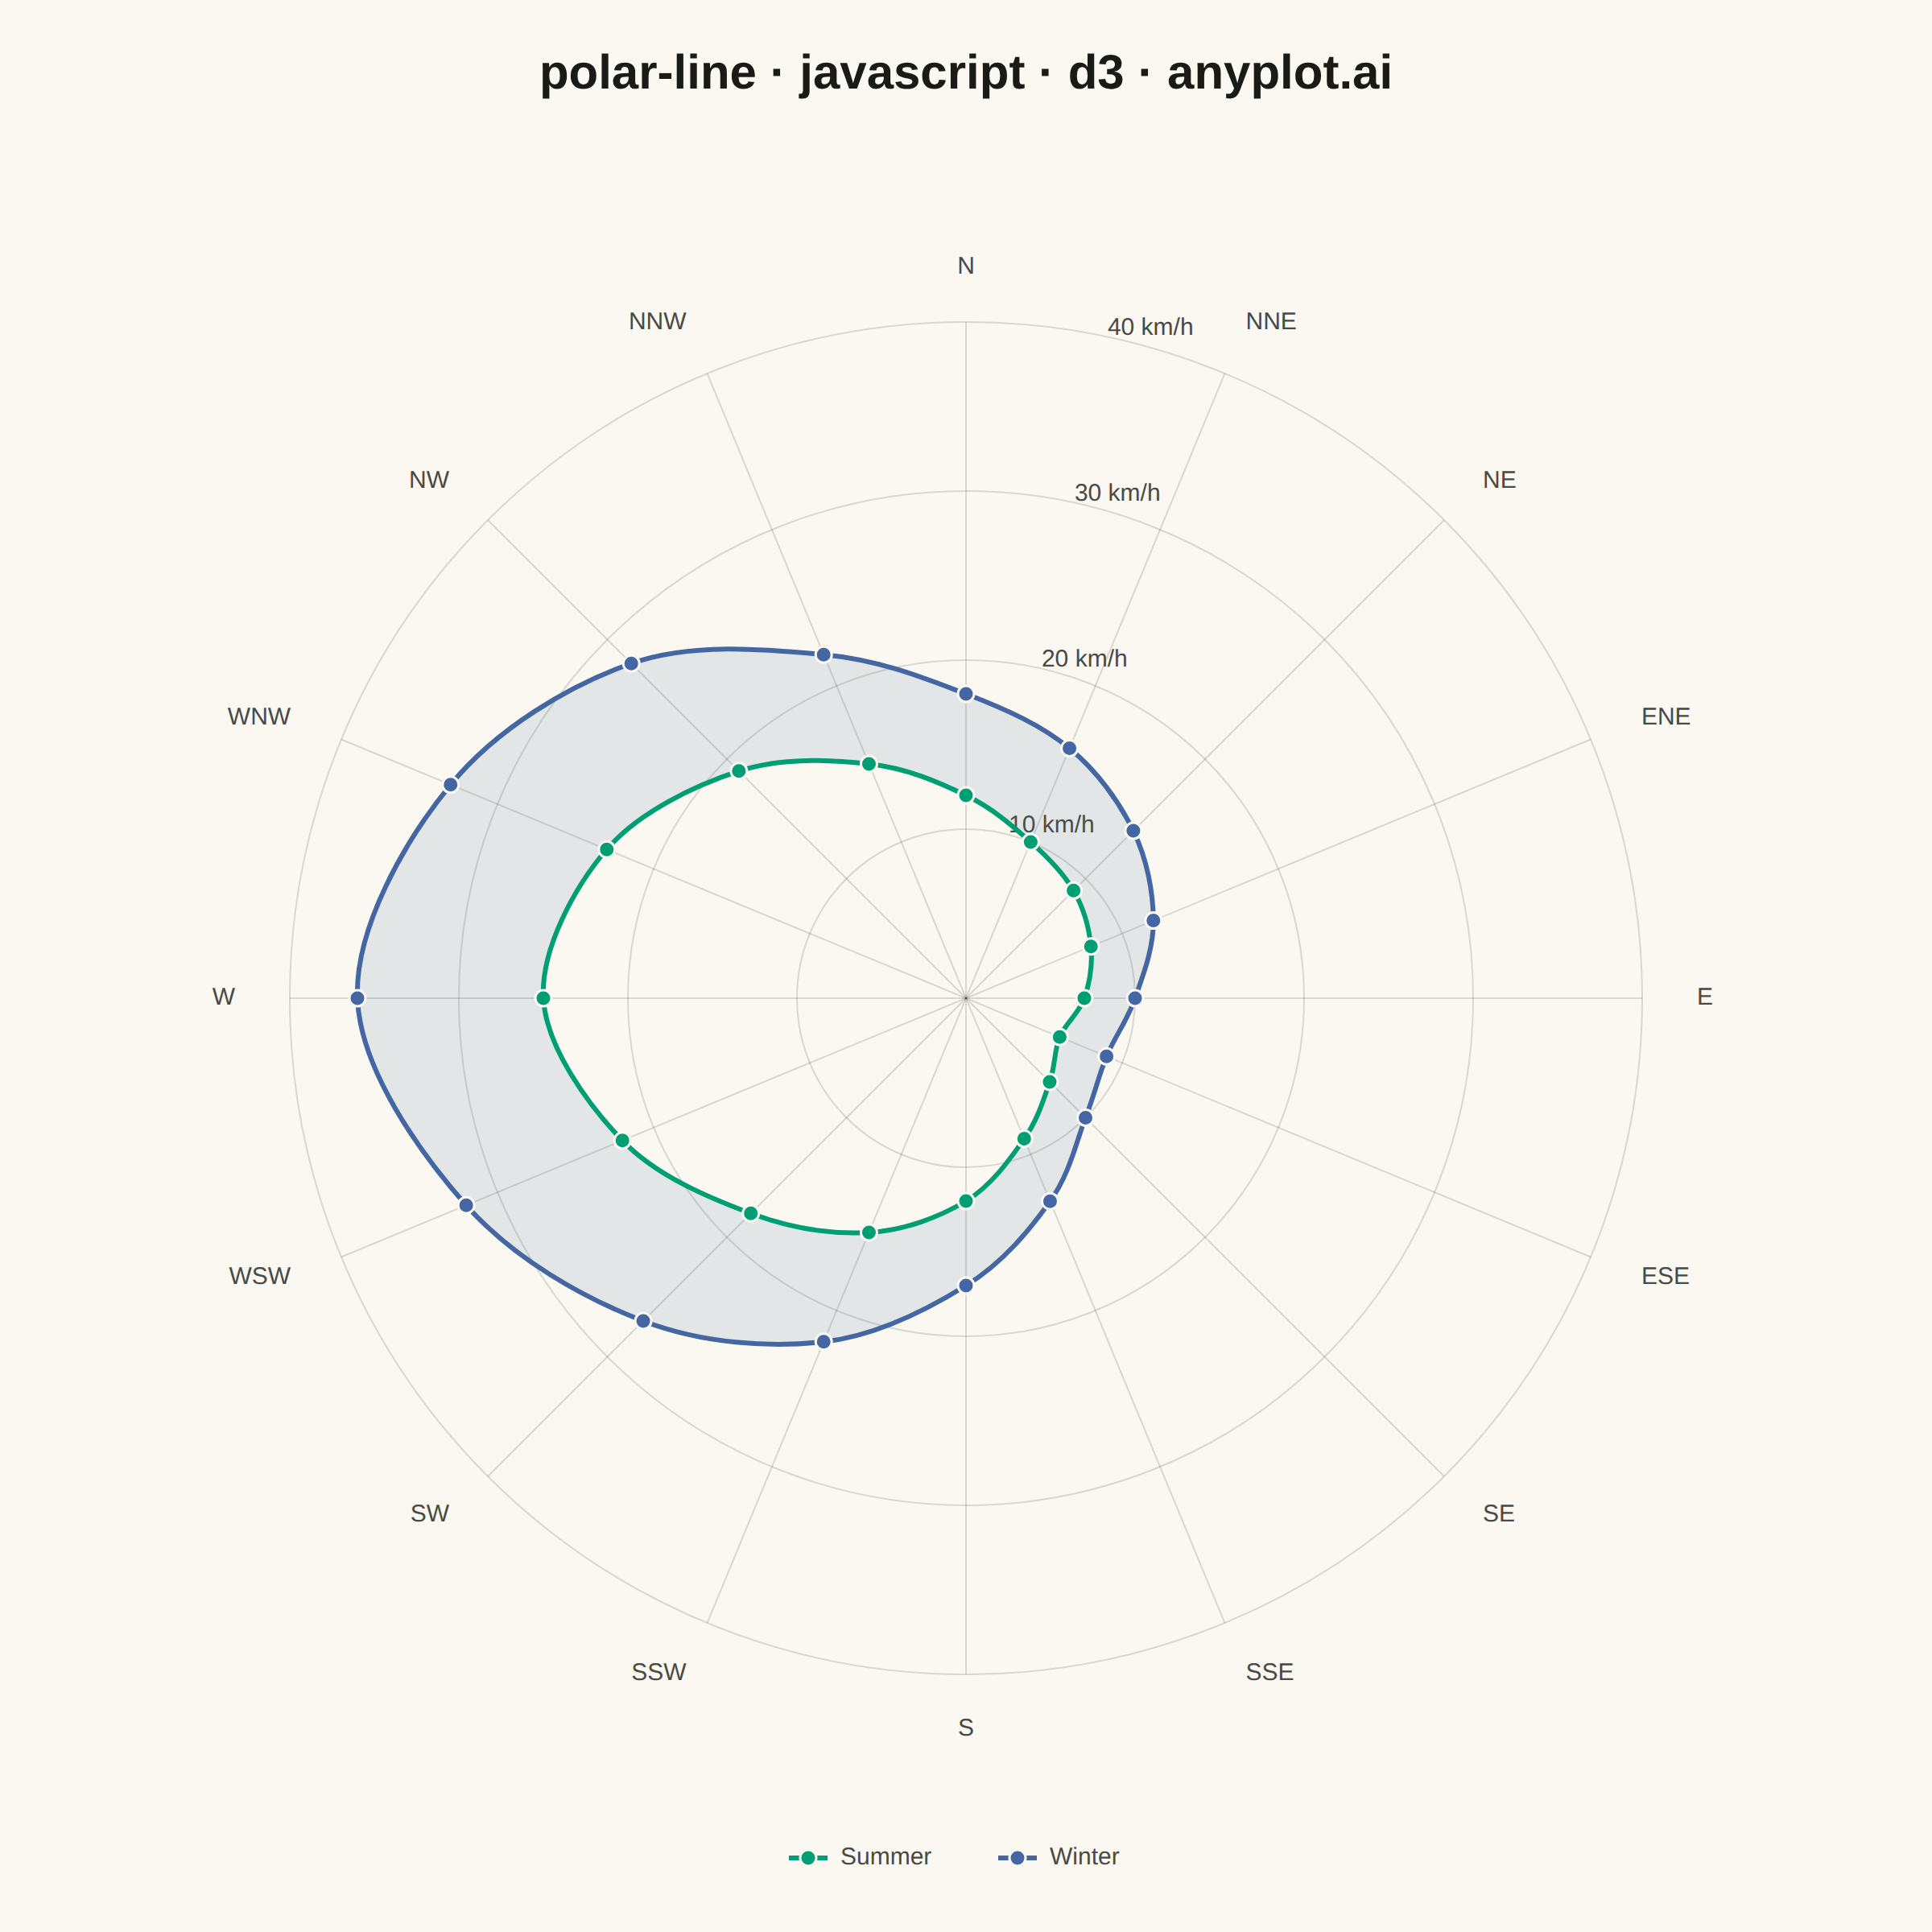
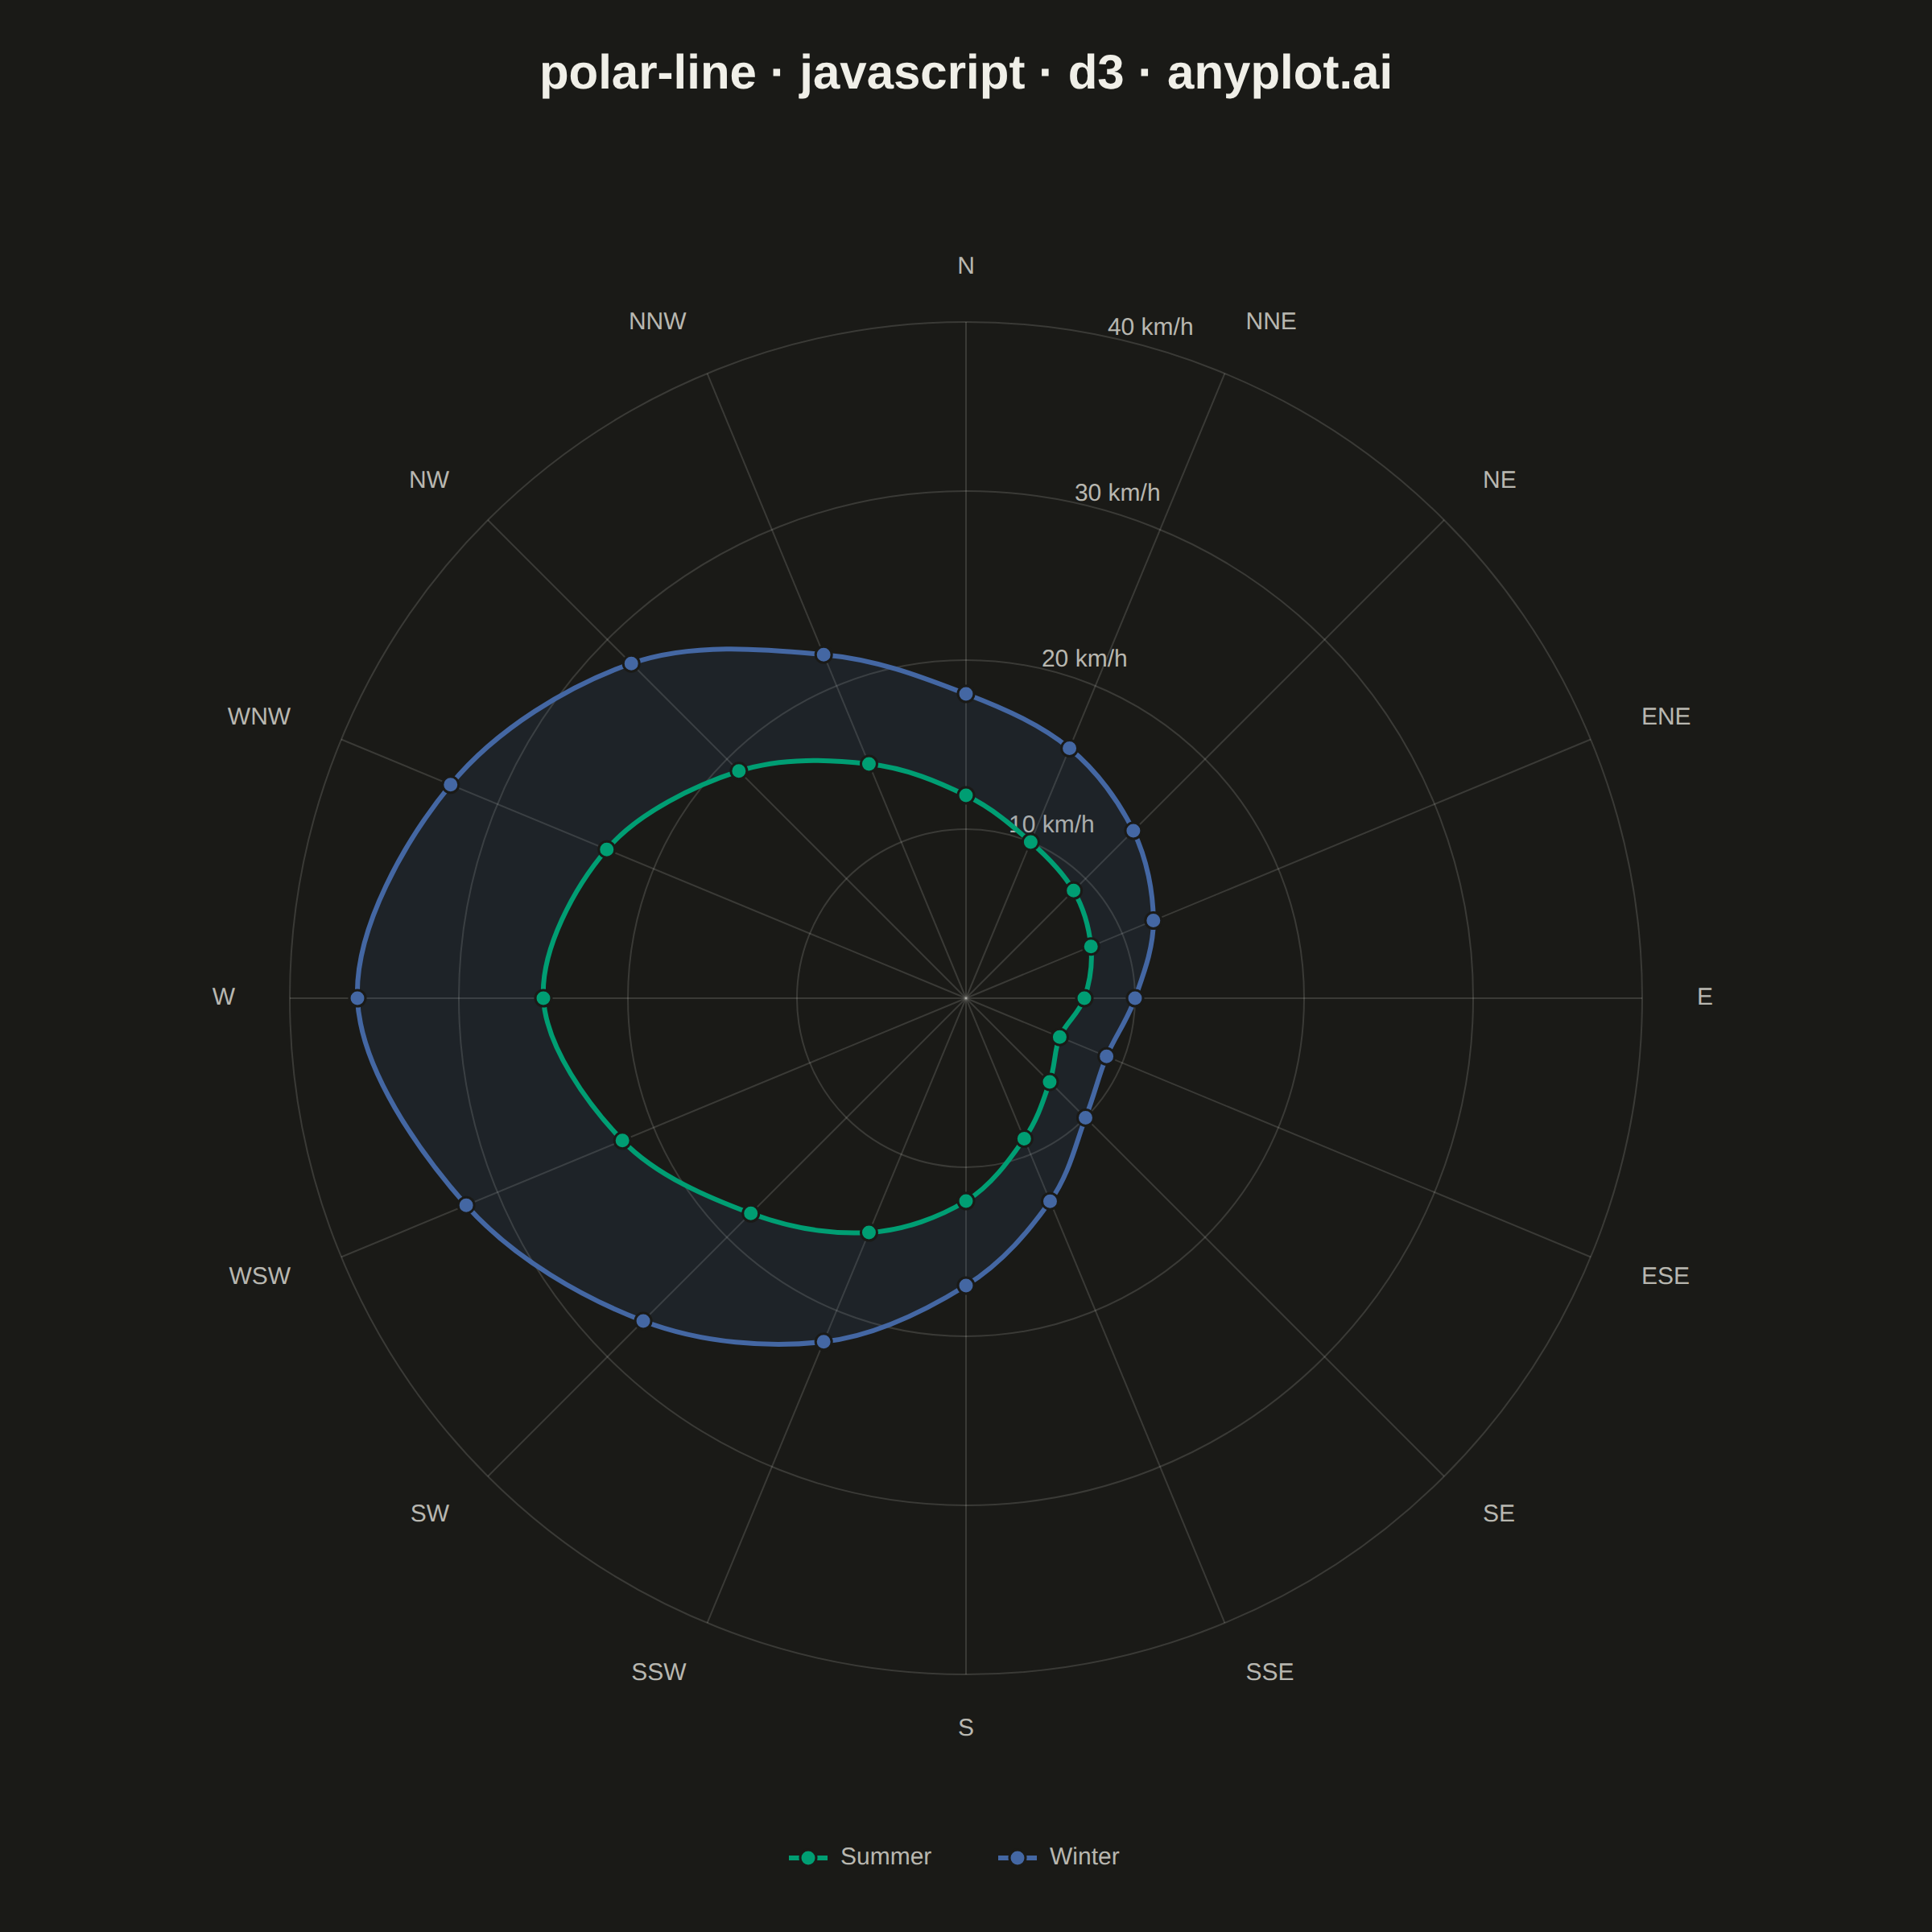
A line plot rendered in polar coordinates, where data points are connected with lines around a circular axis. The angle (theta) typically represents a cyclical variable while the radius shows magnitude.
// anyplot.ai
// polar-line: Polar Line Plot
// Library: d3 7.9.0 | JavaScript 22.23.2
// Quality: 90/100 | Created: 2026-09-05

//# anyplot-orientation: square

const t = window.ANYPLOT_TOKENS;
const { width, height } = window.ANYPLOT_SIZE;

// --- Data (in-memory, deterministic) ----------------------------------------
// Average wind speed (km/h) by compass direction at a coastal weather station,
// summer vs. winter — prevailing westerlies, stronger in winter.
const directions = [
  "N", "NNE", "NE", "ENE", "E", "ESE", "SE", "SSE",
  "S", "SSW", "SW", "WSW", "W", "WNW", "NW", "NNW",
];
const summerSpeed = [12, 10, 9, 8, 7, 6, 7, 9, 12, 15, 18, 22, 25, 23, 19, 15];
const winterSpeed = [18, 16, 14, 12, 10, 9, 10, 13, 17, 22, 27, 32, 36, 33, 28, 22];

// Winter intentionally uses palette[2] (blue) rather than the canonical
// palette[1] (lavender) — a deliberate warm/cold semantic pairing with the
// brand-green Summer series, not an arbitrary skip.
const series = [
  { name: "Summer", values: summerSpeed, color: t.palette[0] },
  { name: "Winter", values: winterSpeed, color: t.palette[2] },
];

// --- Layout -------------------------------------------------------------------
const centerX = width / 2;
const centerY = 620;
const outerRadius = 420;
const labelOffset = 34;
const maxSpeed = Math.max(...summerSpeed, ...winterSpeed);

const angle = d3.scaleLinear().domain([0, directions.length]).range([0, 2 * Math.PI]);
const radius = d3.scaleLinear().domain([0, maxSpeed]).nice().range([0, outerRadius]);
const radiusTicks = radius.ticks(4).filter((v) => v > 0);

// --- SVG mount ------------------------------------------------------------
const svg = d3.select("#container").append("svg").attr("width", width).attr("height", height);
const g = svg.append("g").attr("transform", `translate(${centerX},${centerY})`);

// --- Grid: concentric circles + radial spokes ------------------------------
const gridGroup = g.append("g");
gridGroup
  .selectAll("circle")
  .data(radiusTicks)
  .join("circle")
  .attr("r", (d) => radius(d))
  .attr("fill", "none")
  .attr("stroke", t.grid)
  .attr("stroke-width", 1);

gridGroup
  .selectAll("line")
  .data(d3.range(directions.length))
  .join("line")
  .attr("x1", 0)
  .attr("y1", 0)
  .attr("x2", (i) => outerRadius * Math.sin(angle(i)))
  .attr("y2", (i) => -outerRadius * Math.cos(angle(i)))
  .attr("stroke", t.grid)
  .attr("stroke-width", 1);

// --- Radial tick labels (placed along a spoke clear of the data lines) ------
const tickAngle = angle(0.5); // halfway between N and NNE, away from the peak lobe
g.selectAll(".radius-tick")
  .data(radiusTicks)
  .join("text")
  .attr("class", "radius-tick")
  .attr("x", (d) => radius(d) * Math.sin(tickAngle) + 6)
  .attr("y", (d) => -radius(d) * Math.cos(tickAngle))
  .attr("fill", t.inkSoft)
  .style("font-size", "15px")
  .text((d) => `${d} km/h`);

// --- Direction labels ---------------------------------------------------------
g.selectAll(".direction-label")
  .data(d3.range(directions.length))
  .join("text")
  .attr("class", "direction-label")
  .attr("x", (i) => (outerRadius + labelOffset) * Math.sin(angle(i)))
  .attr("y", (i) => -(outerRadius + labelOffset) * Math.cos(angle(i)))
  .attr("text-anchor", (i) => {
    const s = Math.sin(angle(i));
    if (s > 0.15) return "start";
    if (s < -0.15) return "end";
    return "middle";
  })
  .attr("dominant-baseline", "middle")
  .attr("fill", t.inkSoft)
  .style("font-size", "15px")
  .text((i) => directions[i]);

// --- Radial fill between the two series — spotlights the seasonal gap -------
const seasonGap = d3
  .areaRadial()
  .angle((d, i) => angle(i))
  .innerRadius((d, i) => radius(summerSpeed[i]))
  .outerRadius((d, i) => radius(winterSpeed[i]))
  .curve(d3.curveCardinalClosed);

g.append("path")
  .datum(d3.range(directions.length))
  .attr("d", seasonGap)
  .attr("fill", series[1].color)
  .attr("fill-opacity", 0.12)
  .attr("stroke", "none");

// --- Lines (closed loop — cyclical data) + markers ---------------------------
const lineRadial = d3
  .lineRadial()
  .angle((d, i) => angle(i))
  .radius((d) => radius(d))
  .curve(d3.curveCardinalClosed);

for (const s of series) {
  g.append("path")
    .datum(s.values)
    .attr("d", lineRadial)
    .attr("fill", "none")
    .attr("stroke", s.color)
    .attr("stroke-width", 3)
    .attr("stroke-linejoin", "round");

  g.selectAll(`.marker-${s.name}`)
    .data(s.values)
    .join("circle")
    .attr("class", `marker-${s.name}`)
    .attr("cx", (d, i) => radius(d) * Math.sin(angle(i)))
    .attr("cy", (d, i) => -radius(d) * Math.cos(angle(i)))
    .attr("r", 5)
    .attr("fill", s.color)
    .attr("stroke", t.pageBg)
    .attr("stroke-width", 1.5);
}

// --- Legend -------------------------------------------------------------------
const legend = svg.append("g").attr("transform", `translate(${centerX - 110},${height - 46})`);
series.forEach((s, i) => {
  const item = legend.append("g").attr("transform", `translate(${i * 130},0)`);
  item
    .append("line")
    .attr("x1", 0)
    .attr("x2", 24)
    .attr("y1", 0)
    .attr("y2", 0)
    .attr("stroke", s.color)
    .attr("stroke-width", 3);
  item
    .append("circle")
    .attr("cx", 12)
    .attr("cy", 0)
    .attr("r", 5)
    .attr("fill", s.color)
    .attr("stroke", t.pageBg)
    .attr("stroke-width", 1.5);
  item
    .append("text")
    .attr("x", 32)
    .attr("y", 0)
    .attr("dominant-baseline", "middle")
    .attr("fill", t.inkSoft)
    .style("font-size", "15px")
    .text(s.name);
});

// --- Title ----------------------------------------------------------------
svg
  .append("text")
  .attr("x", width / 2)
  .attr("y", 55)
  .attr("text-anchor", "middle")
  .attr("fill", t.ink)
  .style("font-size", "30px")
  .style("font-weight", "600")
  .text("polar-line · javascript · d3 · anyplot.ai");
Runnable source as JSON, for any HTTP client: https://api.anyplot.ai/specs/polar-line/d3/code. Any spec id and library id listed in llms-full.txt fit the same URL shape; every URL below is complete and callable.
{
  "spec_id": "polar-line",
  "language": "javascript",
  "library": "d3",
  "page": "https://anyplot.ai/polar-line/javascript/d3",
  "hub": "https://anyplot.ai/polar-line",
  "code_json": "https://api.anyplot.ai/specs/polar-line/d3/code",
  "spec_json": "https://api.anyplot.ai/specs/polar-line",
  "render_light_png": "https://storage.googleapis.com/anyplot-images/plots/polar-line/javascript/d3/plot-light.png",
  "render_dark_png": "https://storage.googleapis.com/anyplot-images/plots/polar-line/javascript/d3/plot-dark.png",
  "interactive_light_html": "https://storage.googleapis.com/anyplot-images/plots/polar-line/javascript/d3/plot-light.html",
  "interactive_dark_html": "https://storage.googleapis.com/anyplot-images/plots/polar-line/javascript/d3/plot-dark.html",
  "quality_score": 90.0,
  "license": "MIT",
  "guide": "https://anyplot.ai/llms.txt"
}
Part of Polar Line Plot on anyplot.ai.