The same plot in 14 other libraries — Python: Altair, Bokeh, lets-plot, Matplotlib, Plotly, plotnine, Pygal, Seaborn; R: ggplot2; JavaScript: Chart.js, D3.js, Apache ECharts, Highcharts, MUI X Charts. Compare all 15 side by side: Polar Line Plot in Python, R, Julia and JavaScript.
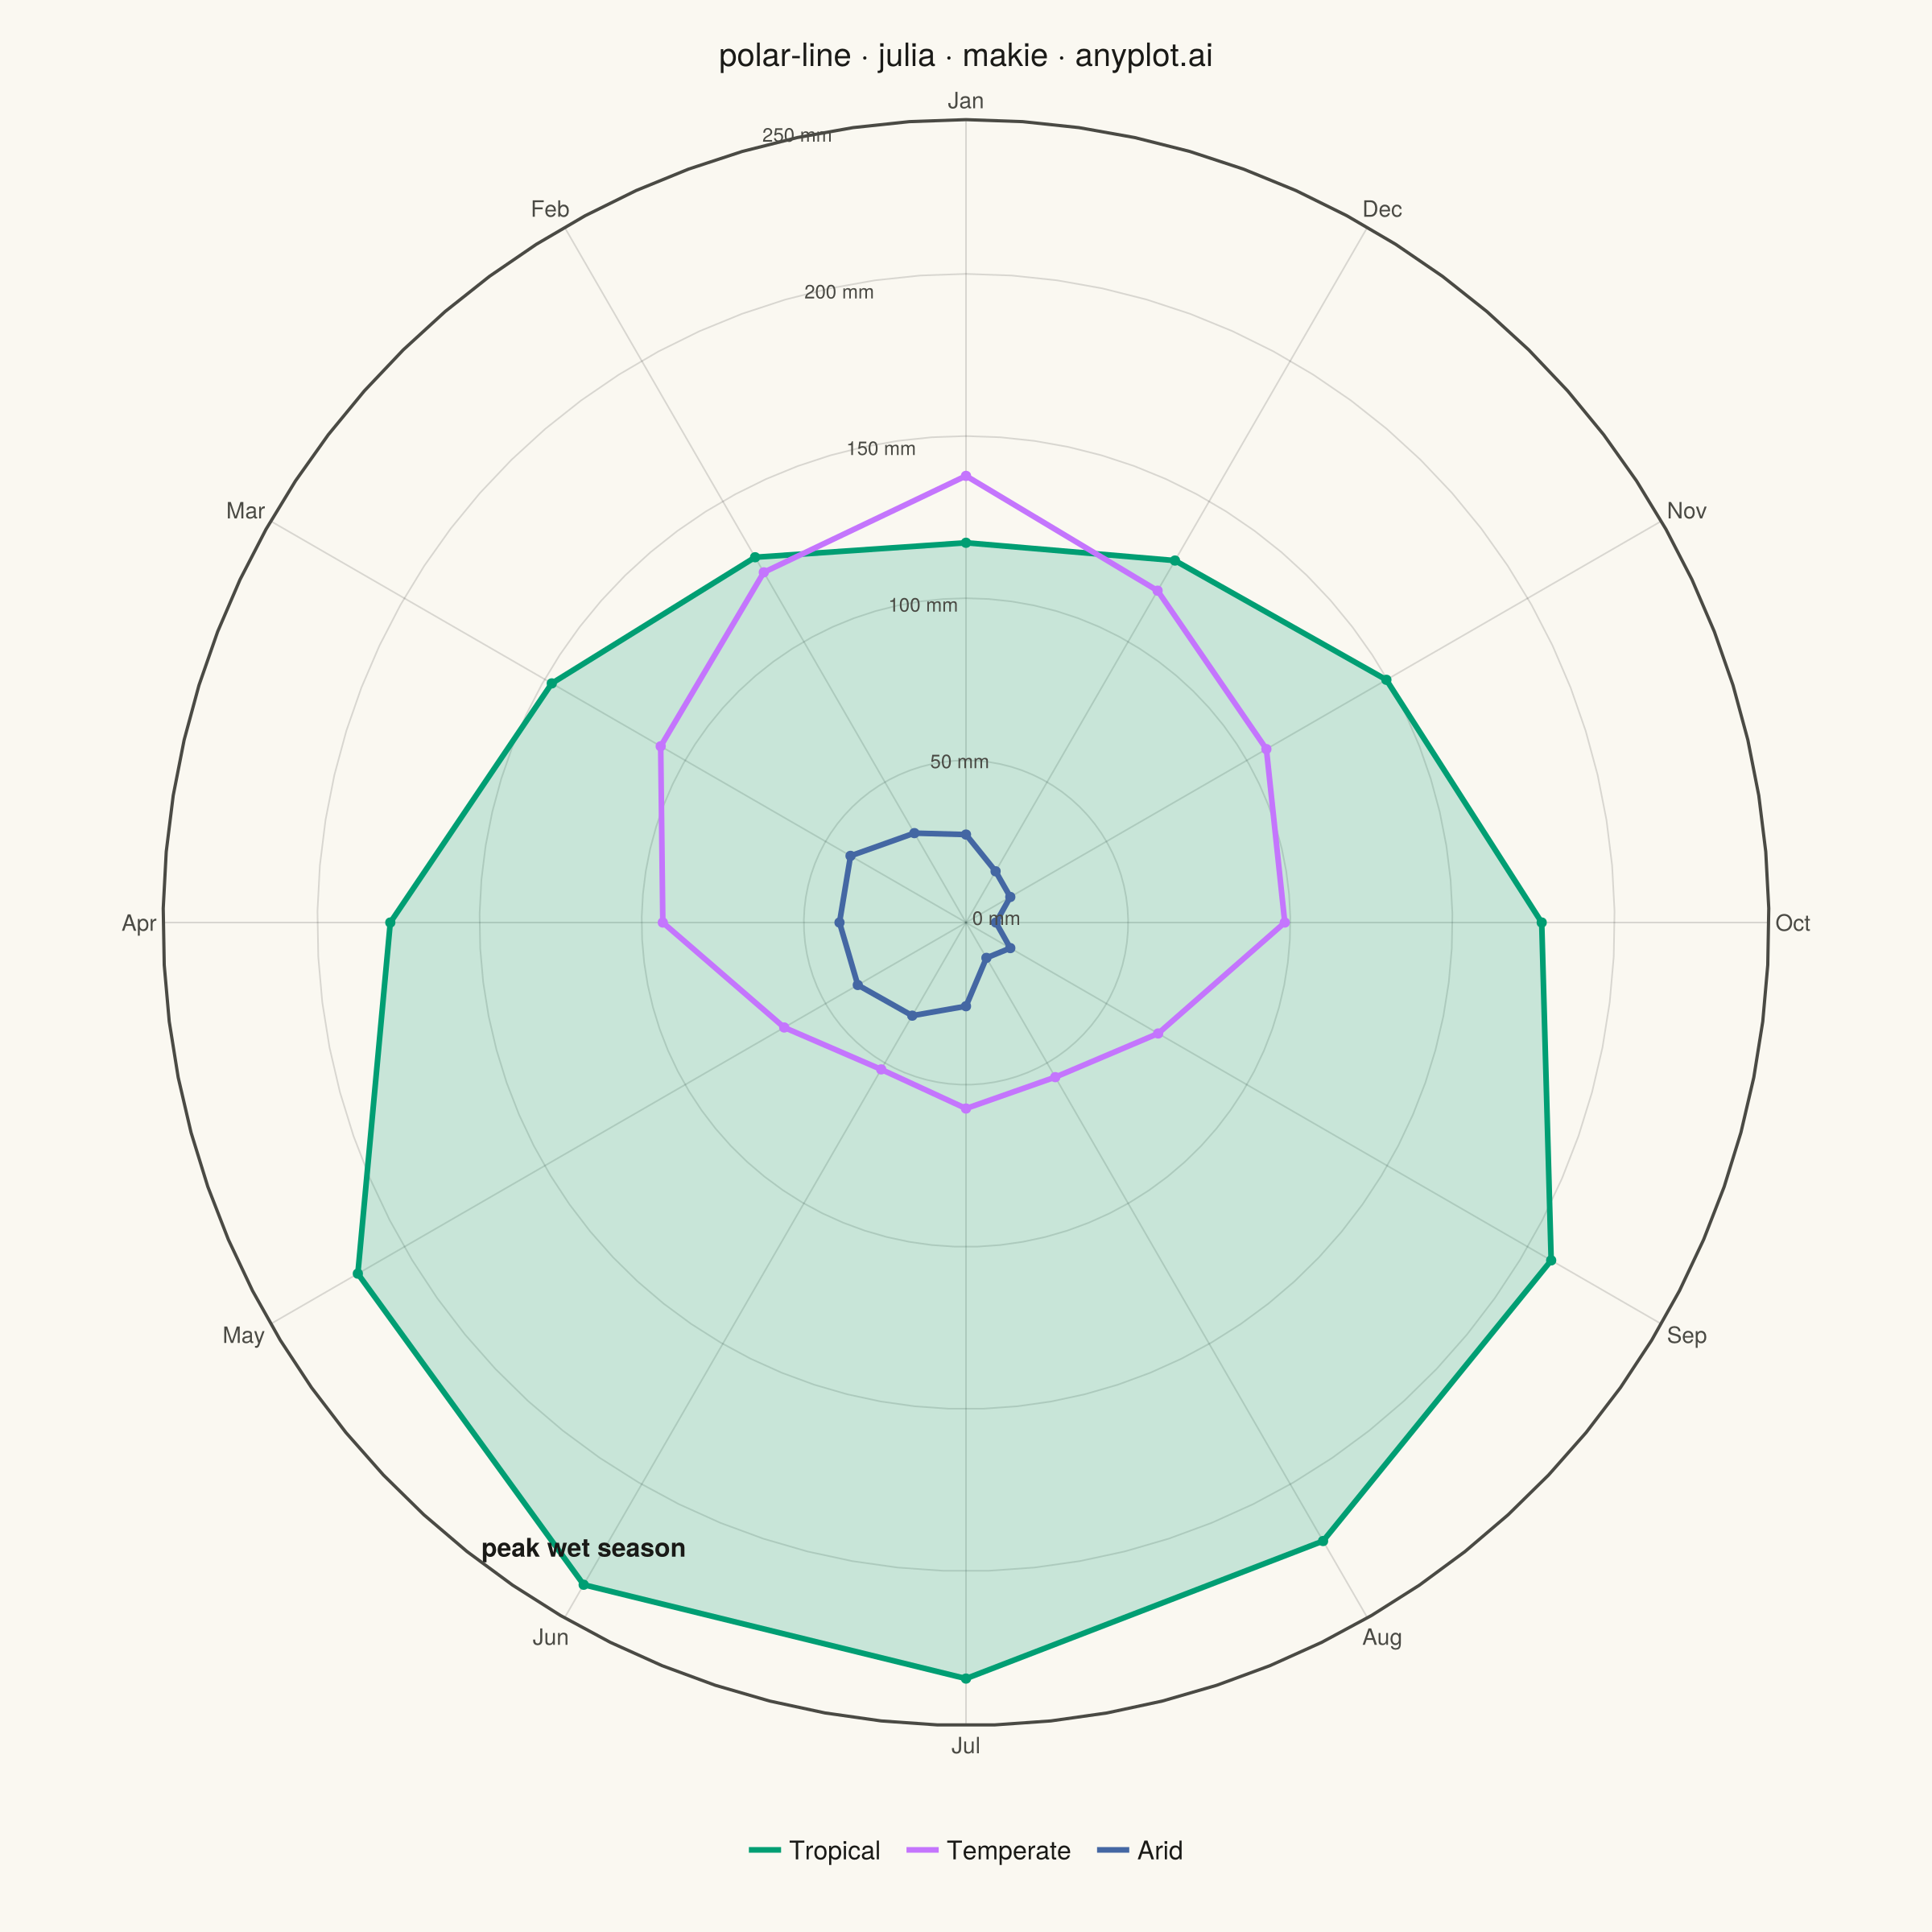
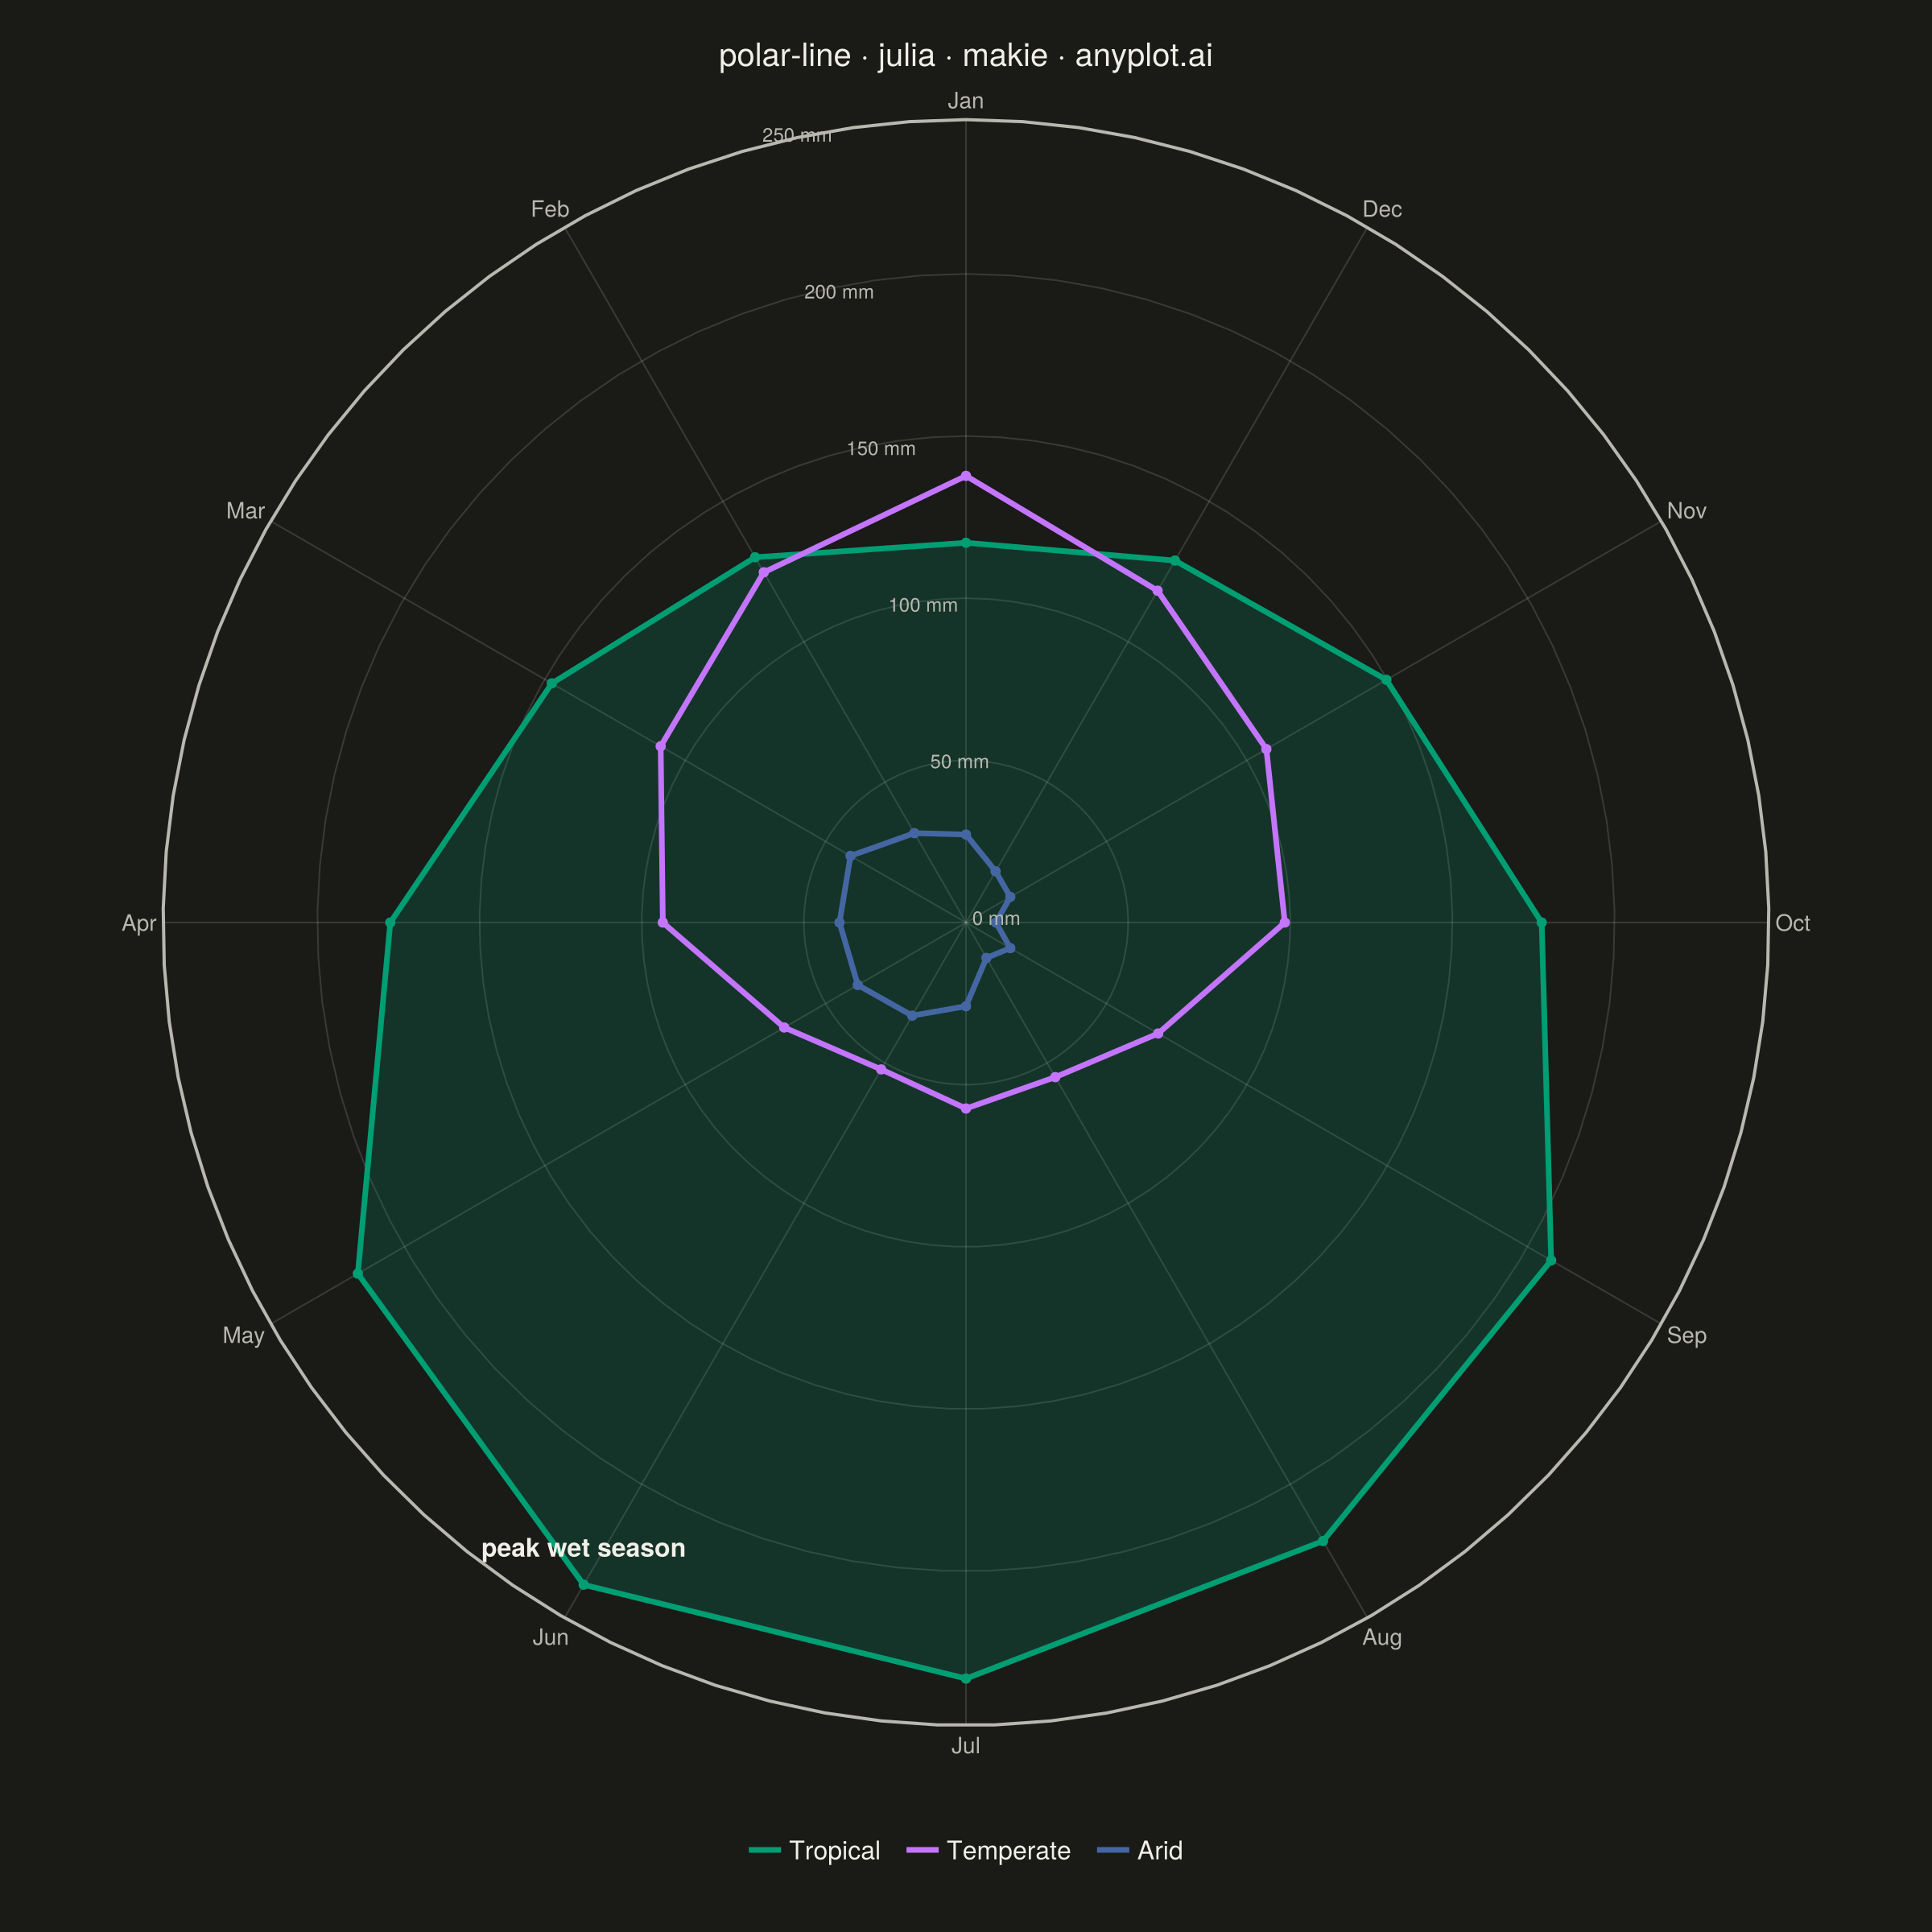
A line plot rendered in polar coordinates, where data points are connected with lines around a circular axis. The angle (theta) typically represents a cyclical variable while the radius shows magnitude.
# anyplot.ai
# polar-line: Polar Line Plot
# Library: makie 0.21.9 | Julia 1.11.9
# Quality: 89/100 | Created: 2026-09-05

using CairoMakie
using Colors
using Random

Random.seed!(42)

# --- Theme tokens -------------------------------------------------------------
const THEME       = get(ENV, "ANYPLOT_THEME", "light")
const PAGE_BG     = THEME == "light" ? colorant"#FAF8F1" : colorant"#1A1A17"
const ELEVATED_BG = THEME == "light" ? colorant"#FFFDF6" : colorant"#242420"
const INK         = THEME == "light" ? colorant"#1A1A17" : colorant"#F0EFE8"
const INK_SOFT    = THEME == "light" ? colorant"#4A4A44" : colorant"#B8B7B0"
const IMPRINT_PALETTE = [
    colorant"#009E73", colorant"#C475FD", colorant"#4467A3", colorant"#BD8233",
    colorant"#AE3030", colorant"#2ABCCD", colorant"#954477", colorant"#99B314",
]

# --- Data -----------------------------------------------------------------
# Average monthly rainfall (mm) across three climate zones — a seasonal cycle
month_labels = ["Jan", "Feb", "Mar", "Apr", "May", "Jun", "Jul", "Aug", "Sep", "Oct", "Nov", "Dec"]
months = 0:11

tropical = 180 .+ 60 .* sin.(2pi .* (months .- 3) ./ 12) .+ 8 .* randn(12)
temperate = 90 .+ 40 .* sin.(2pi .* (months .- 9) ./ 12) .+ 6 .* randn(12)
arid = 25 .+ 15 .* sin.(2pi .* months ./ 12) .+ 3 .* randn(12)

tropical = max.(tropical, 5.0)
temperate = max.(temperate, 5.0)
arid = max.(arid, 2.0)

theta = collect(months) ./ 12 .* 2pi
theta_closed = vcat(theta, 2pi)  # wrap December back to January to close each loop

tropical_closed = vcat(tropical, tropical[1])
temperate_closed = vcat(temperate, temperate[1])
arid_closed = vcat(arid, arid[1])

peak_idx = argmax(tropical)  # Tropical is the highest-variance series — the story to tell
peak_theta = theta[peak_idx]
peak_r = tropical[peak_idx]

# --- Plot -------------------------------------------------------------------
fig = Figure(size = (1200, 1200), backgroundcolor = PAGE_BG)

ax = PolarAxis(
    fig[1, 1];
    theta_0 = pi / 2,                  # January at the top
    direction = 1,                     # months advance counter-clockwise
    title = "polar-line · julia · makie · anyplot.ai",
    titlesize = 20,
    titlecolor = INK,
    backgroundcolor = PAGE_BG,
    thetaticks = (0:(pi / 6):(11pi / 6), month_labels),
    thetaticklabelsize = 14,
    thetaticklabelcolor = INK_SOFT,
    rticks = 0:50:250,
    rtickformat = values -> ["$(round(Int, v)) mm" for v in values],
    rtickangle = pi / 12,               # offset from the January spoke to avoid label clash
    rticklabelsize = 12,
    rticklabelcolor = INK_SOFT,
    spinecolor = INK_SOFT,
    rgridcolor = RGBAf(INK.r, INK.g, INK.b, 0.15),
    thetagridcolor = RGBAf(INK.r, INK.g, INK.b, 0.15),
)

# Fill under the highest-variance series gives the chart a focal point
band!(ax, theta_closed, zeros(length(theta_closed)), tropical_closed;
    color = (IMPRINT_PALETTE[1], 0.20))

lines!(ax, theta_closed, tropical_closed; color = IMPRINT_PALETTE[1], linewidth = 3.5)
lines!(ax, theta_closed, temperate_closed; color = IMPRINT_PALETTE[2], linewidth = 3.5)
lines!(ax, theta_closed, arid_closed; color = IMPRINT_PALETTE[3], linewidth = 3.5)

# Markers at each of the 12 monthly measurements, not just the interpolated line
scatter!(ax, theta, tropical; color = IMPRINT_PALETTE[1], markersize = 9, strokewidth = 0)
scatter!(ax, theta, temperate; color = IMPRINT_PALETTE[2], markersize = 9, strokewidth = 0)
scatter!(ax, theta, arid; color = IMPRINT_PALETTE[3], markersize = 9, strokewidth = 0)

# Callout on Tropical's wet-season peak — the clearest story in the data
text!(
    ax, peak_theta, peak_r;
    text = "peak wet season",
    color = INK,
    fontsize = 16,
    font = :bold,
    align = (:center, :bottom),
    offset = (0, 14),
)

# A slim row below the plot (not a side column) keeps the circle horizontally
# centered in the square canvas
Legend(
    fig[2, 1],
    [LineElement(color = IMPRINT_PALETTE[1], linewidth = 3.5),
     LineElement(color = IMPRINT_PALETTE[2], linewidth = 3.5),
     LineElement(color = IMPRINT_PALETTE[3], linewidth = 3.5)],
    ["Tropical", "Temperate", "Arid"];
    orientation = :horizontal,
    tellwidth = false,
    labelsize = 16,
    labelcolor = INK,
    backgroundcolor = ELEVATED_BG,
    framevisible = false,
)
colsize!(fig.layout, 1, Fixed(1200))
rowsize!(fig.layout, 2, Fixed(70))

# --- Save -------------------------------------------------------------------
save("plot-$(THEME).png", fig; px_per_unit = 2)
Runnable source as JSON, for any HTTP client: https://api.anyplot.ai/specs/polar-line/makie/code. Any spec id and library id listed in llms-full.txt fit the same URL shape; every URL below is complete and callable.
{
  "spec_id": "polar-line",
  "language": "julia",
  "library": "makie",
  "page": "https://anyplot.ai/polar-line/julia/makie",
  "hub": "https://anyplot.ai/polar-line",
  "code_json": "https://api.anyplot.ai/specs/polar-line/makie/code",
  "spec_json": "https://api.anyplot.ai/specs/polar-line",
  "render_light_png": "https://storage.googleapis.com/anyplot-images/plots/polar-line/julia/makie/plot-light.png",
  "render_dark_png": "https://storage.googleapis.com/anyplot-images/plots/polar-line/julia/makie/plot-dark.png",
  "quality_score": 89.0,
  "license": "MIT",
  "guide": "https://anyplot.ai/llms.txt"
}
Part of Polar Line Plot on anyplot.ai.