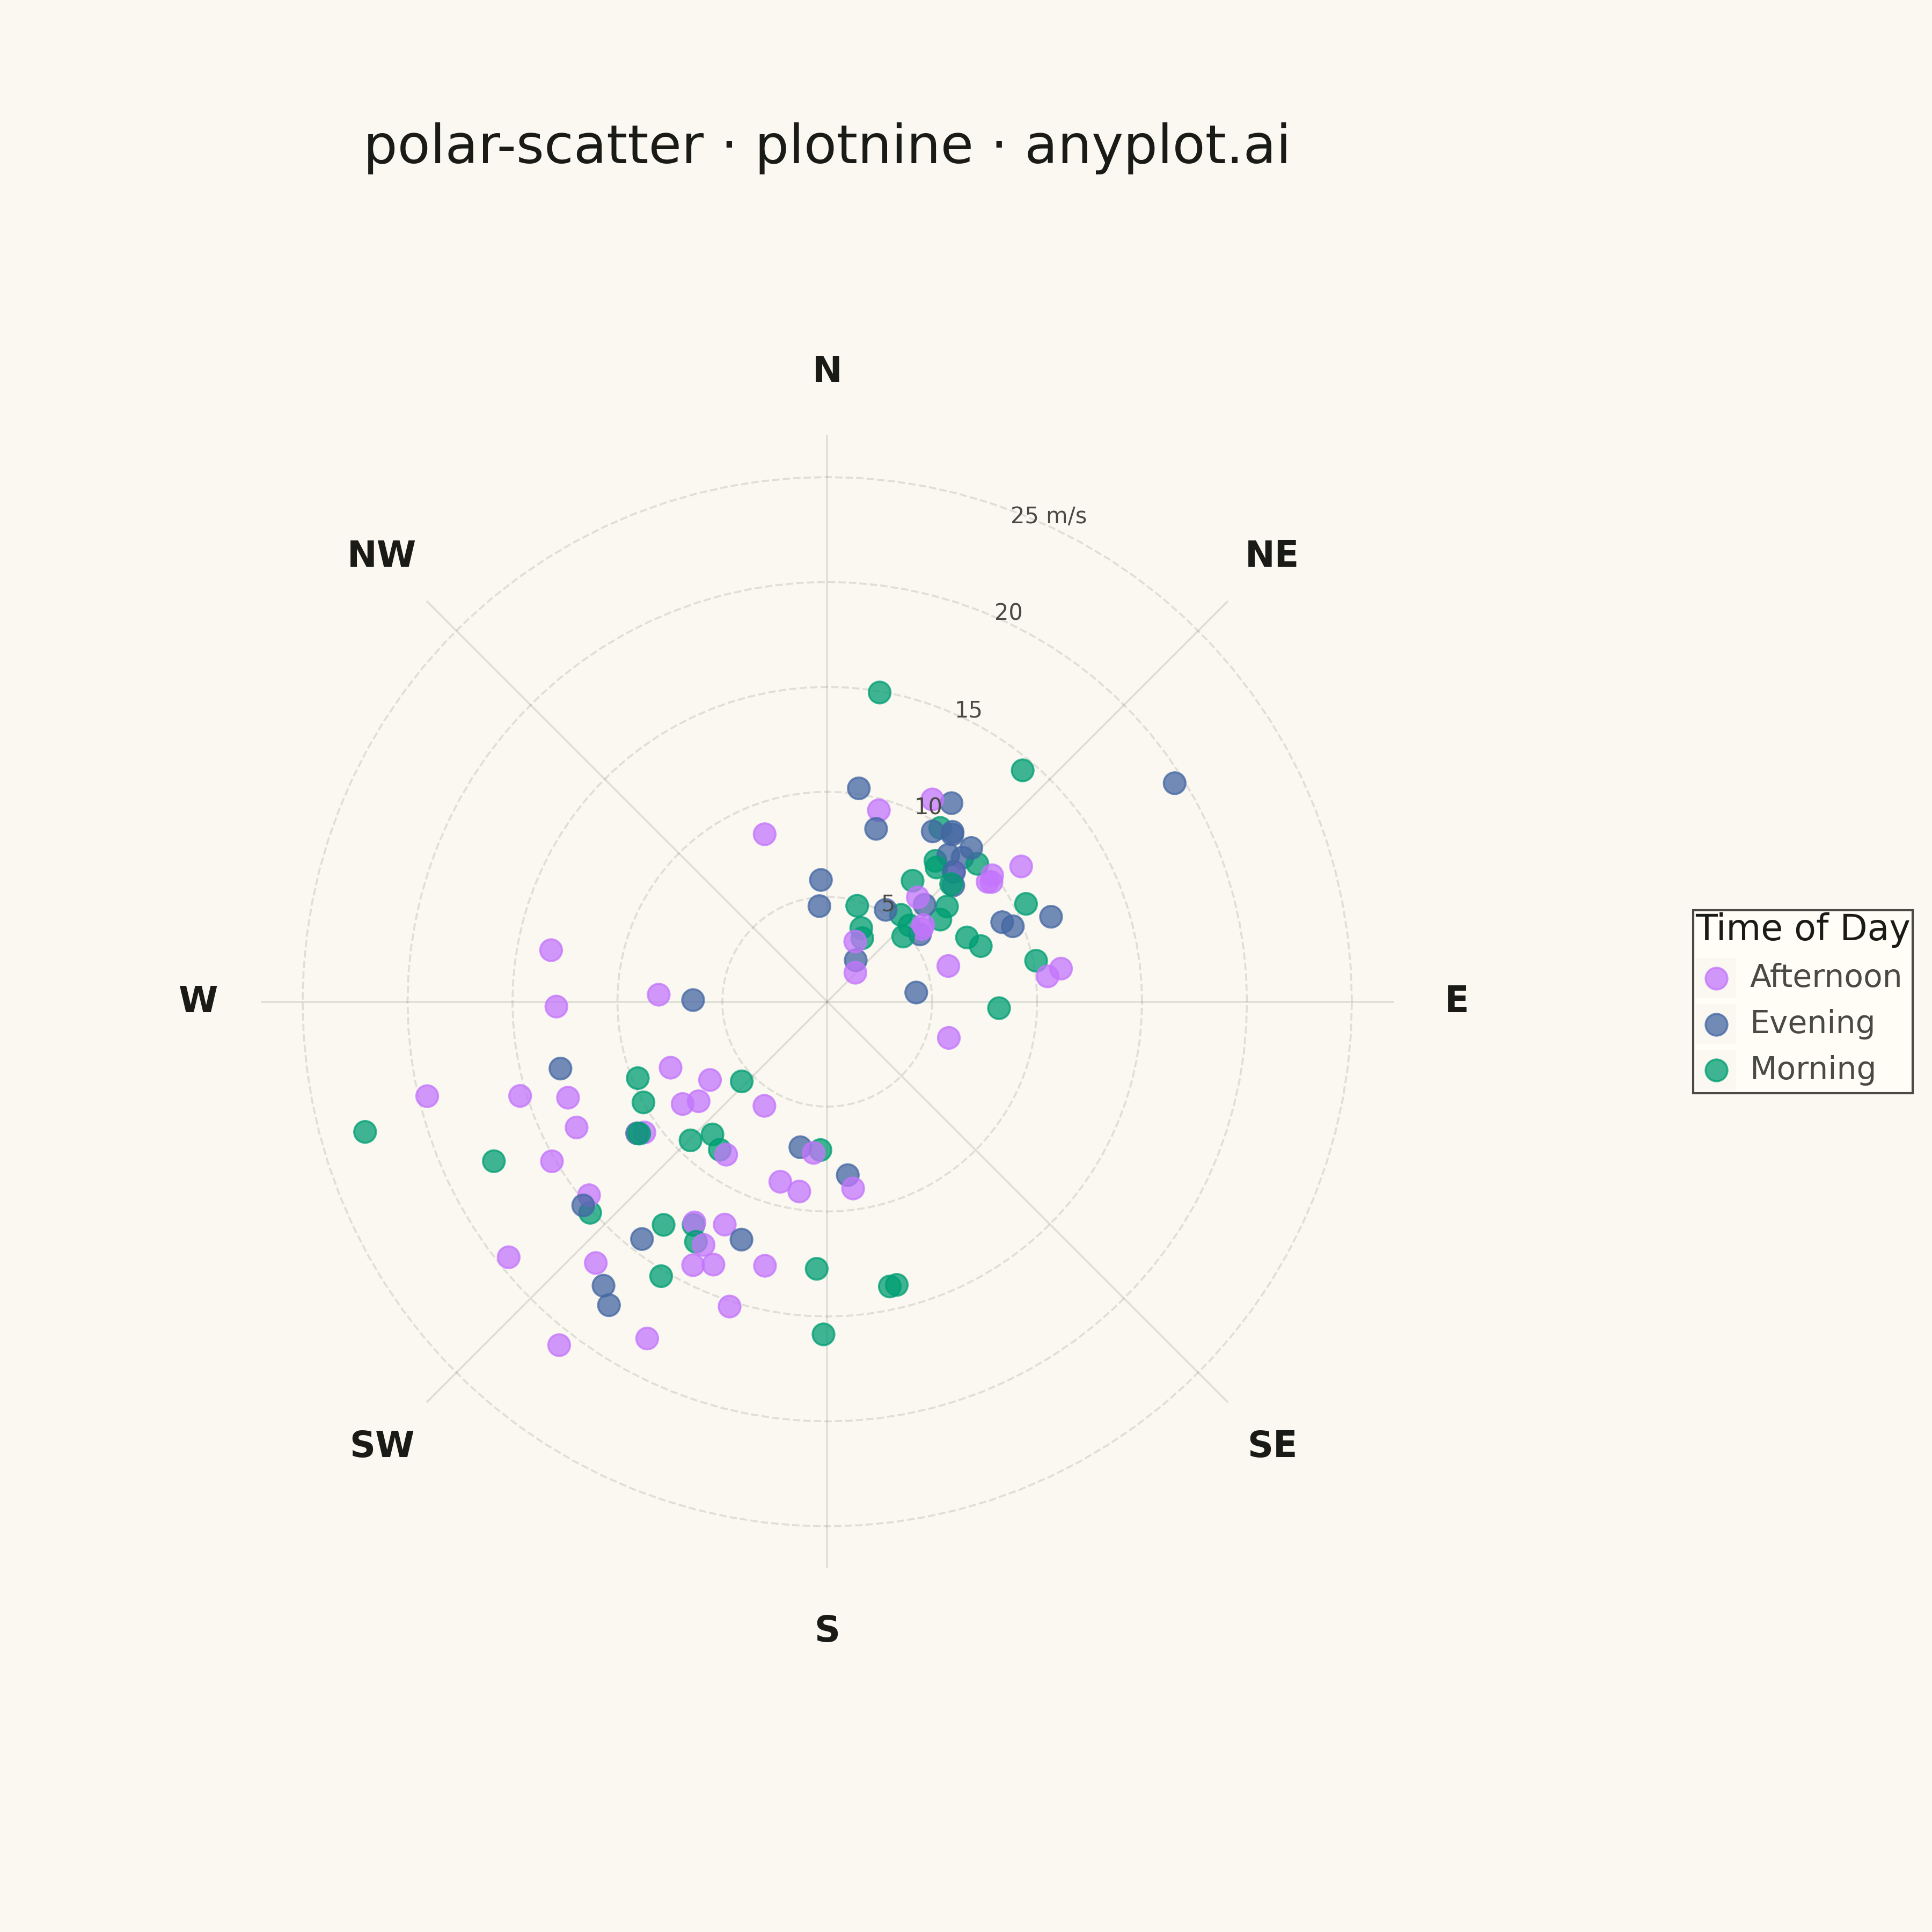
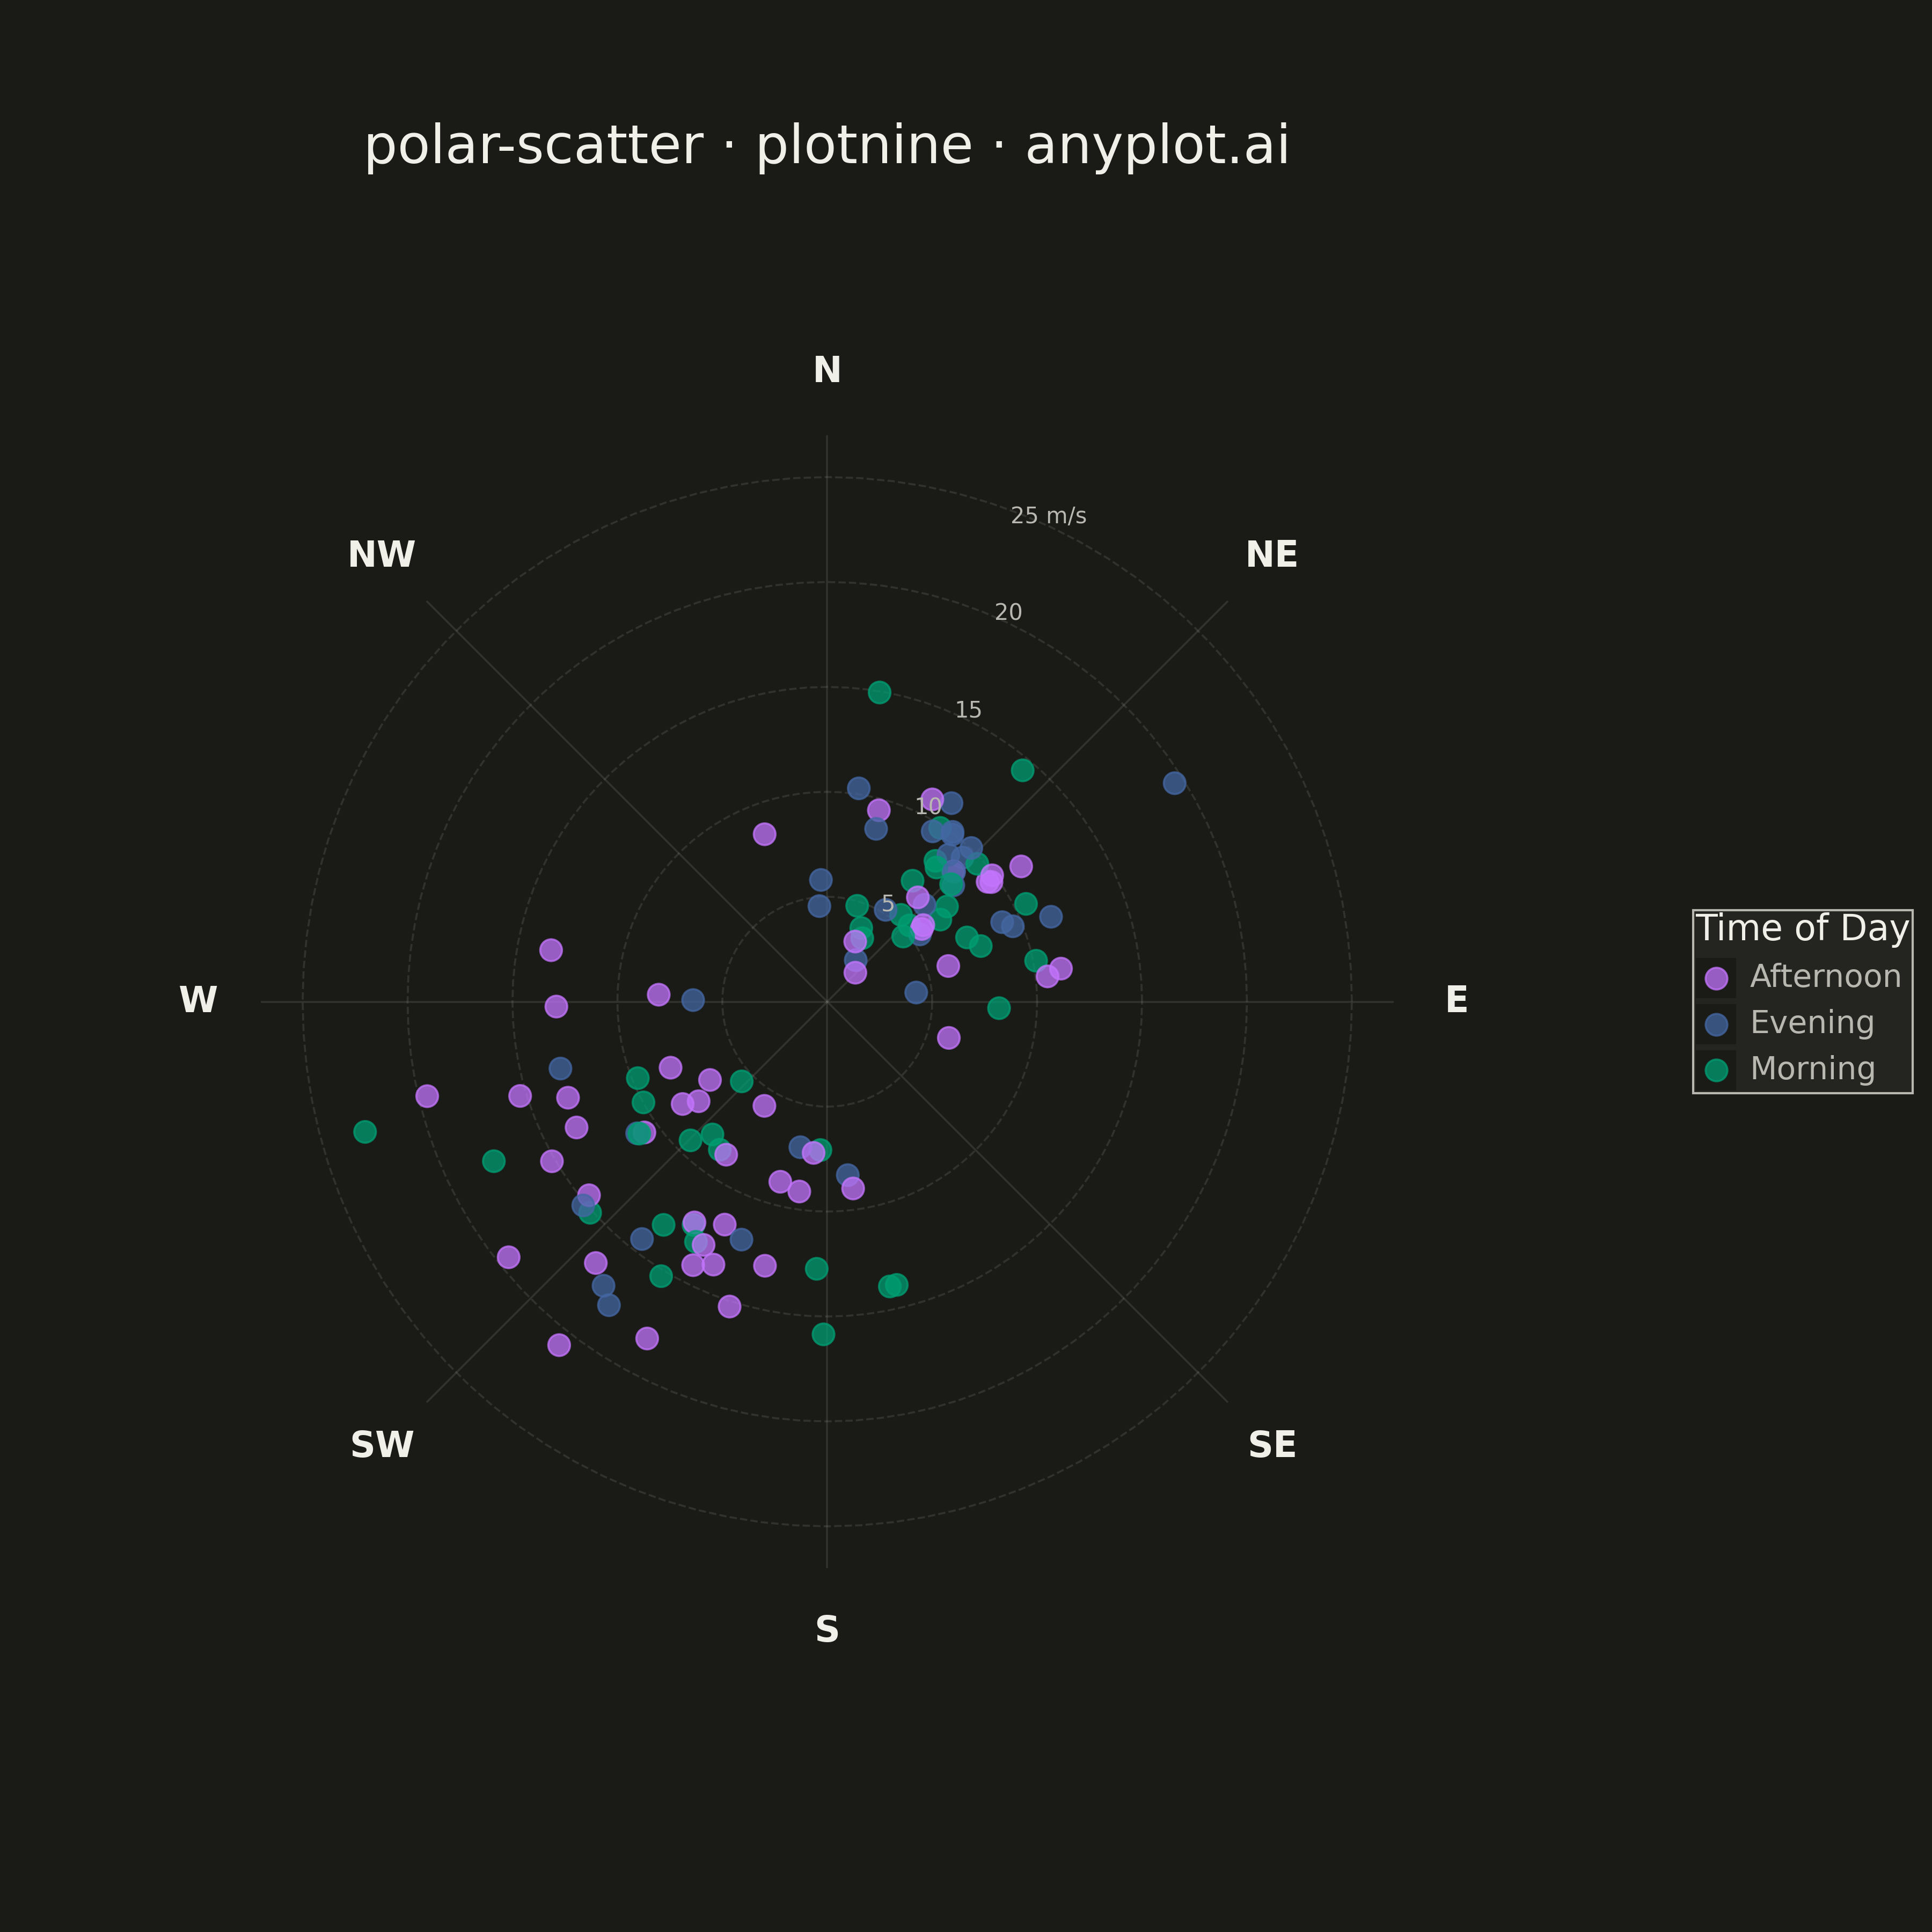
A scatter plot displayed in polar coordinates where data points are positioned using angle (theta) and radius (r) rather than Cartesian x and y coordinates. This visualization is particularly effective for cyclical or directional data where the angular component carries meaningful information.
Preview render from the plotnine implementation.