The same plot in 14 other libraries — Python: Altair, Bokeh, lets-plot, Matplotlib, Plotly, plotnine, Pygal, Seaborn; R: ggplot2; JavaScript: Chart.js, D3.js, Apache ECharts, Highcharts, MUI X Charts. Compare all 15 side by side: Polar Scatter Plot in Python, R, Julia and JavaScript.
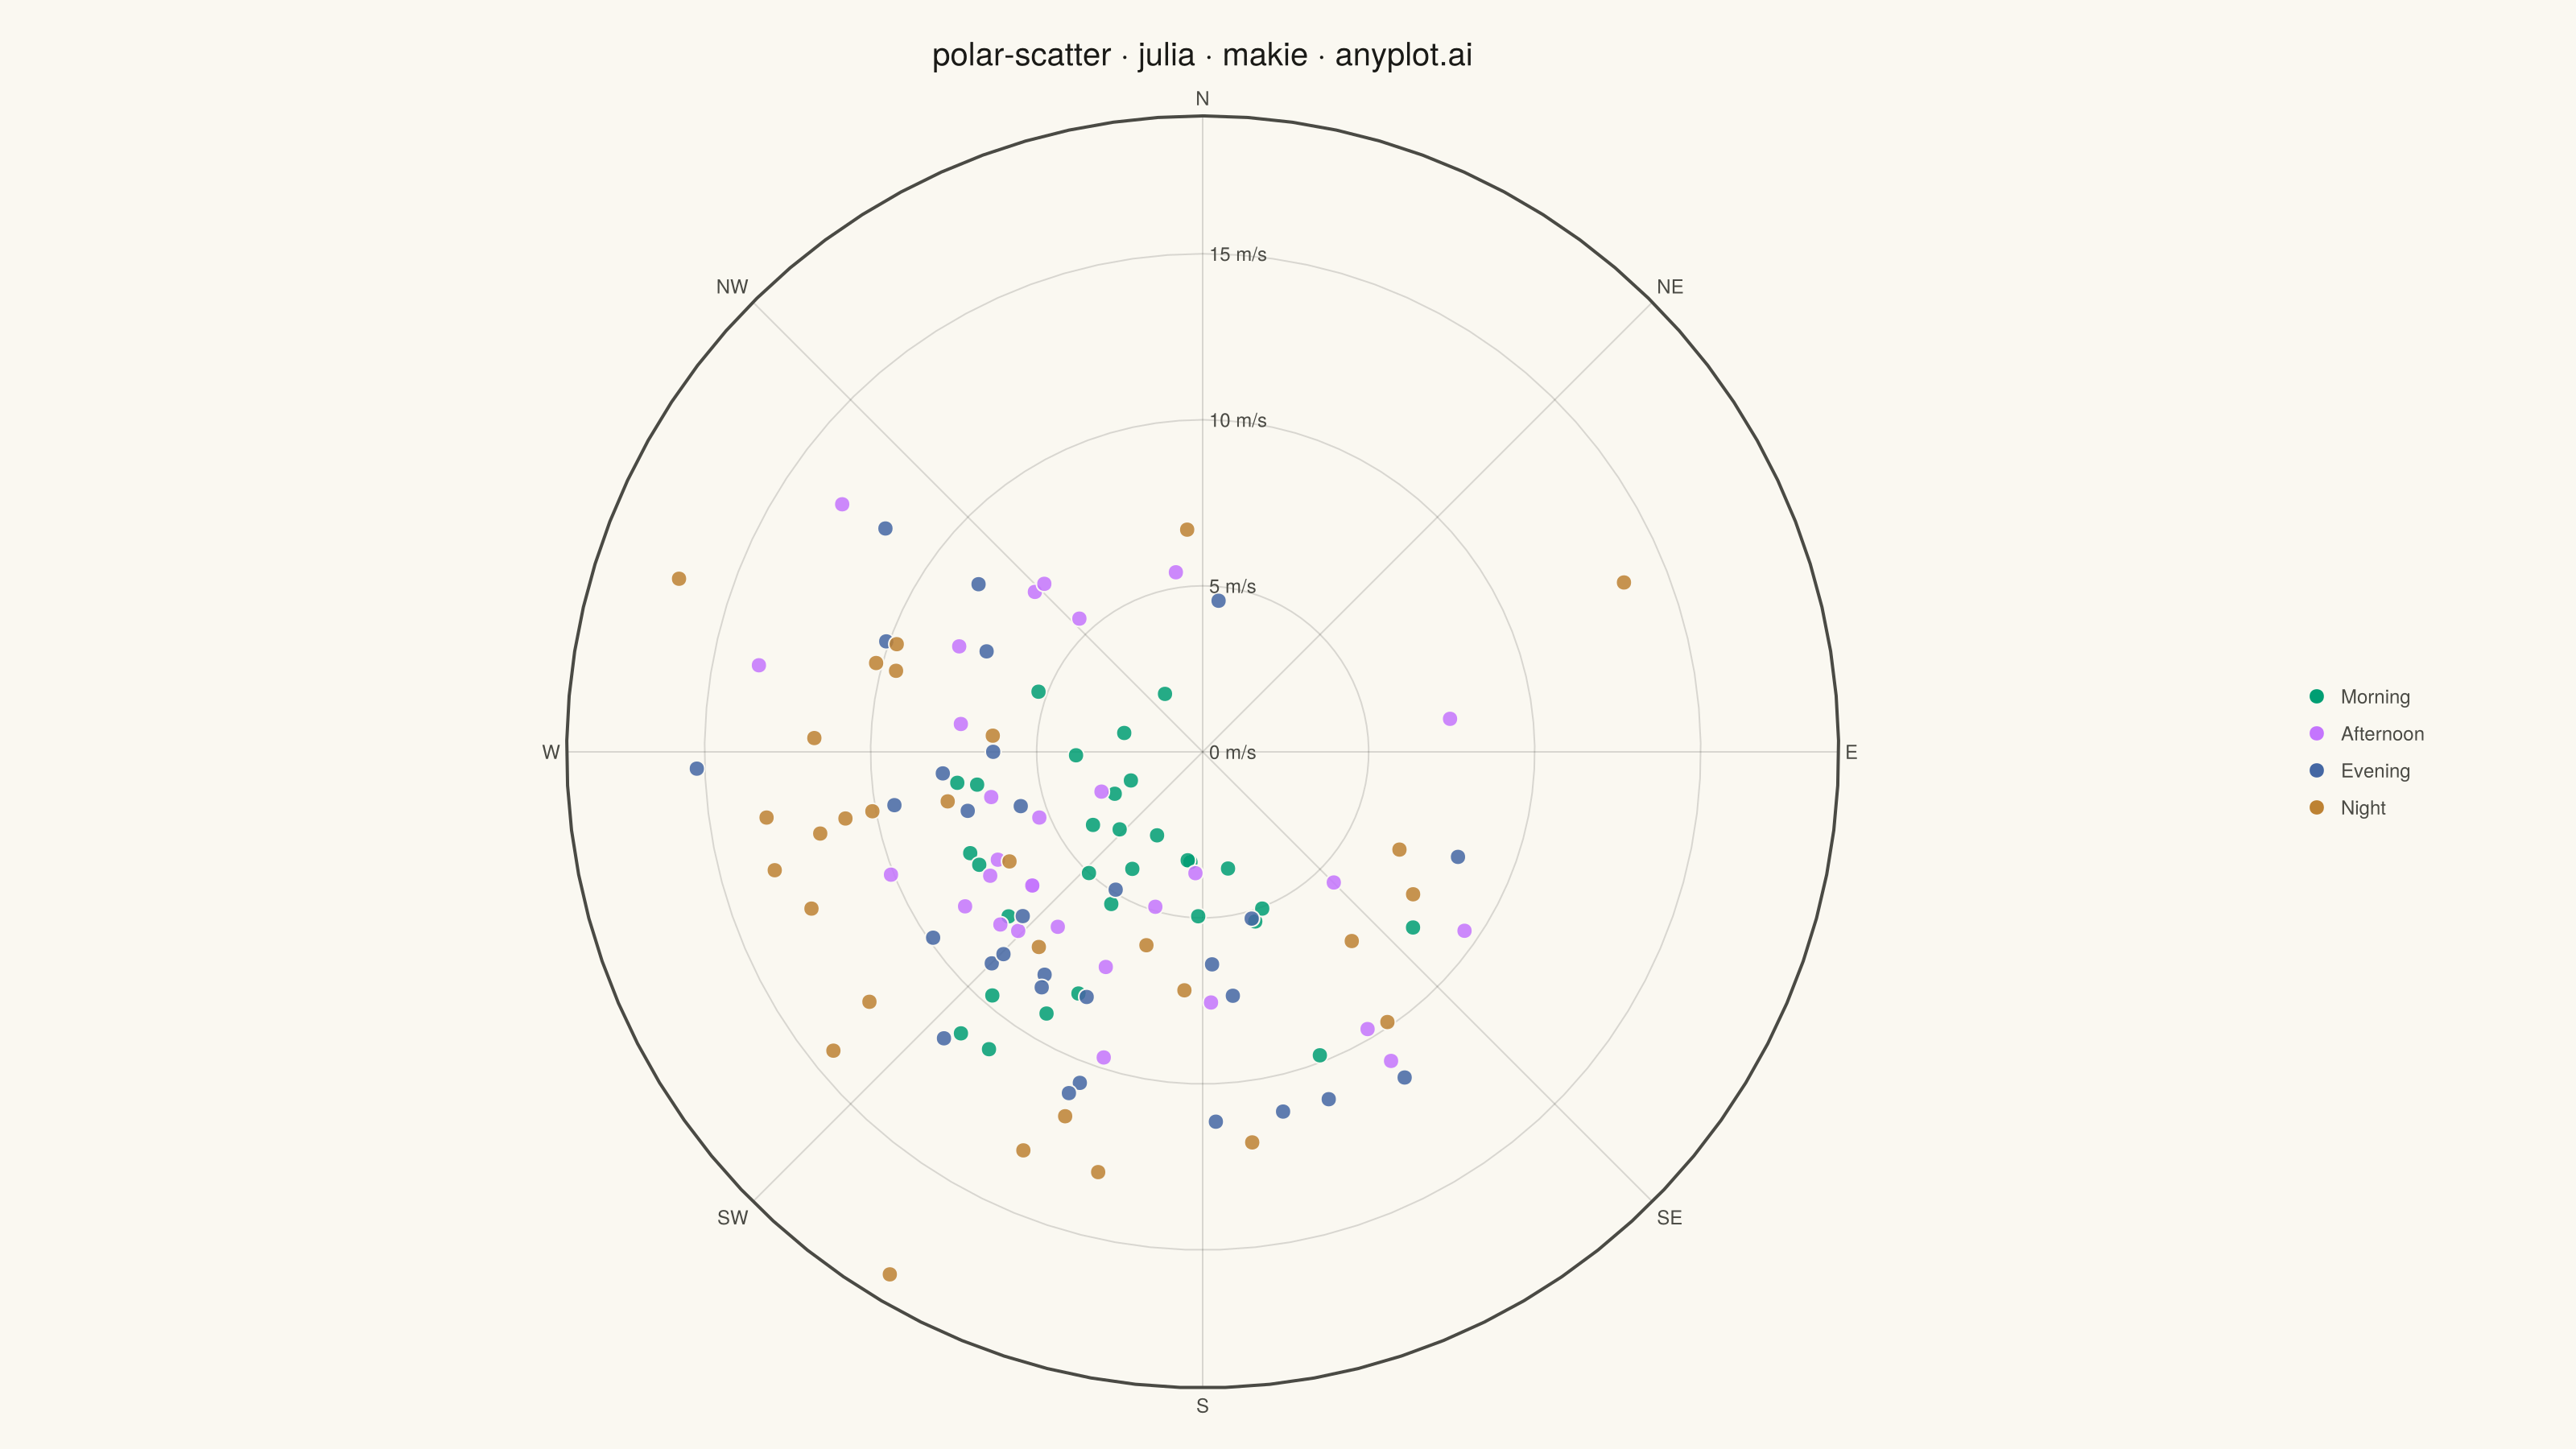
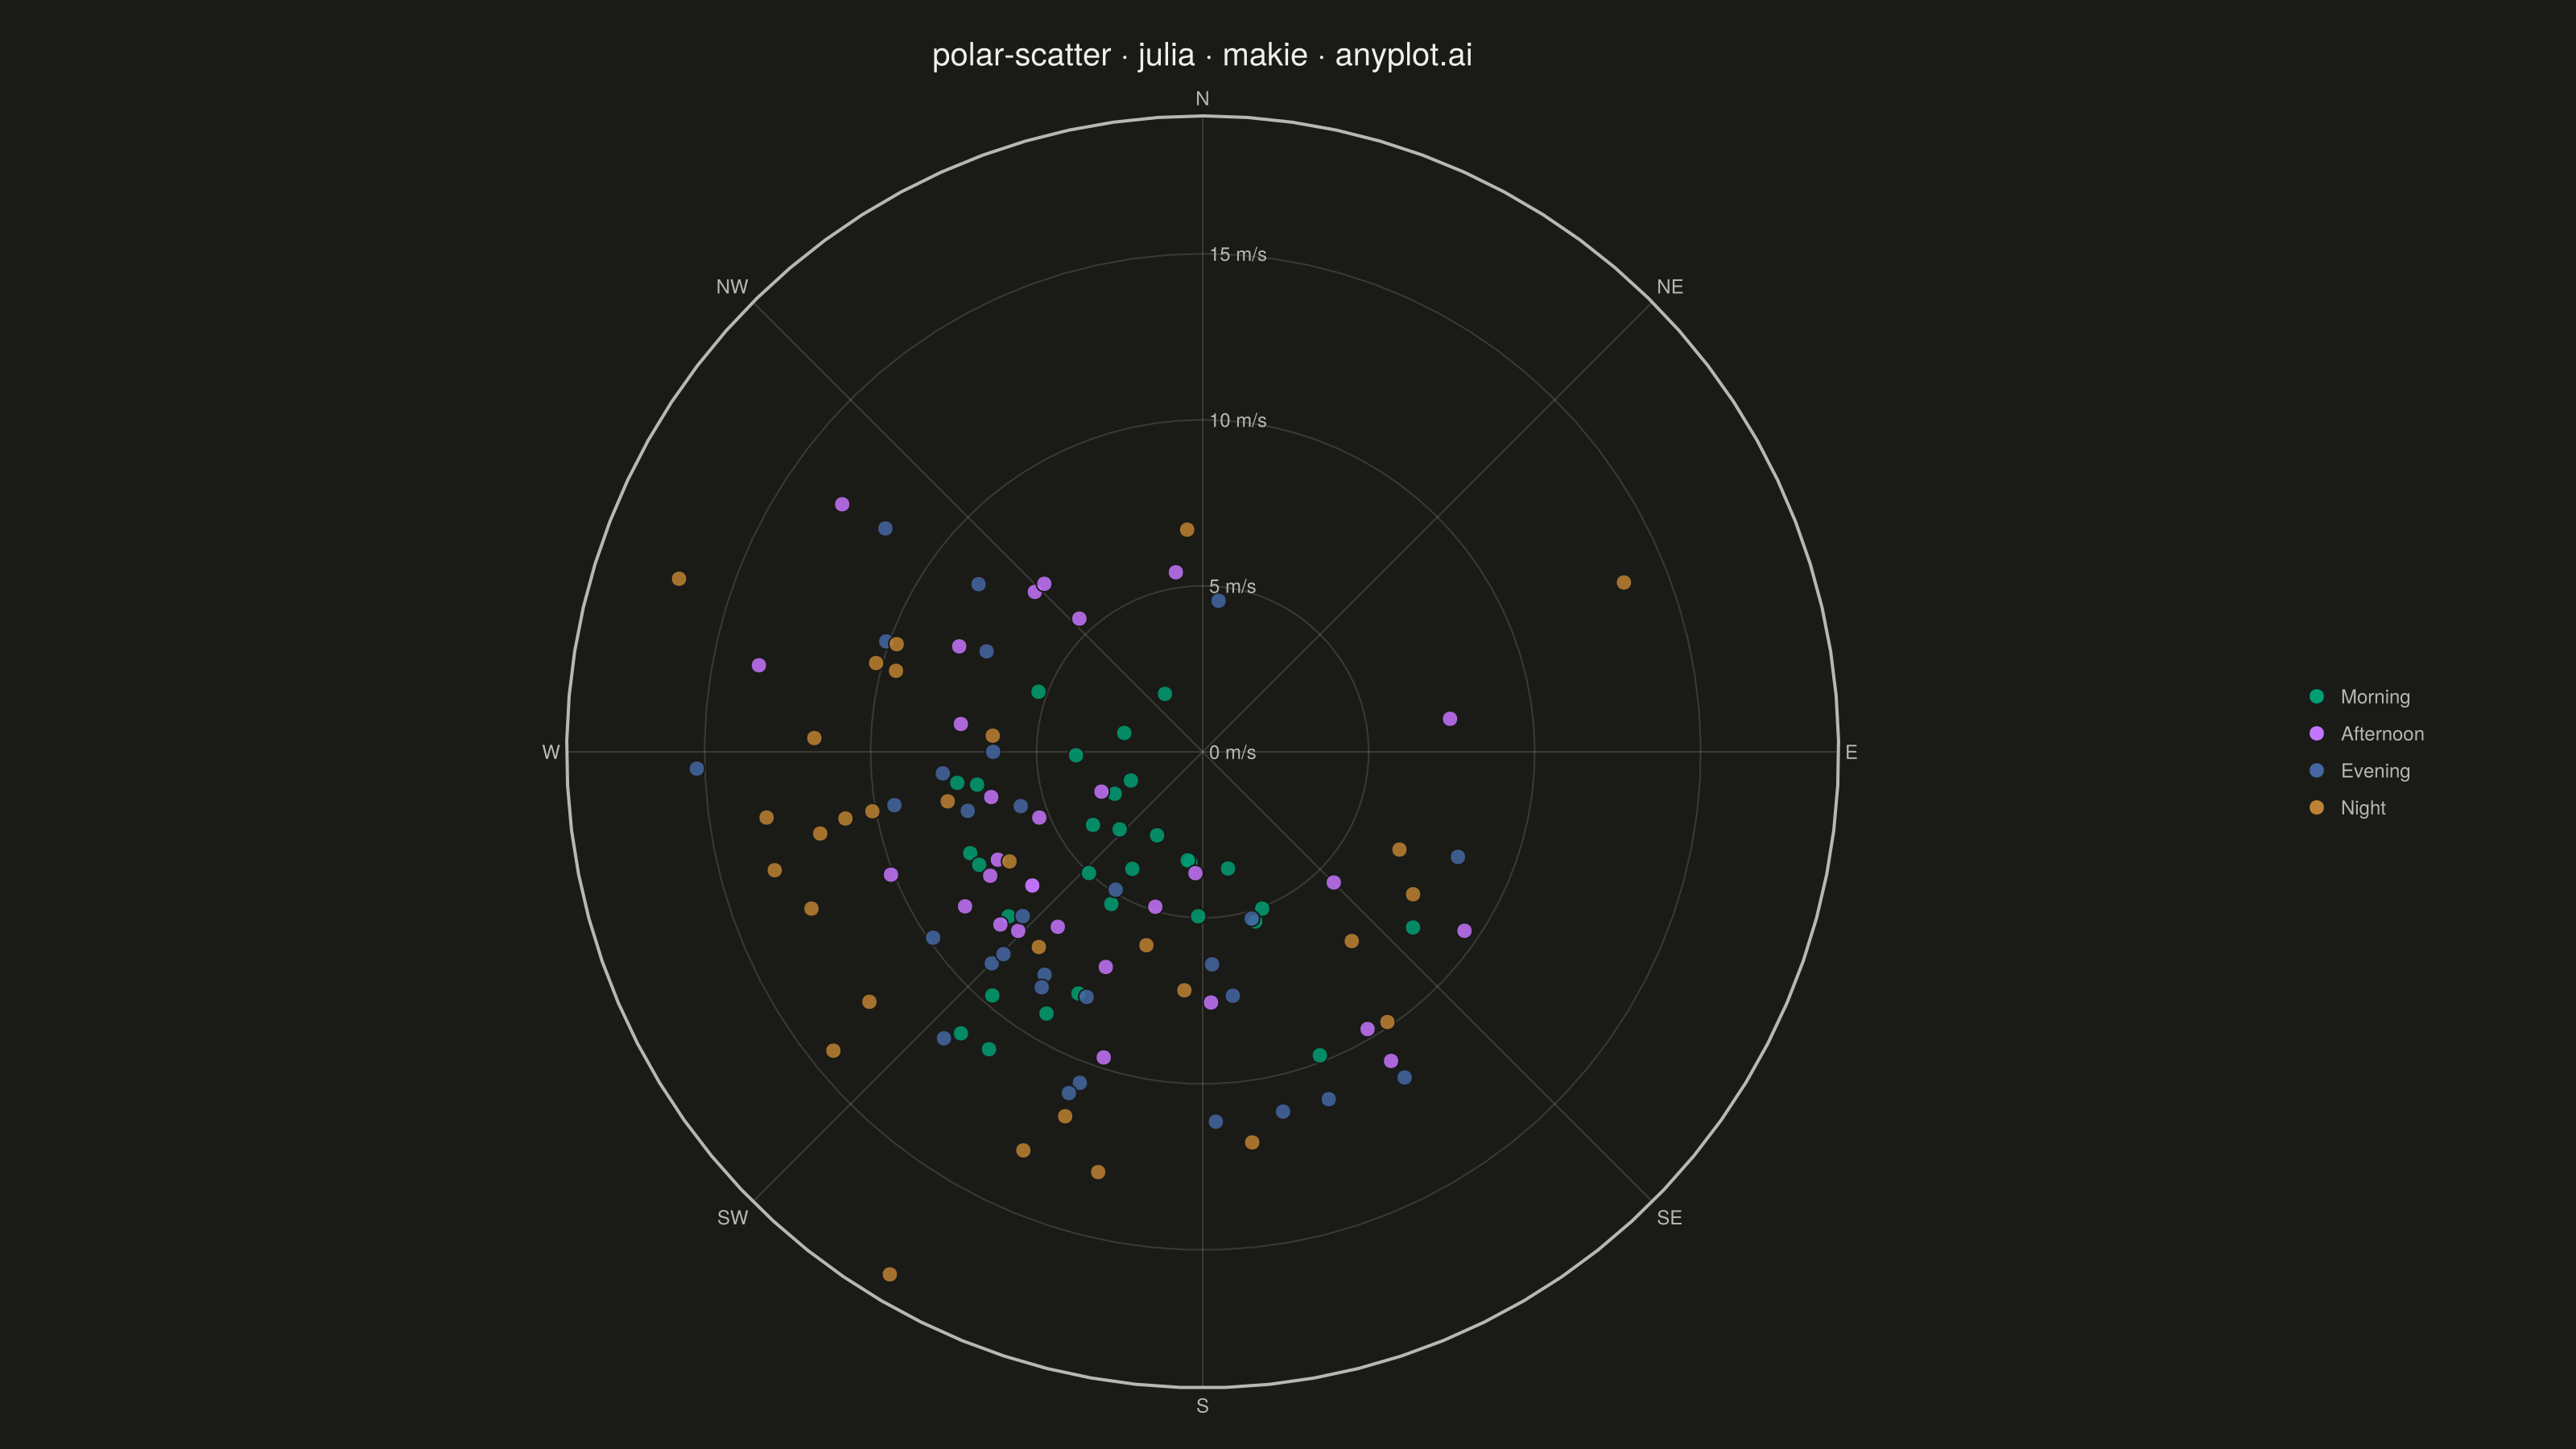
A scatter plot displayed in polar coordinates where data points are positioned using angle (theta) and radius (r) rather than Cartesian x and y coordinates. This visualization is particularly effective for cyclical or directional data where the angular component carries meaningful information.
# anyplot.ai
# polar-scatter: Polar Scatter Plot
# Library: makie 0.21.9 | Julia 1.11.9
# Quality: 80/100 | Created: 2026-09-05

using CairoMakie
using Colors
using Random

Random.seed!(42)

# Theme tokens (see prompts/default-style-guide.md "Background" + "Theme-adaptive Chrome")
THEME = get(ENV, "ANYPLOT_THEME", "light")
PAGE_BG = THEME == "light" ? colorant"#FAF8F1" : colorant"#1A1A17"
ELEVATED_BG = THEME == "light" ? colorant"#FFFDF6" : colorant"#242420"
INK = THEME == "light" ? colorant"#1A1A17" : colorant"#F0EFE8"
INK_SOFT = THEME == "light" ? colorant"#4A4A44" : colorant"#B8B7B0"
GRID = THEME == "light" ? RGBAf(0.102, 0.102, 0.090, 0.15) : RGBAf(0.941, 0.937, 0.910, 0.15)

# Imprint palette (see prompts/default-style-guide.md "Categorical Palette") — first 4 positions
IMPRINT_PALETTE = [
    colorant"#009E73",  # 1 — brand green — ALWAYS first series
    colorant"#C475FD",  # 2 — lavender
    colorant"#4467A3",  # 3 — blue
    colorant"#BD8233",  # 4 — ochre
]

# Data — wind observations: bearing (compass direction the wind blows FROM) and speed,
# clustered around a south-southwesterly prevailing direction, split by time of day.
# 205° is deliberately offset from the 45°-spaced compass ticks (S=180°, SW=225°) so
# the prevailing-direction indicator below never sits directly on top of a gridline spoke.
time_of_day = ["Morning", "Afternoon", "Evening", "Night"]
n_per_period = 30
prevailing_bearing = 205.0

wind_bearing_deg = Float64[]
wind_speed = Float64[]
period_index = Int[]
for (i, period) in enumerate(time_of_day)
    spread = 35.0 + 10.0 * i
    bearings = mod.(prevailing_bearing .+ spread .* randn(n_per_period), 360.0)
    speeds = abs.(4.0 .+ 1.6 .* randn(n_per_period)) .+ 1.0 * i
    append!(wind_bearing_deg, bearings)
    append!(wind_speed, speeds)
    append!(period_index, fill(i, n_per_period))
end
wind_bearing_rad = deg2rad.(wind_bearing_deg)

# Plot
fig = Figure(size = (1600, 900), fontsize = 14, backgroundcolor = PAGE_BG)

ax = PolarAxis(
    fig[1, 1];
    title = "polar-scatter · julia · makie · anyplot.ai",
    titlesize = 20,
    titlecolor = INK,
    theta_0 = -pi / 2,
    direction = -1,
    thetaticks = ((0:45:315) .* pi / 180, ["N", "NE", "E", "SE", "S", "SW", "W", "NW"]),
    thetaticklabelsize = 12,
    thetaticklabelcolor = INK_SOFT,
    rticks = 0:4:12,
    rlimits = (0.0, 14.0),  # tight to the actual data extent (max ≈ 12.4 m/s), no dead outer ring
    rticklabelsize = 12,
    rticklabelcolor = INK_SOFT,
    rtickformat = values -> ["$(round(Int, v)) m/s" for v in values],
    rtickangle = pi / 4,  # place radial tick labels near NE, clear of the SW data cluster
    spinecolor = INK_SOFT,
    rgridcolor = GRID,
    thetagridcolor = GRID,
    backgroundcolor = PAGE_BG,
)

series_plots = []
for (i, period) in enumerate(time_of_day)
    mask = period_index .== i
    p = scatter!(
        ax, wind_bearing_rad[mask], wind_speed[mask];
        color = IMPRINT_PALETTE[i], markersize = 9, alpha = 0.6,
        strokewidth = 1, strokecolor = PAGE_BG, label = period,
    )
    push!(series_plots, p)
end

# Prevailing-direction focal point: circular mean bearing across all observations,
# drawn on top of the data as a bold dashed spoke reaching just short of the axis
# edge, clear of every 45°-spaced compass gridline (see prevailing_bearing note above)
mean_bearing_rad = atan(sum(sin, wind_bearing_rad), sum(cos, wind_bearing_rad))
lines!(
    ax, fill(mean_bearing_rad, 2), [0.0, 12.2];
    color = INK, linestyle = :dash, linewidth = 2.5,
)
text!(
    ax, mean_bearing_rad, 13.0;
    text = "prevailing", color = INK, fontsize = 13, font = :bold,
    align = (:center, :center),
)

Legend(
    fig[1, 2], series_plots, time_of_day;
    labelcolor = INK_SOFT, labelsize = 12,
    backgroundcolor = ELEVATED_BG, framevisible = false,
)
colsize!(fig.layout, 1, Relative(0.85))

# Save
save("plot-$(THEME).png", fig; px_per_unit = 2)
Runnable source as JSON, for any HTTP client: https://api.anyplot.ai/specs/polar-scatter/makie/code. Any spec id and library id listed in llms-full.txt fit the same URL shape; every URL below is complete and callable.
{
  "spec_id": "polar-scatter",
  "language": "julia",
  "library": "makie",
  "page": "https://anyplot.ai/polar-scatter/julia/makie",
  "hub": "https://anyplot.ai/polar-scatter",
  "code_json": "https://api.anyplot.ai/specs/polar-scatter/makie/code",
  "spec_json": "https://api.anyplot.ai/specs/polar-scatter",
  "render_light_png": "https://storage.googleapis.com/anyplot-images/plots/polar-scatter/julia/makie/plot-light.png",
  "render_dark_png": "https://storage.googleapis.com/anyplot-images/plots/polar-scatter/julia/makie/plot-dark.png",
  "quality_score": 80.0,
  "license": "MIT",
  "guide": "https://anyplot.ai/llms.txt"
}
Part of Polar Scatter Plot on anyplot.ai.