The same plot in 14 other libraries — JavaScript: Chart.js, D3.js, Apache ECharts, Highcharts; Python: Altair, Bokeh, lets-plot, Matplotlib, Plotly, plotnine, Pygal, Seaborn; R: ggplot2; Julia: Makie.jl. Compare all 15 side by side: Polar Scatter Plot in Python, R, Julia and JavaScript.
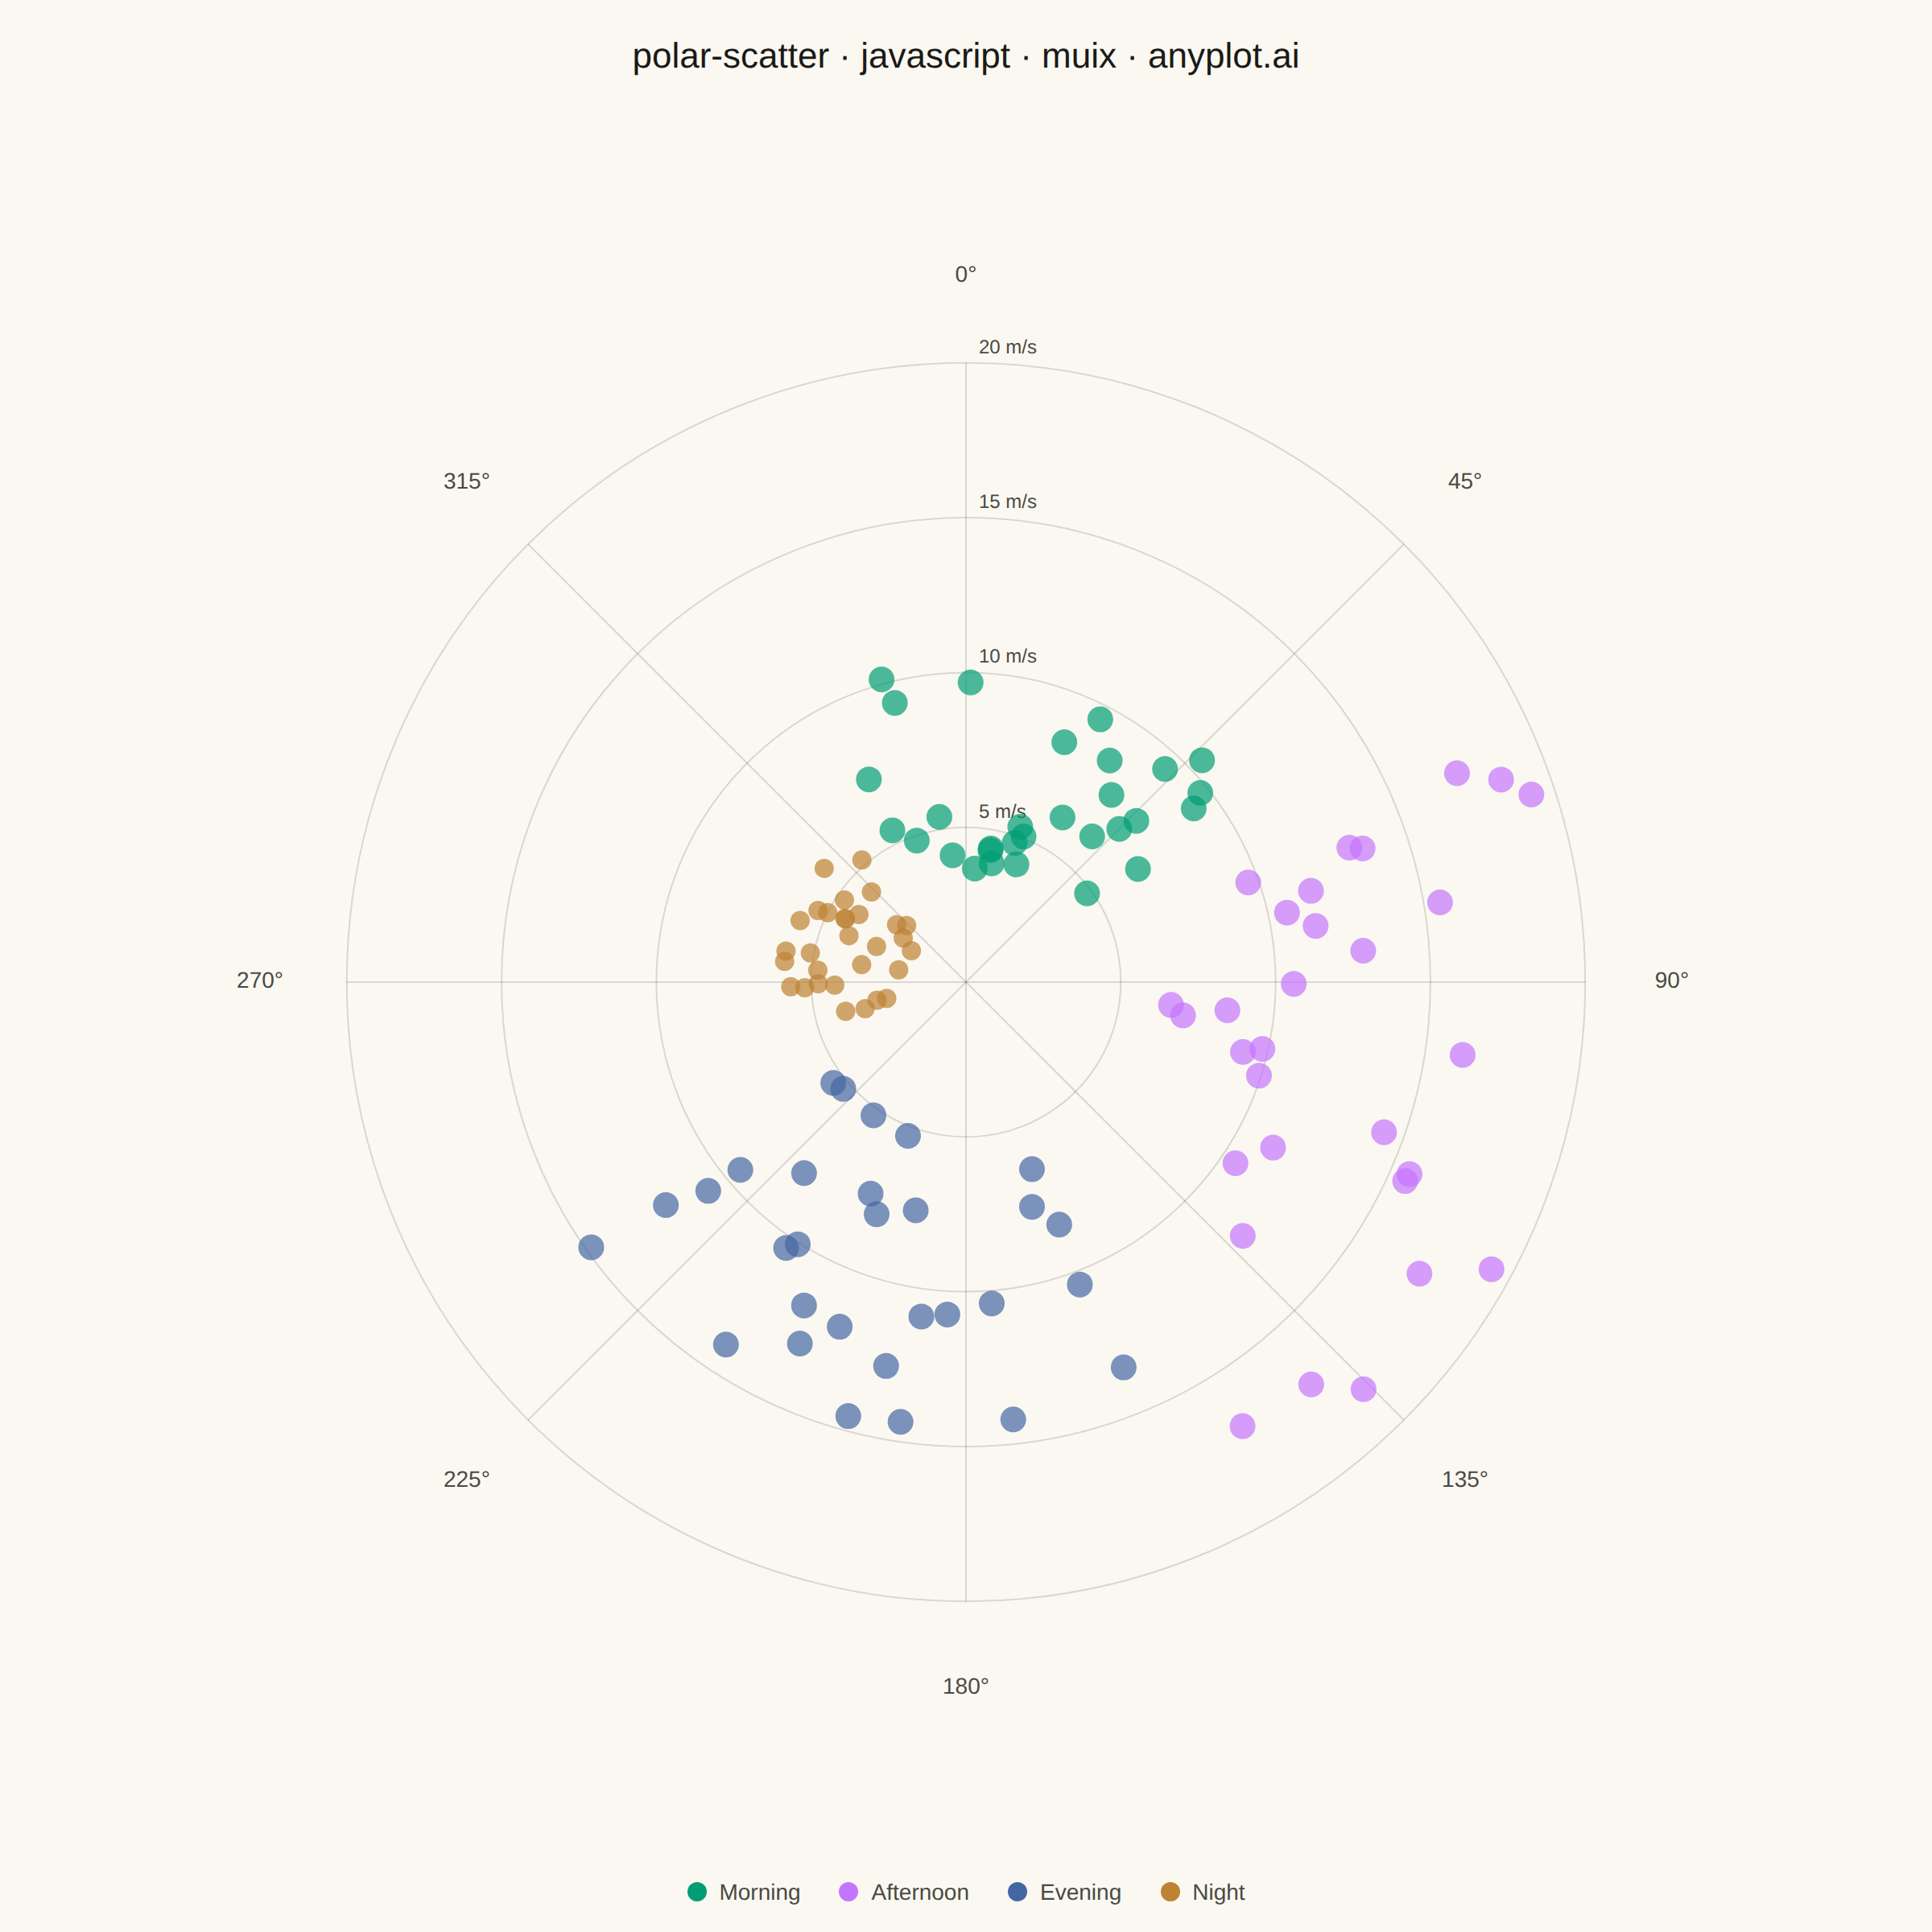
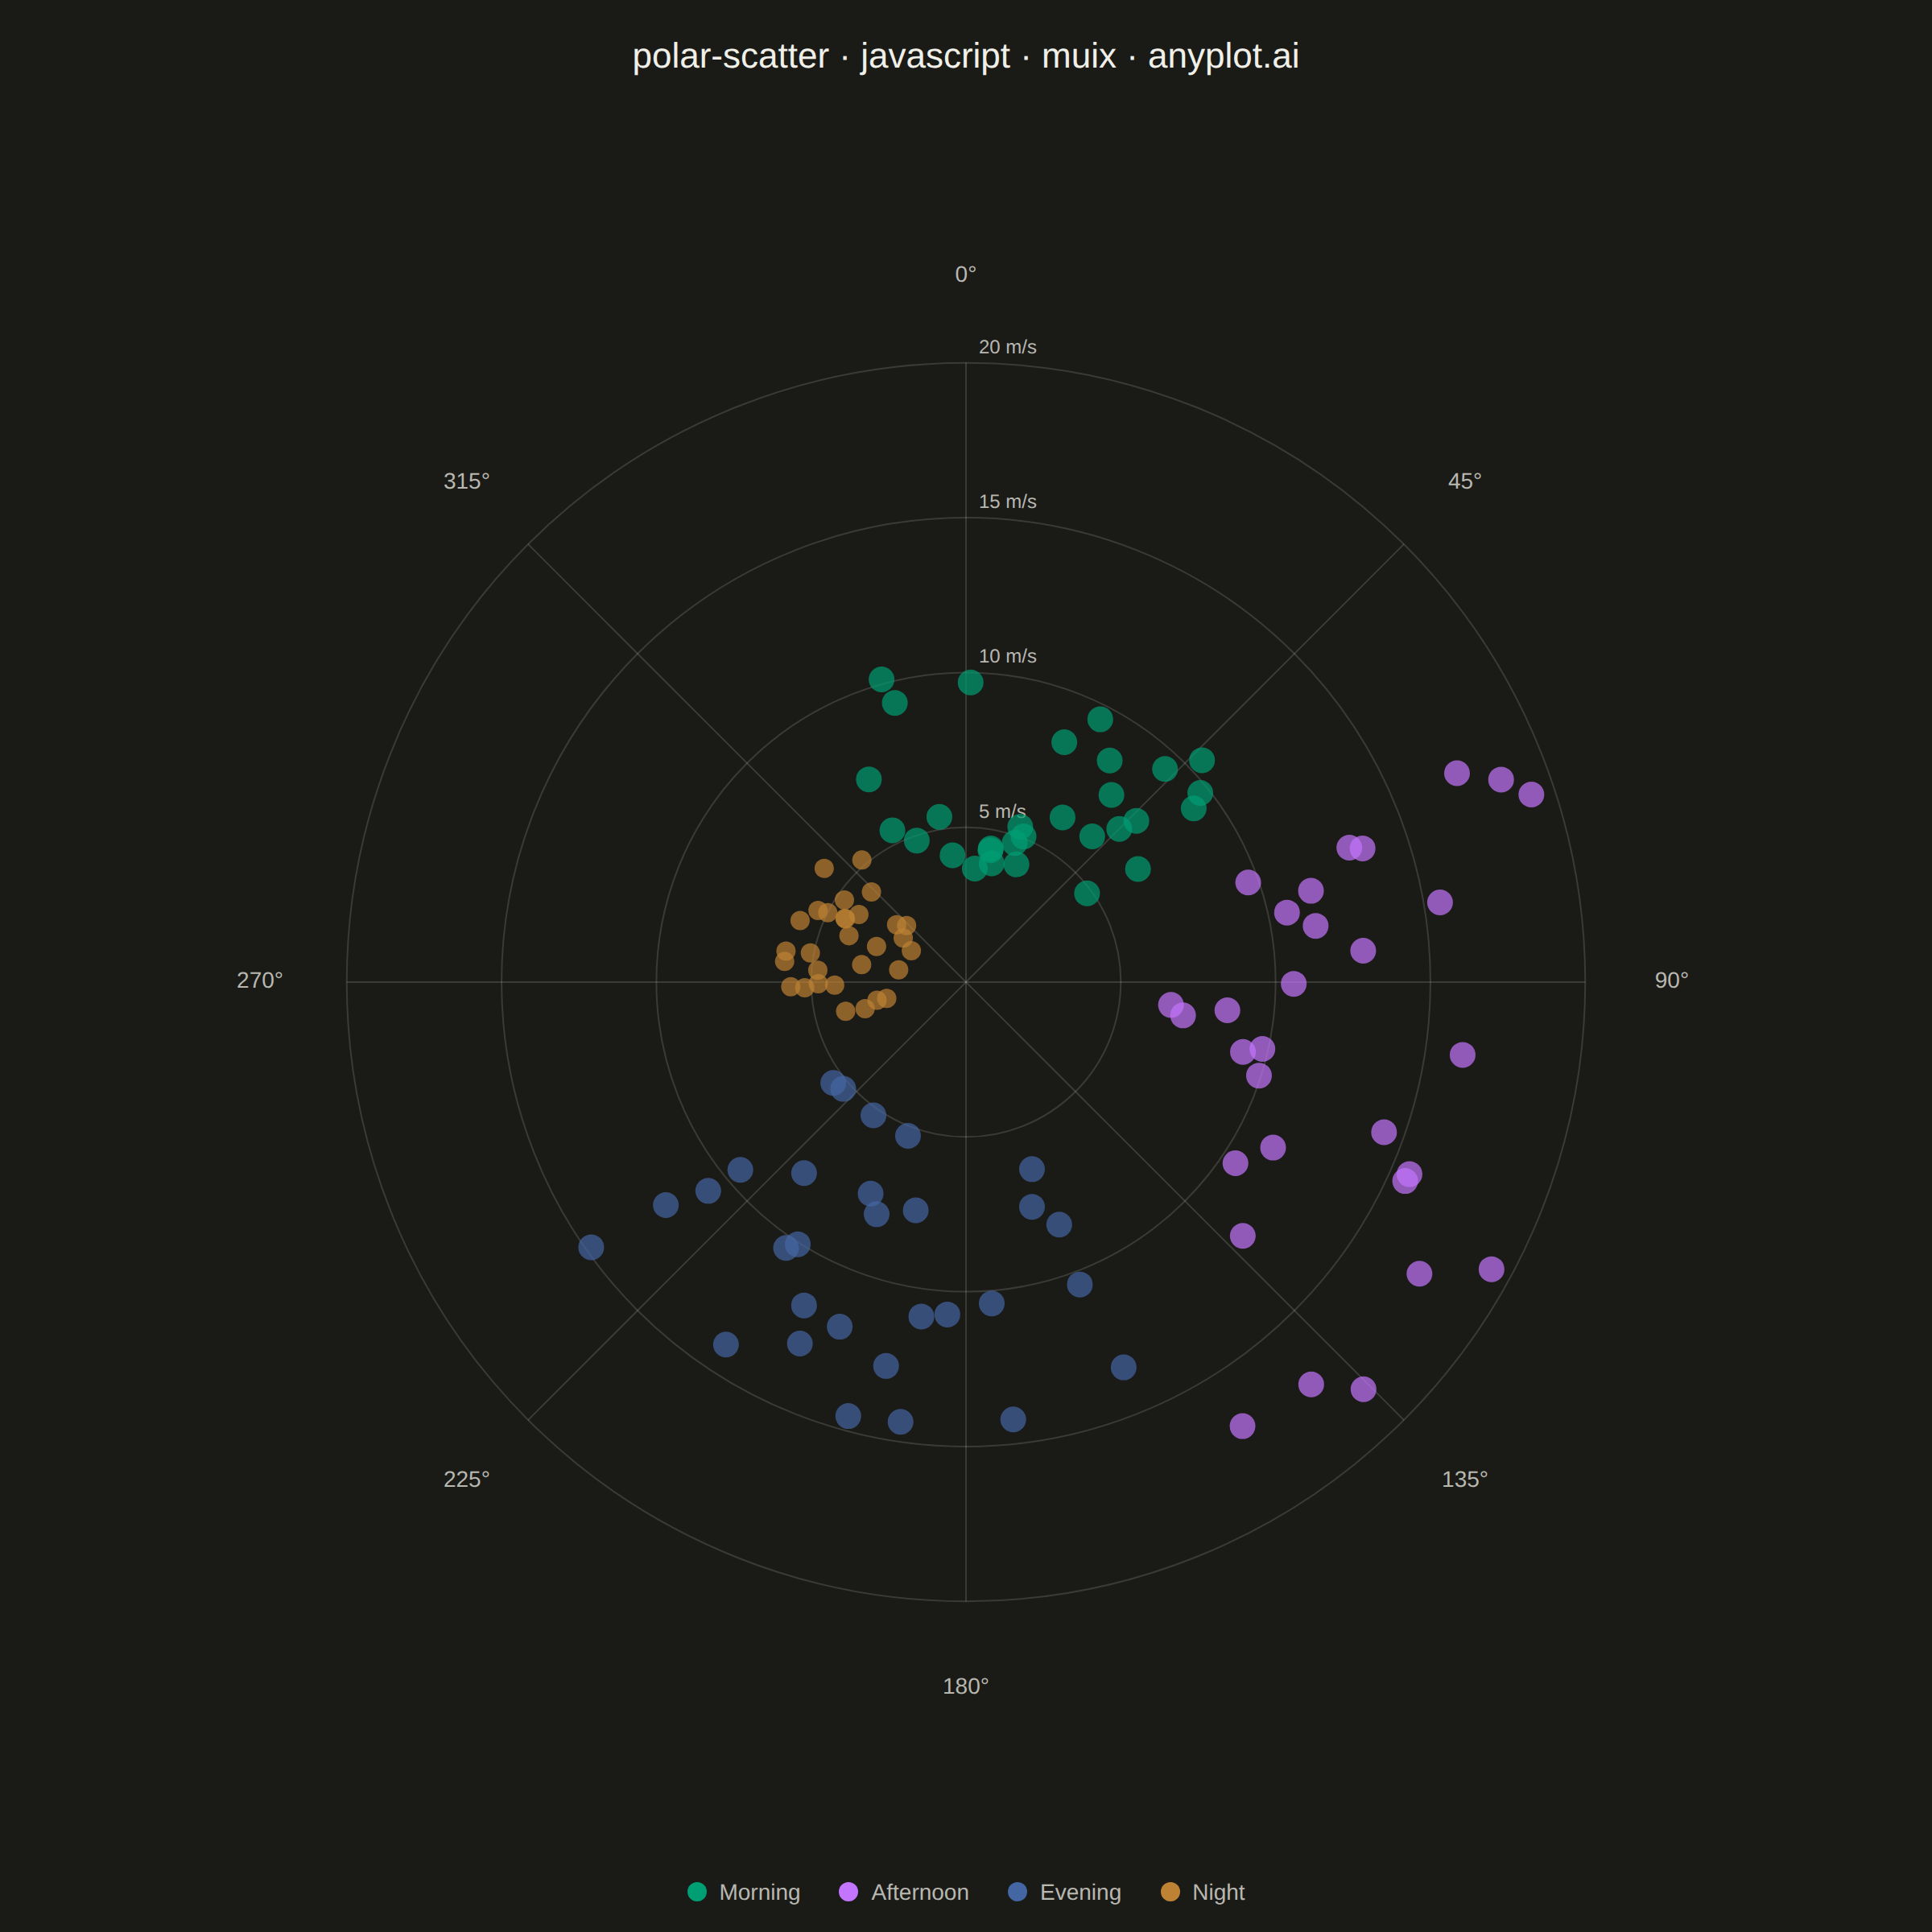
A scatter plot displayed in polar coordinates where data points are positioned using angle (theta) and radius (r) rather than Cartesian x and y coordinates. This visualization is particularly effective for cyclical or directional data where the angular component carries meaningful information.
// anyplot.ai
// polar-scatter: Polar Scatter Plot
// Library: muix 7.29.1 | JavaScript 22.23.2
// Quality: 85/100 | Created: 2026-09-05
//# anyplot-orientation: square
// anyplot.ai
// polar-scatter: Polar Scatter Plot
// Library: MUI X Charts | React | Node 22
// License: @mui/x-charts — MIT (community). Pro/Premium are out of scope.
// Quality: pending | Created: 2026-09-05
import { ChartContainer } from "@mui/x-charts/ChartContainer";
import { ScatterPlot } from "@mui/x-charts/ScatterChart";
import { ChartsTooltip } from "@mui/x-charts/ChartsTooltip";
import { useXScale, useYScale } from "@mui/x-charts/hooks";

const t = window.ANYPLOT_TOKENS;

// --- Data (in-memory, deterministic LCG — the browser has no seeded RNG) ----
let seed = 42;
function rand() {
  seed = (seed * 1664525 + 1013904223) % 4294967296;
  return seed / 4294967296;
}

// Wind observations grouped by time of day. Coastal sites see a diurnal wind
// rotation (land breeze overnight/morning, sea breeze in the afternoon, with
// evening/night transitional flow), so each group's prevailing bearing is
// spaced ~90° apart around the full compass rather than clustered on one side.
const GROUPS = [
  { category: "Morning", bearing: 15, speed: 7, spread: 85, markerSize: 8 },
  { category: "Afternoon", bearing: 105, speed: 13, spread: 90, markerSize: 8 },
  { category: "Evening", bearing: 195, speed: 10, spread: 80, markerSize: 8 },
  { category: "Night", bearing: 285, speed: 4, spread: 75, markerSize: 6 },
];
const POINTS_PER_GROUP = 30;
const MAX_RADIUS = 20; // m/s
const FILL_OPACITY = 0.7; // keeps overlapping points distinguishable

function polarToXY(bearingDeg, radius) {
  const rad = (bearingDeg * Math.PI) / 180;
  return { x: radius * Math.sin(rad), y: radius * Math.cos(rad) };
}

// `ScatterSeriesType` has no `fillOpacity` prop — the renderer paints markers
// with `fill: series.color` directly, so translucency is baked into the color.
function withAlpha(hex, alpha) {
  const h = hex.replace("#", "");
  const r = parseInt(h.substring(0, 2), 16);
  const g = parseInt(h.substring(2, 4), 16);
  const b = parseInt(h.substring(4, 6), 16);
  return `rgba(${r}, ${g}, ${b}, ${alpha})`;
}

const series = GROUPS.map((group, i) => ({
  type: "scatter",
  id: group.category,
  label: group.category,
  color: withAlpha(t.palette[i], FILL_OPACITY),
  markerSize: group.markerSize,
  data: Array.from({ length: POINTS_PER_GROUP }, (_, idx) => {
    const bearing = (((group.bearing + (rand() - 0.5) * group.spread) % 360) + 360) % 360;
    const radius = Math.min(MAX_RADIUS, Math.max(0.5, group.speed + (rand() - 0.5) * group.speed));
    const { x, y } = polarToXY(bearing, radius);
    return { id: `${group.category}-${idx}`, x, y };
  }),
}));

// --- Polar grid overlay — community `@mui/x-charts` has no native polar
// chart, so the radial/angular grid is drawn as an SVG layer that shares the
// same linear x/y scales as the scatter points (via useXScale/useYScale),
// keeping rings, spokes and the data perfectly aligned at any canvas size. --
const RINGS = [5, 10, 15, 20];
const SPOKE_DEGREES = [0, 45, 90, 135, 180, 225, 270, 315];
const LABEL_RADIUS = MAX_RADIUS * 1.14;

function PolarGrid() {
  const xScale = useXScale();
  const yScale = useYScale();
  const cx = xScale(0);
  const cy = yScale(0);

  return (
    <g>
      {RINGS.map((r) => (
        <circle
          key={`ring-${r}`}
          cx={cx}
          cy={cy}
          r={Math.abs(xScale(r) - xScale(0))}
          fill="none"
          stroke={t.grid}
          strokeWidth={1}
        />
      ))}
      {SPOKE_DEGREES.map((deg) => {
        const { x, y } = polarToXY(deg, MAX_RADIUS);
        return (
          <line
            key={`spoke-${deg}`}
            x1={cx}
            y1={cy}
            x2={xScale(x)}
            y2={yScale(y)}
            stroke={t.grid}
            strokeWidth={1}
          />
        );
      })}
      {SPOKE_DEGREES.map((deg) => {
        const { x, y } = polarToXY(deg, LABEL_RADIUS);
        return (
          <text
            key={`spoke-label-${deg}`}
            x={xScale(x)}
            y={yScale(y)}
            fill={t.inkSoft}
            fontSize={14}
            textAnchor="middle"
            dominantBaseline="middle"
          >
            {`${deg}°`}
          </text>
        );
      })}
      {RINGS.map((r) => (
        <text
          key={`ring-label-${r}`}
          x={xScale(0) + 8}
          y={yScale(r) - 6}
          fill={t.inkSoft}
          fontSize={12}
          textAnchor="start"
        >
          {`${r} m/s`}
        </text>
      ))}
    </g>
  );
}

const TITLE = "polar-scatter · javascript · muix · anyplot.ai";
const TITLE_HEIGHT = 70;
const LEGEND_HEIGHT = 50;
const MARGIN = { top: 40, bottom: 40, left: 40, right: 40 };
const DOMAIN = MAX_RADIUS * 1.3;

// --- Chart (default-exported component — the harness mounts it) -------------
export default function Chart() {
  const { width, height } = window.ANYPLOT_SIZE;
  const chartSize = height - TITLE_HEIGHT - LEGEND_HEIGHT;

  return (
    <div style={{ width, height, display: "flex", flexDirection: "column", alignItems: "center" }}>
      <div
        style={{
          height: TITLE_HEIGHT,
          display: "flex",
          alignItems: "center",
          justifyContent: "center",
          fontSize: 22,
          fontWeight: 500,
          color: t.ink,
        }}
      >
        {TITLE}
      </div>
      <ChartContainer
        width={chartSize}
        height={chartSize}
        margin={MARGIN}
        skipAnimation
        xAxis={[{ scaleType: "linear", min: -DOMAIN, max: DOMAIN }]}
        yAxis={[{ scaleType: "linear", min: -DOMAIN, max: DOMAIN }]}
        series={series}
      >
        <PolarGrid />
        <ScatterPlot />
        <ChartsTooltip trigger="item" />
      </ChartContainer>
      <div
        style={{
          height: LEGEND_HEIGHT,
          display: "flex",
          alignItems: "center",
          justifyContent: "center",
          gap: 24,
        }}
      >
        {GROUPS.map((group, i) => (
          <div key={group.category} style={{ display: "flex", alignItems: "center", gap: 8 }}>
            <span
              style={{
                width: 12,
                height: 12,
                borderRadius: "50%",
                backgroundColor: t.palette[i],
                display: "inline-block",
              }}
            />
            <span style={{ fontSize: 14, color: t.inkSoft }}>{group.category}</span>
          </div>
        ))}
      </div>
    </div>
  );
}
Runnable source as JSON, for any HTTP client: https://api.anyplot.ai/specs/polar-scatter/muix/code. Any spec id and library id listed in llms-full.txt fit the same URL shape; every URL below is complete and callable.
{
  "spec_id": "polar-scatter",
  "language": "javascript",
  "library": "muix",
  "page": "https://anyplot.ai/polar-scatter/javascript/muix",
  "hub": "https://anyplot.ai/polar-scatter",
  "code_json": "https://api.anyplot.ai/specs/polar-scatter/muix/code",
  "spec_json": "https://api.anyplot.ai/specs/polar-scatter",
  "render_light_png": "https://storage.googleapis.com/anyplot-images/plots/polar-scatter/javascript/muix/plot-light.png",
  "render_dark_png": "https://storage.googleapis.com/anyplot-images/plots/polar-scatter/javascript/muix/plot-dark.png",
  "interactive_light_html": "https://storage.googleapis.com/anyplot-images/plots/polar-scatter/javascript/muix/plot-light.html",
  "interactive_dark_html": "https://storage.googleapis.com/anyplot-images/plots/polar-scatter/javascript/muix/plot-dark.html",
  "quality_score": 85.0,
  "license": "MIT",
  "guide": "https://anyplot.ai/llms.txt"
}
Part of Polar Scatter Plot on anyplot.ai.