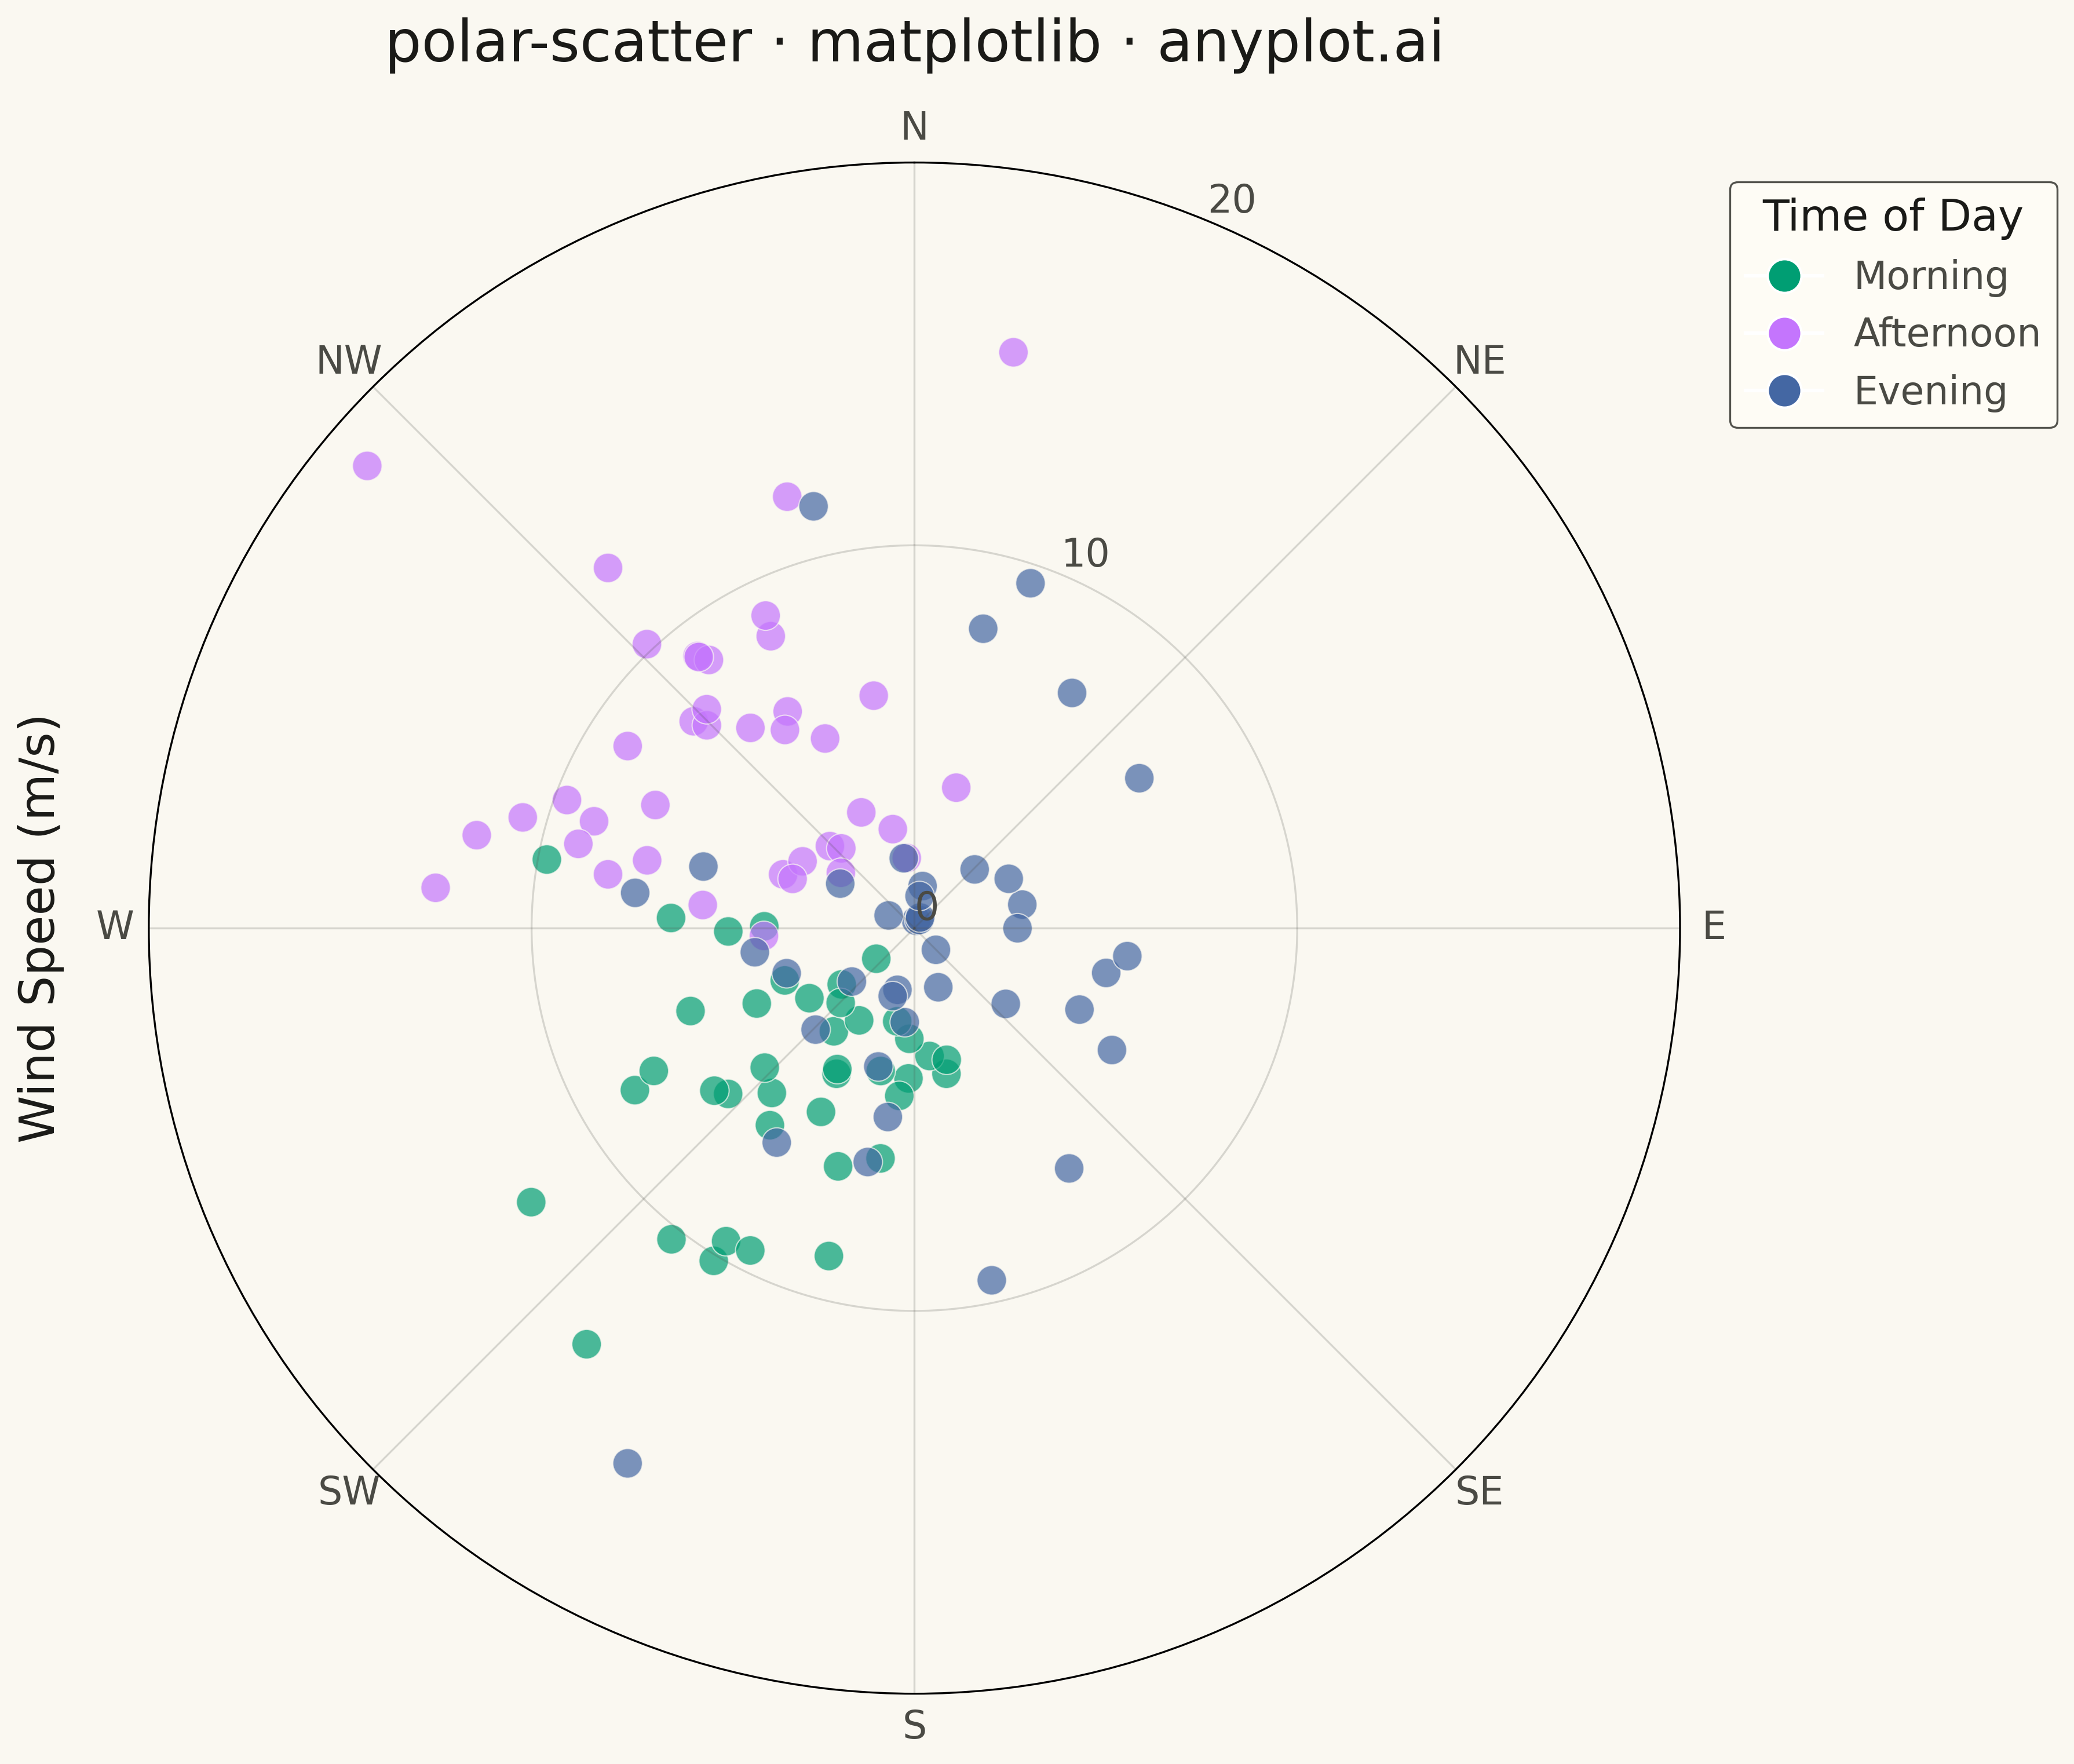
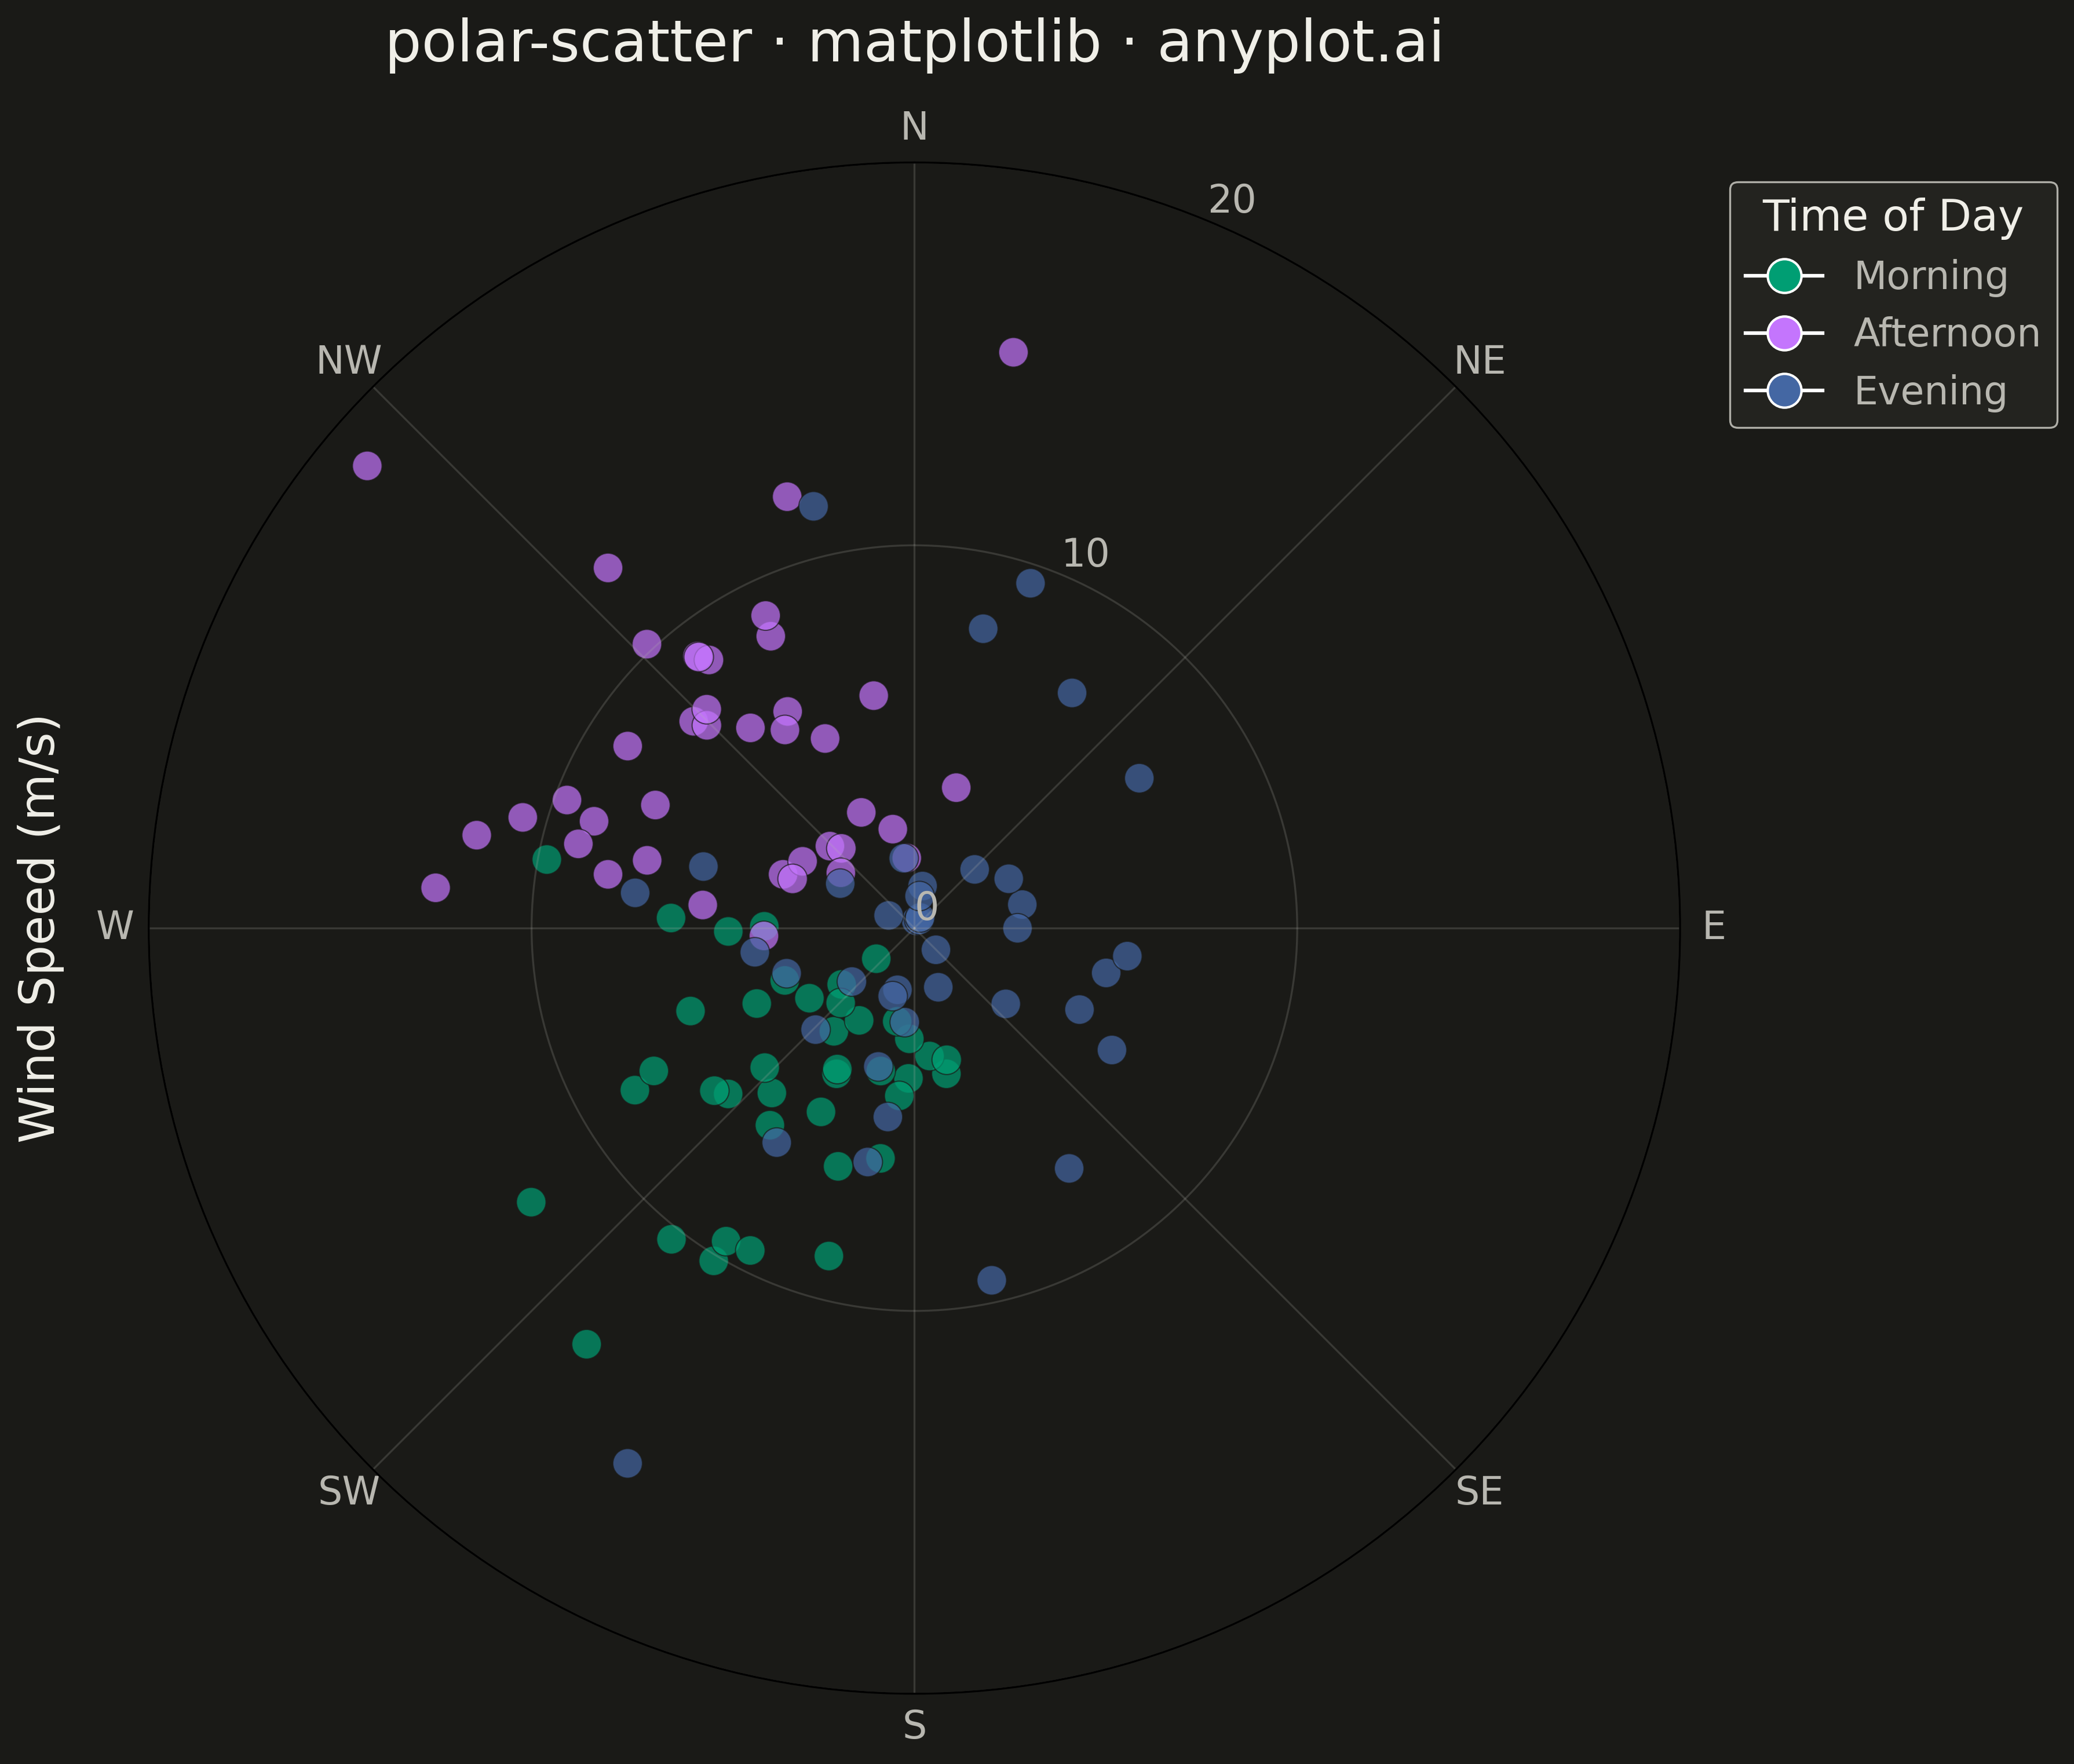
A scatter plot displayed in polar coordinates where data points are positioned using angle (theta) and radius (r) rather than Cartesian x and y coordinates. This visualization is particularly effective for cyclical or directional data where the angular component carries meaningful information.
""" anyplot.ai
polar-scatter: Polar Scatter Plot
Library: matplotlib 3.10.9 | Python 3.13.13
Quality: 95/100 | Updated: 2026-05-09
"""

import os

import matplotlib.pyplot as plt
import numpy as np
from matplotlib.lines import Line2D


# Theme tokens
THEME = os.getenv("ANYPLOT_THEME", "light")
PAGE_BG = "#FAF8F1" if THEME == "light" else "#1A1A17"
ELEVATED_BG = "#FFFDF6" if THEME == "light" else "#242420"
INK = "#1A1A17" if THEME == "light" else "#F0EFE8"
INK_SOFT = "#4A4A44" if THEME == "light" else "#B8B7B0"

# Okabe-Ito palette
COLORS = ["#009E73", "#C475FD", "#4467A3"]

# Data - Wind measurement data with prevailing directions
np.random.seed(42)

n_points = 120

# Create clusters around prevailing wind directions (SW and NW winds common)
# Cluster 1: Southwest winds (around 225 degrees) - morning observations
morning_angles = np.random.normal(225, 30, 40)
morning_speeds = np.random.gamma(2, 3, 40)

# Cluster 2: Northwest winds (around 315 degrees) - afternoon observations
afternoon_angles = np.random.normal(315, 25, 40)
afternoon_speeds = np.random.gamma(2.5, 3, 40)

# Cluster 3: Variable winds - evening observations
evening_angles = np.random.uniform(0, 360, 40)
evening_speeds = np.random.gamma(1.5, 3, 40)

# Combine all observations
angles_deg = np.concatenate([morning_angles, afternoon_angles, evening_angles])
speeds = np.concatenate([morning_speeds, afternoon_speeds, evening_speeds])
categories = np.array(["Morning"] * 40 + ["Afternoon"] * 40 + ["Evening"] * 40)

# Normalize angles to 0-360 range
angles_deg = angles_deg % 360

# Convert to radians for polar plot
angles_rad = np.deg2rad(angles_deg)

# Plot
fig, ax = plt.subplots(figsize=(12, 12), subplot_kw={"projection": "polar"}, facecolor=PAGE_BG)
ax.set_facecolor(PAGE_BG)

# Color mapping for categories using Okabe-Ito palette
color_map = {"Morning": COLORS[0], "Afternoon": COLORS[1], "Evening": COLORS[2]}
color_list = [color_map[cat] for cat in categories]

# Plot scatter with size based on data density considerations (120 points)
ax.scatter(angles_rad, speeds, c=color_list, s=150, alpha=0.7, edgecolors=PAGE_BG, linewidths=0.5)

# Configure angular axis (theta)
ax.set_theta_zero_location("N")
ax.set_theta_direction(-1)
ax.set_thetagrids(
    [0, 45, 90, 135, 180, 225, 270, 315],
    labels=["N", "NE", "E", "SE", "S", "SW", "W", "NW"],
    fontsize=18,
    color=INK_SOFT,
)

# Configure radial axis
max_speed = np.ceil(speeds.max() / 10) * 10
ax.set_rlim(0, max_speed)
ax.set_rticks(np.arange(0, max_speed + 1, 10))
ax.tick_params(axis="both", labelsize=16, colors=INK_SOFT)

# Radial gridlines
ax.grid(True, alpha=0.2, linewidth=0.8, color=INK_SOFT)

# Radial label
ax.set_ylabel("Wind Speed (m/s)", fontsize=20, color=INK, labelpad=35)

# Title
ax.set_title("polar-scatter · matplotlib · anyplot.ai", fontsize=24, color=INK, pad=20)

# Create custom legend
legend_elements = [
    Line2D([0], [0], marker="o", color="w", markerfacecolor=COLORS[0], markersize=14, label="Morning"),
    Line2D([0], [0], marker="o", color="w", markerfacecolor=COLORS[1], markersize=14, label="Afternoon"),
    Line2D([0], [0], marker="o", color="w", markerfacecolor=COLORS[2], markersize=14, label="Evening"),
]
leg = ax.legend(
    handles=legend_elements,
    loc="upper left",
    bbox_to_anchor=(1.02, 1.0),
    fontsize=16,
    title="Time of Day",
    title_fontsize=18,
)
if leg:
    leg.get_frame().set_facecolor(ELEVATED_BG)
    leg.get_frame().set_edgecolor(INK_SOFT)
    leg.get_frame().set_linewidth(0.8)
    leg.get_frame().set_alpha(0.95)
    for text in leg.get_texts():
        text.set_color(INK_SOFT)
    leg.get_title().set_color(INK)

plt.tight_layout()
plt.savefig(f"plot-{THEME}.png", dpi=300, bbox_inches="tight", facecolor=PAGE_BG)
Runnable source as JSON, for any HTTP client: https://api.anyplot.ai/specs/polar-scatter/matplotlib/code. Any spec id and library id listed in llms-full.txt fit the same URL shape; every URL below is complete and callable.
{
  "spec_id": "polar-scatter",
  "language": "python",
  "library": "matplotlib",
  "page": "https://anyplot.ai/polar-scatter/python/matplotlib",
  "hub": "https://anyplot.ai/polar-scatter",
  "code_json": "https://api.anyplot.ai/specs/polar-scatter/matplotlib/code",
  "spec_json": "https://api.anyplot.ai/specs/polar-scatter",
  "render_light_png": "https://storage.googleapis.com/anyplot-images/plots/polar-scatter/python/matplotlib/plot-light.png",
  "render_dark_png": "https://storage.googleapis.com/anyplot-images/plots/polar-scatter/python/matplotlib/plot-dark.png",
  "quality_score": 95.0,
  "license": "MIT",
  "guide": "https://anyplot.ai/llms.txt"
}
Part of Polar Scatter Plot on anyplot.ai.