The same plot in 14 other libraries — JavaScript: Chart.js, D3.js, Highcharts, MUI X Charts; Python: Altair, Bokeh, lets-plot, Matplotlib, Plotly, plotnine, Pygal, Seaborn; R: ggplot2; Julia: Makie.jl. Compare all 15 side by side: Polar Scatter Plot in Python, R, Julia and JavaScript.
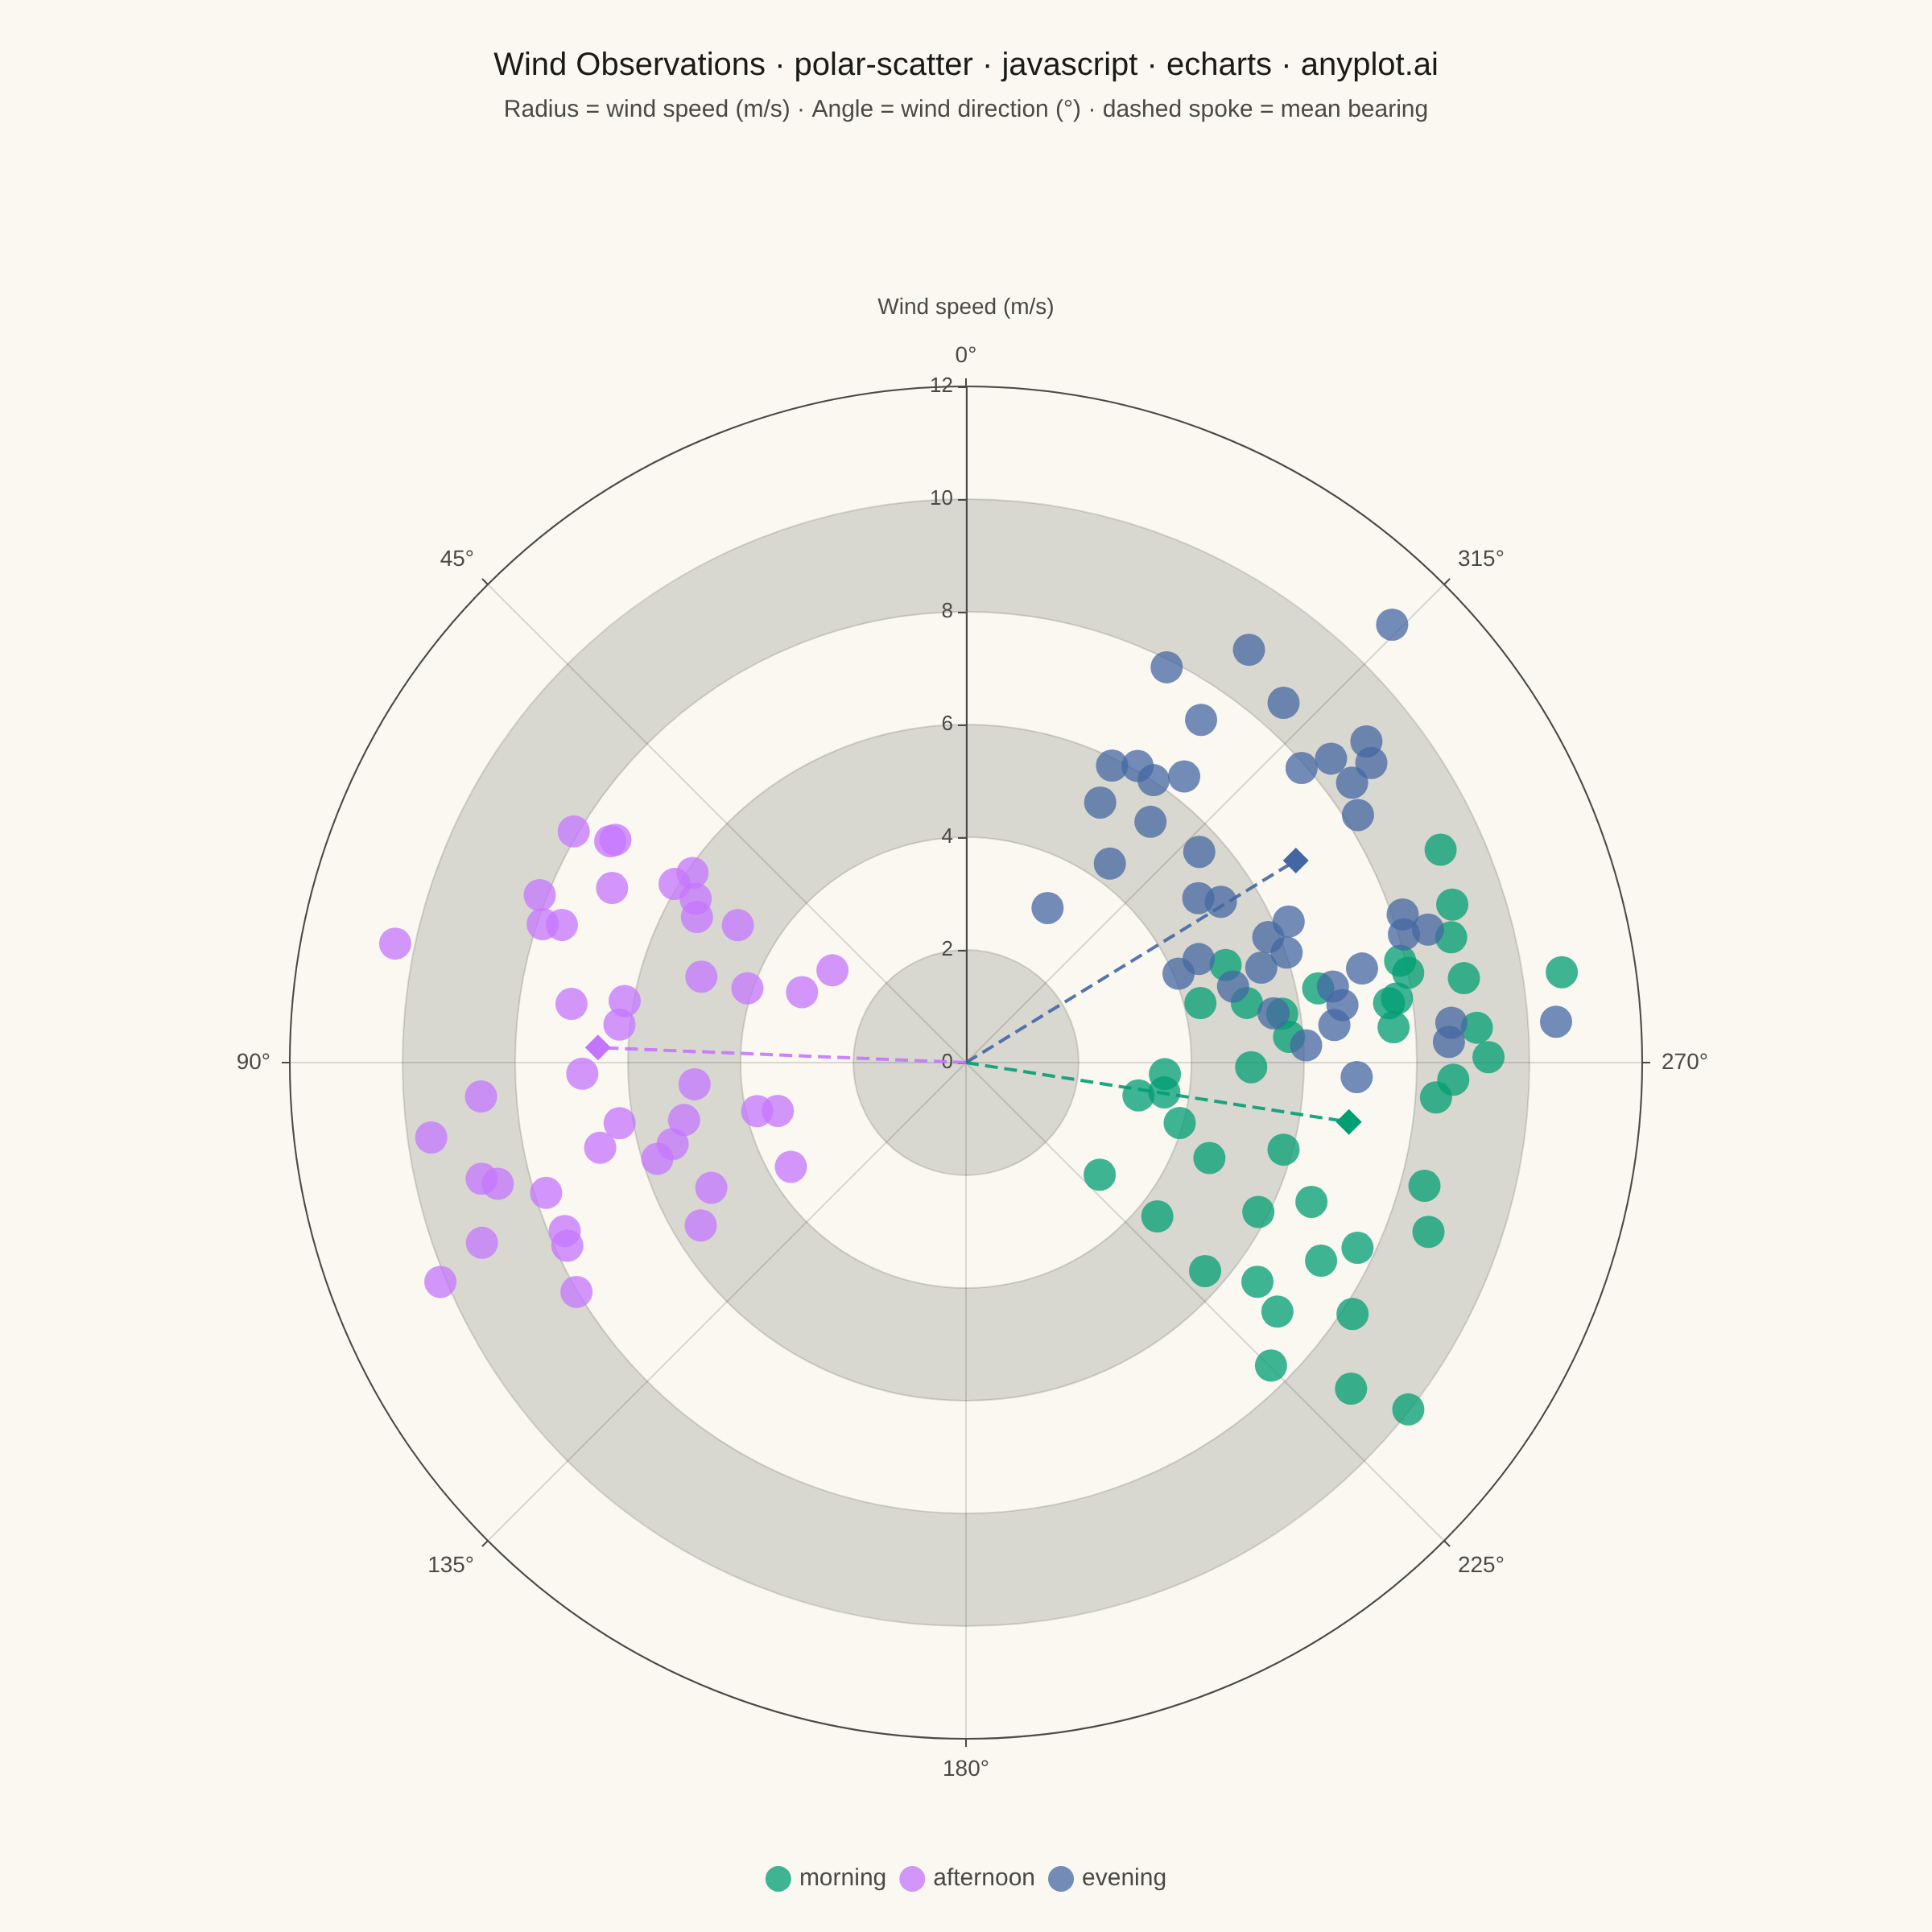
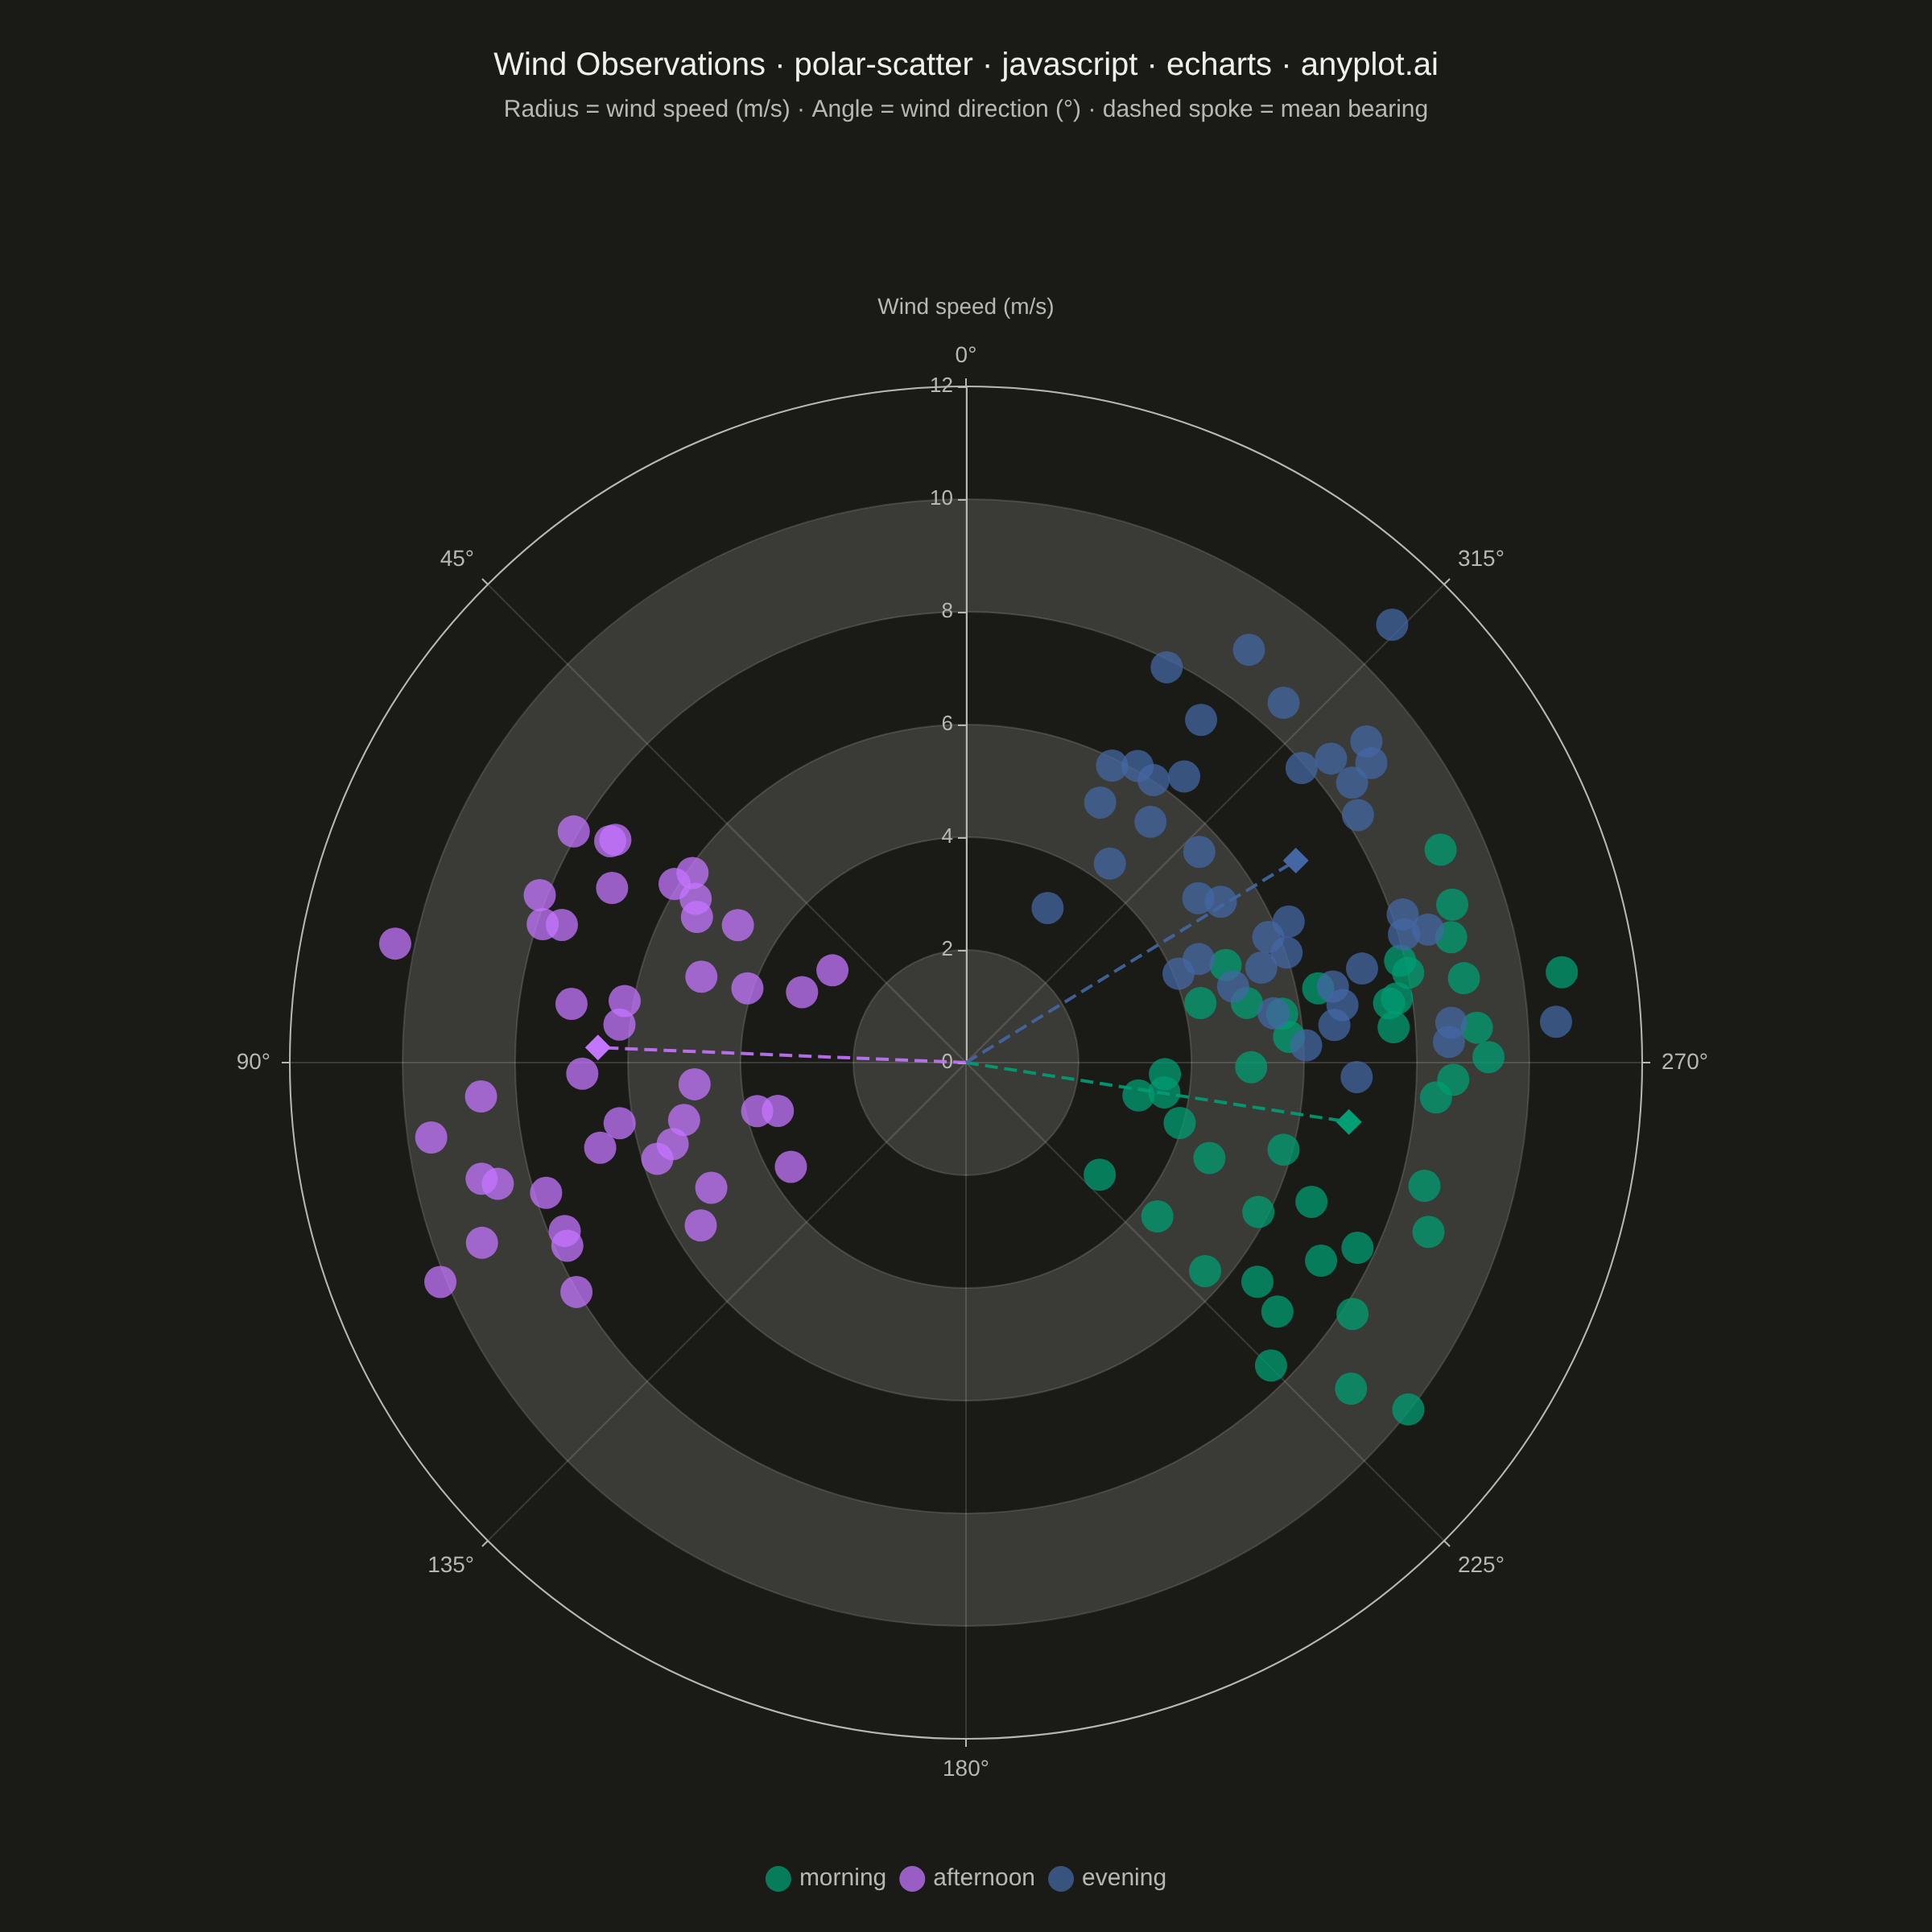
A scatter plot displayed in polar coordinates where data points are positioned using angle (theta) and radius (r) rather than Cartesian x and y coordinates. This visualization is particularly effective for cyclical or directional data where the angular component carries meaningful information.
// anyplot.ai
// polar-scatter: Polar Scatter Plot
// Library: echarts 6.1.0 | JavaScript 22.23.2
// Quality: 85/100 | Created: 2026-09-05

//# anyplot-orientation: square

const t = window.ANYPLOT_TOKENS;

// --- Data (in-memory, deterministic) ----------------------------------------
// Wind observations: direction (degrees), speed (m/s), time of day.
// A tiny LCG stands in for a seeded RNG (Math.random() is not reproducible).
let seed = 42;
function lcg() {
  seed = (seed * 1103515245 + 12345) % 2147483648;
  return seed / 2147483648;
}

const TIME_OF_DAY = ["morning", "afternoon", "evening"];
const PREVAILING_DIRECTION = [260, 90, 300]; // morning / afternoon / evening prevailing bearing, degrees
const SPREAD = 35; // degrees of scatter around the prevailing bearing
const POINTS_PER_PERIOD = 42;

const observations = [];
TIME_OF_DAY.forEach((period, i) => {
  for (let j = 0; j < POINTS_PER_PERIOD; j++) {
    const jitter = (lcg() - 0.5) * 2 * SPREAD;
    const angle = (PREVAILING_DIRECTION[i] + jitter + 360) % 360;
    const speed = 4 + lcg() * 6 + (lcg() - 0.5) * 3; // m/s, roughly 2.5-11.5
    observations.push({
      name: period,
      value: [Math.max(0.5, speed), angle],
    });
  }
});

// Circular mean bearing + mean speed per period, drawn as a dashed radial
// spoke from the center — a distinctive touch beyond a stock polar scatter,
// calling out the prevailing wind direction per time of day at a glance.
const meanByPeriod = TIME_OF_DAY.map((period) => {
  const pts = observations.filter((o) => o.name === period).map((o) => o.value);
  let sumX = 0;
  let sumY = 0;
  let sumR = 0;
  pts.forEach(([r, deg]) => {
    const rad = (deg * Math.PI) / 180;
    sumX += Math.cos(rad);
    sumY += Math.sin(rad);
    sumR += r;
  });
  return {
    period,
    meanAngle: ((Math.atan2(sumY, sumX) * 180) / Math.PI + 360) % 360,
    meanRadius: sumR / pts.length,
  };
});

const scatterSeries = TIME_OF_DAY.map((period, i) => ({
  name: period,
  type: "scatter",
  coordinateSystem: "polar",
  symbolSize: 20,
  itemStyle: { color: t.palette[i], opacity: 0.75 },
  data: observations.filter((o) => o.name === period).map((o) => o.value),
}));

const meanSpokes = meanByPeriod.map(({ period, meanAngle, meanRadius }, i) => ({
  name: `${period}-mean`,
  type: "line",
  coordinateSystem: "polar",
  symbol: (_value, params) => (params.dataIndex === 1 ? "diamond" : "none"),
  symbolSize: (_value, params) => (params.dataIndex === 1 ? 16 : 0),
  lineStyle: { color: t.palette[i], width: 2, type: "dashed", opacity: 0.9 },
  itemStyle: { color: t.palette[i] },
  data: [
    [0, meanAngle],
    [meanRadius, meanAngle],
  ],
  silent: true,
  z: 3,
}));

// --- Init --------------------------------------------------------------------
const chart = echarts.init(document.getElementById("container"));

// --- Option --------------------------------------------------------------------
chart.setOption({
  animation: false,
  color: t.palette,
  backgroundColor: "transparent",
  title: {
    text: "Wind Observations · polar-scatter · javascript · echarts · anyplot.ai",
    subtext:
      "Radius = wind speed (m/s) · Angle = wind direction (°) · dashed spoke = mean bearing",
    left: "center",
    top: 26,
    textStyle: { color: t.ink, fontSize: 20, fontWeight: 500 },
    subtextStyle: { color: t.inkSoft, fontSize: 15 },
  },
  legend: {
    data: TIME_OF_DAY,
    bottom: 20,
    textStyle: { color: t.inkSoft, fontSize: 15 },
    itemWidth: 16,
    itemHeight: 16,
  },
  polar: {
    center: ["50%", "55%"],
    radius: "70%",
  },
  angleAxis: {
    type: "value",
    min: 0,
    max: 360,
    interval: 45,
    startAngle: 90,
    clockwise: false,
    axisLabel: {
      color: t.inkSoft,
      fontSize: 14,
      margin: 12,
      formatter: "{value}°",
    },
    axisLine: { lineStyle: { color: t.inkSoft } },
    splitLine: { lineStyle: { color: t.grid } },
  },
  radiusAxis: {
    type: "value",
    min: 0,
    name: "Wind speed (m/s)",
    nameGap: 42,
    nameTextStyle: { color: t.inkSoft, fontSize: 14 },
    axisLabel: { color: t.inkSoft, fontSize: 13 },
    axisLine: { lineStyle: { color: t.inkSoft } },
    splitLine: { lineStyle: { color: t.grid } },
    splitArea: {
      show: true,
      areaStyle: { color: [t.grid, "transparent"] },
    },
  },
  series: [...scatterSeries, ...meanSpokes],
});
Runnable source as JSON, for any HTTP client: https://api.anyplot.ai/specs/polar-scatter/echarts/code. Any spec id and library id listed in llms-full.txt fit the same URL shape; every URL below is complete and callable.
{
  "spec_id": "polar-scatter",
  "language": "javascript",
  "library": "echarts",
  "page": "https://anyplot.ai/polar-scatter/javascript/echarts",
  "hub": "https://anyplot.ai/polar-scatter",
  "code_json": "https://api.anyplot.ai/specs/polar-scatter/echarts/code",
  "spec_json": "https://api.anyplot.ai/specs/polar-scatter",
  "render_light_png": "https://storage.googleapis.com/anyplot-images/plots/polar-scatter/javascript/echarts/plot-light.png",
  "render_dark_png": "https://storage.googleapis.com/anyplot-images/plots/polar-scatter/javascript/echarts/plot-dark.png",
  "interactive_light_html": "https://storage.googleapis.com/anyplot-images/plots/polar-scatter/javascript/echarts/plot-light.html",
  "interactive_dark_html": "https://storage.googleapis.com/anyplot-images/plots/polar-scatter/javascript/echarts/plot-dark.html",
  "quality_score": 85.0,
  "license": "MIT",
  "guide": "https://anyplot.ai/llms.txt"
}
Part of Polar Scatter Plot on anyplot.ai.