The same plot in 14 other libraries — JavaScript: D3.js, Apache ECharts, Highcharts, MUI X Charts; Python: Altair, Bokeh, lets-plot, Matplotlib, Plotly, plotnine, Pygal, Seaborn; R: ggplot2; Julia: Makie.jl. Compare all 15 side by side: Polar Scatter Plot in Python, R, Julia and JavaScript.
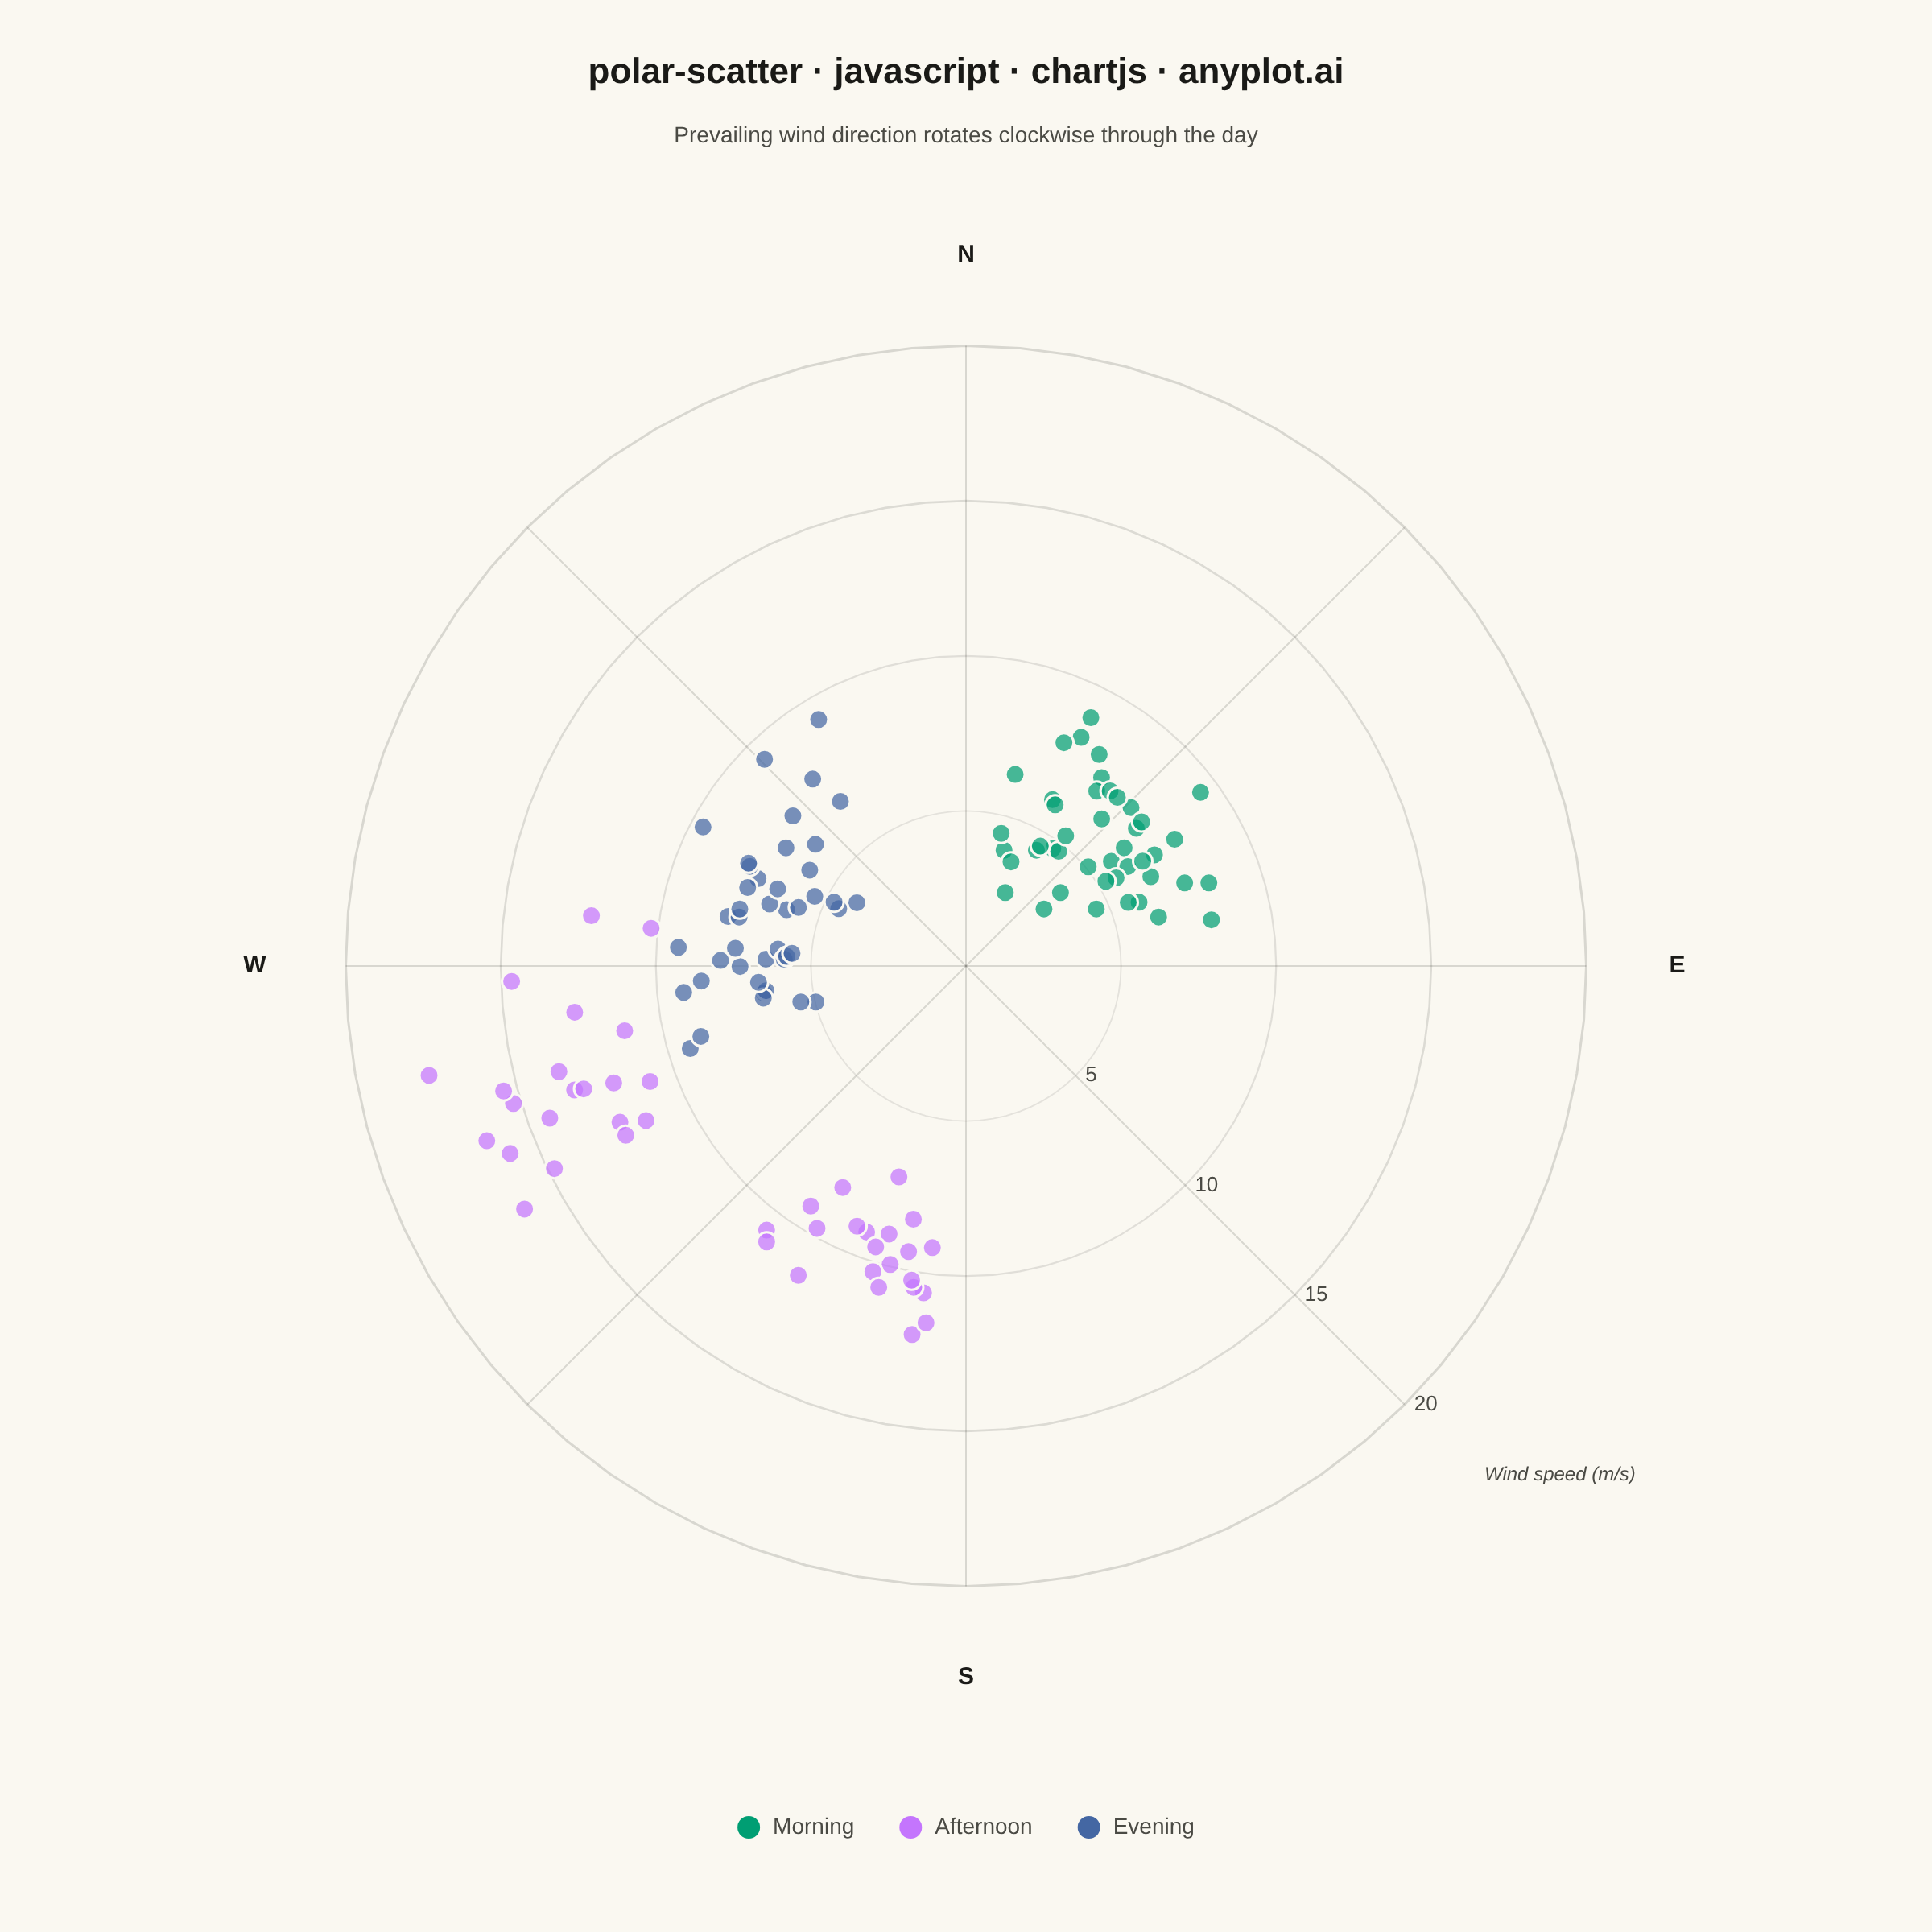
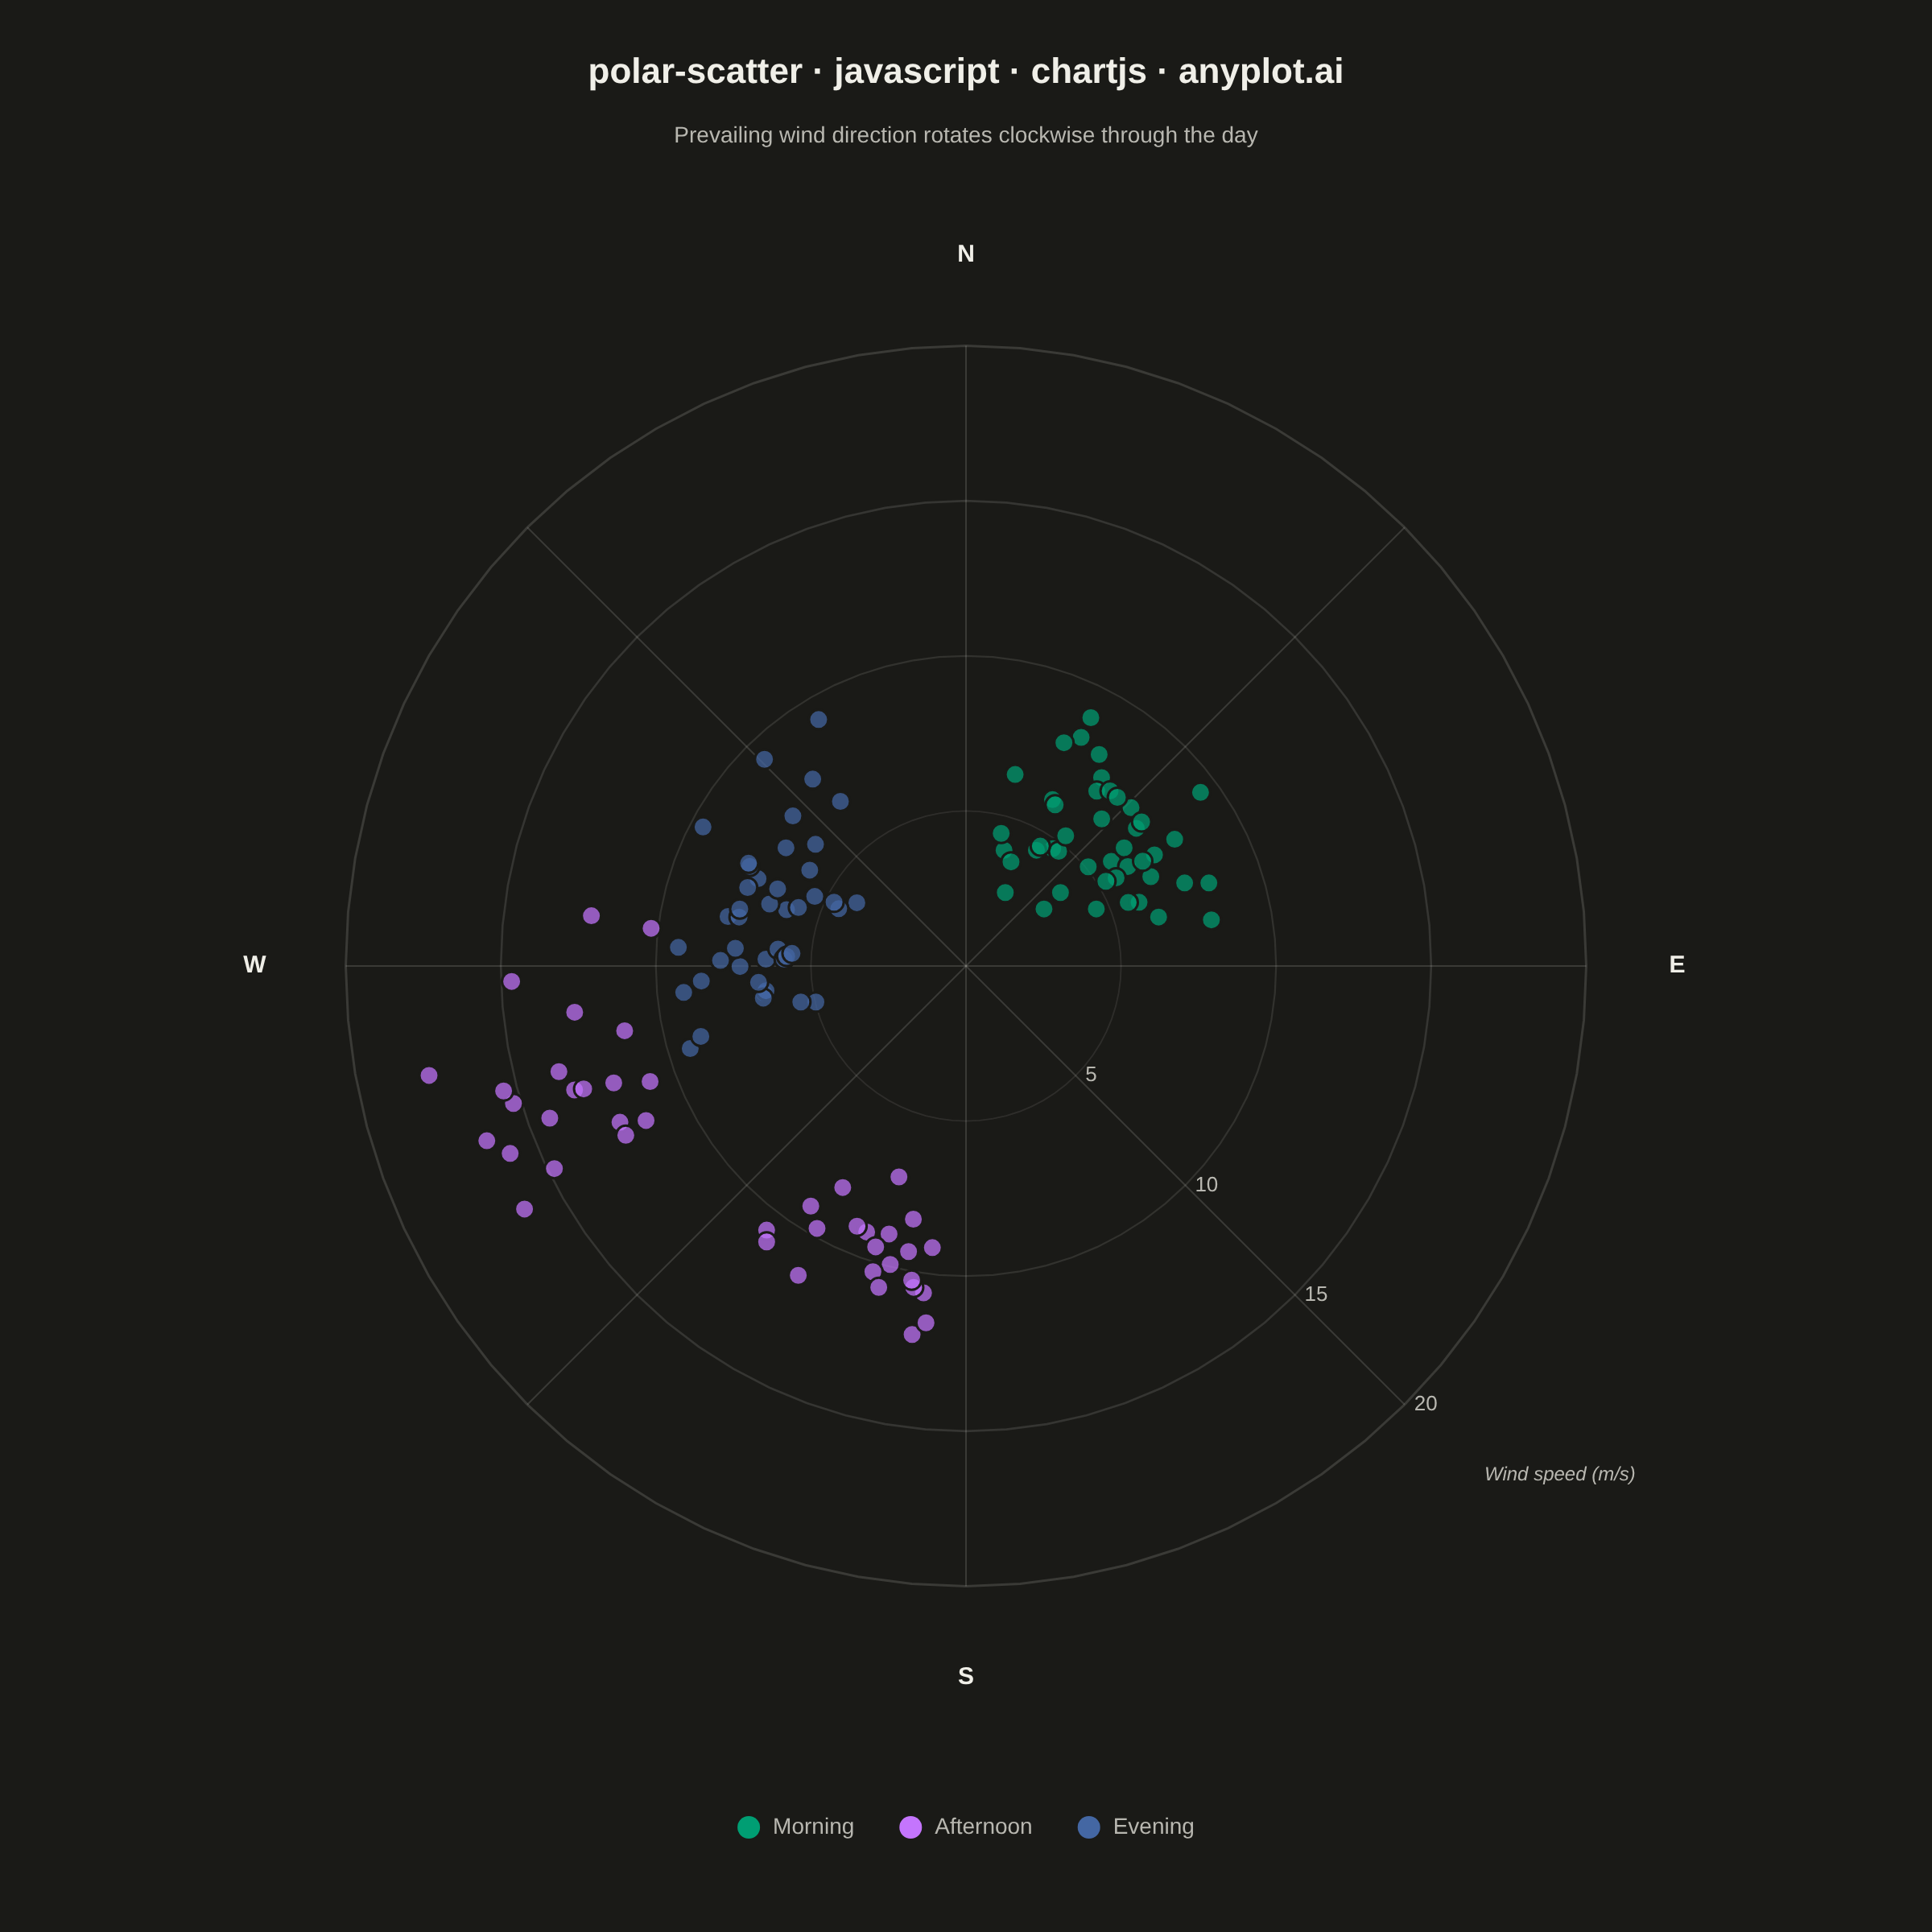
A scatter plot displayed in polar coordinates where data points are positioned using angle (theta) and radius (r) rather than Cartesian x and y coordinates. This visualization is particularly effective for cyclical or directional data where the angular component carries meaningful information.
// anyplot.ai
// polar-scatter: Polar Scatter Plot
// Library: chartjs 4.4.7 | JavaScript 22.23.2
// Quality: 92/100 | Created: 2026-09-05

//# anyplot-orientation: square

const t = window.ANYPLOT_TOKENS;

// --- Data (in-memory, deterministic LCG — wind observations) ---------------
// Wind direction (theta, degrees, compass convention: 0=N, 90=E, clockwise)
// and wind speed (radius, m/s), grouped by time of day. Each period has its
// own prevailing direction and typical speed, like a small wind rose.
function lcg(seed) {
  let s = seed >>> 0;
  return () => {
    s = (1103515245 * s + 12345) >>> 0;
    return s / 4294967296;
  };
}
const rand = lcg(42);

function windObservations(prevailingDeg, spreadDeg, speedMean, speedSpread, n) {
  const points = [];
  for (let i = 0; i < n; i++) {
    // Sum of 3 uniforms approximates a bell-shaped jitter around the prevailing direction.
    const jitter = (rand() + rand() + rand() - 1.5) * spreadDeg;
    const theta = ((prevailingDeg + jitter) % 360 + 360) % 360;
    const radius = Math.max(0.5, speedMean + (rand() + rand() - 1) * speedSpread);
    points.push({ theta, radius });
  }
  return points;
}

// Afternoon carries two modes (a squall shifting the prevailing direction
// mid-period) so the dataset also demonstrates a bimodal angular spread,
// not just three narrow jitter cones.
const periods = [
  {
    label: "Morning",
    modes: [{ prevailing: 45, spread: 30, speedMean: 6, speedSpread: 4, n: 44 }],
  },
  {
    label: "Afternoon",
    modes: [
      { prevailing: 200, spread: 22, speedMean: 10, speedSpread: 4, n: 22 },
      { prevailing: 258, spread: 22, speedMean: 13, speedSpread: 5, n: 21 },
    ],
  },
  {
    label: "Evening",
    modes: [{ prevailing: 285, spread: 45, speedMean: 7, speedSpread: 4, n: 43 }],
  },
];

const datasetsRaw = periods.map((period, i) => ({
  label: period.label,
  color: t.palette[i],
  observations: period.modes.flatMap((m) =>
    windObservations(m.prevailing, m.spread, m.speedMean, m.speedSpread, m.n)
  ),
}));

const maxSpeed = Math.max(...datasetsRaw.flatMap((d) => d.observations.map((o) => o.radius)));
const ringMax = Math.ceil(maxSpeed / 5) * 5;
const axisMax = ringMax * 1.22;
const ringFractions = [0.25, 0.5, 0.75, 1];

// Compass polar -> cartesian: 0 deg (N) is up, angle grows clockwise.
function toXY(thetaDeg, radius) {
  const rad = (thetaDeg * Math.PI) / 180;
  return { x: radius * Math.sin(rad), y: radius * Math.cos(rad) };
}

// --- Mount -------------------------------------------------------------------
const canvas = document.createElement("canvas");
document.getElementById("container").appendChild(canvas);

// --- Chrome layout constants (CSS px, symmetric so the plot area stays square) ---
const PAD = 130;
const title = "polar-scatter · javascript · chartjs · anyplot.ai";
const subtitle = "Prevailing wind direction rotates clockwise through the day";

function hexToRgba(hex, alpha) {
  const r = parseInt(hex.slice(1, 3), 16);
  const g = parseInt(hex.slice(3, 5), 16);
  const b = parseInt(hex.slice(5, 7), 16);
  return `rgba(${r}, ${g}, ${b}, ${alpha})`;
}

// Custom plugin: draws the polar grid behind the points, then cardinal ticks,
// the title, and the category legend on top — Chart.js's own plugin hooks
// (beforeDraw/afterDraw), no external plugin package involved.
const polarChrome = {
  id: "polarChrome",
  beforeDraw(chart) {
    const { ctx, scales } = chart;
    const toPixel = (thetaDeg, radius) => {
      const p = toXY(thetaDeg, radius);
      return { x: scales.x.getPixelForValue(p.x), y: scales.y.getPixelForValue(p.y) };
    };

    ctx.save();

    // Radial rings — line weight/opacity increases with distance so the outer
    // (axis-defining) ring reads slightly stronger than the inner guides.
    ctx.strokeStyle = t.grid;
    ringFractions.forEach((frac) => {
      const r = ringMax * frac;
      ctx.globalAlpha = 0.5 + 0.5 * frac;
      ctx.lineWidth = 0.75 + 0.75 * frac;
      ctx.beginPath();
      for (let deg = 0; deg <= 360; deg += 5) {
        const p = toPixel(deg, r);
        if (deg === 0) ctx.moveTo(p.x, p.y);
        else ctx.lineTo(p.x, p.y);
      }
      ctx.stroke();
    });
    ctx.globalAlpha = 1;
    ctx.lineWidth = 1;

    // Angular spokes every 45 degrees
    for (let deg = 0; deg < 360; deg += 45) {
      const center = toPixel(0, 0);
      const outer = toPixel(deg, ringMax);
      ctx.beginPath();
      ctx.moveTo(center.x, center.y);
      ctx.lineTo(outer.x, outer.y);
      ctx.stroke();
    }

    // Radius tick labels along the SE spoke (clear of every prevailing-wind
    // cluster) — a single axis caption carries the unit so the ticks
    // themselves stay terse.
    ctx.fillStyle = t.inkSoft;
    ctx.font = "13px -apple-system, BlinkMacSystemFont, sans-serif";
    ctx.textAlign = "left";
    ctx.textBaseline = "middle";
    ringFractions.forEach((frac) => {
      const p = toPixel(135, ringMax * frac);
      ctx.fillText(`${Math.round(ringMax * frac)}`, p.x + 6, p.y);
    });
    ctx.font = "italic 12px -apple-system, BlinkMacSystemFont, sans-serif";
    const captionP = toPixel(135, ringMax * 1.16);
    ctx.fillText("Wind speed (m/s)", captionP.x + 6, captionP.y);

    ctx.restore();
  },
  afterDraw(chart) {
    const { ctx, scales, width } = chart;
    const toPixel = (thetaDeg, radius) => {
      const p = toXY(thetaDeg, radius);
      return { x: scales.x.getPixelForValue(p.x), y: scales.y.getPixelForValue(p.y) };
    };

    ctx.save();

    // Cardinal direction labels
    ctx.fillStyle = t.ink;
    ctx.font = "600 15px -apple-system, BlinkMacSystemFont, sans-serif";
    ctx.textAlign = "center";
    ctx.textBaseline = "middle";
    const cardinals = [
      { deg: 0, text: "N" },
      { deg: 90, text: "E" },
      { deg: 180, text: "S" },
      { deg: 270, text: "W" },
    ];
    cardinals.forEach(({ deg, text }) => {
      const p = toPixel(deg, axisMax * 0.94);
      ctx.fillText(text, p.x, p.y);
    });

    // Title (top padding band)
    ctx.fillStyle = t.ink;
    ctx.font = "600 22px -apple-system, BlinkMacSystemFont, sans-serif";
    ctx.textAlign = "center";
    ctx.textBaseline = "middle";
    ctx.fillText(title, width / 2, PAD * 0.35);

    // Subtitle: calls out the insight directly instead of leaving the reader
    // to infer it from the color-coded clusters alone.
    ctx.fillStyle = t.inkSoft;
    ctx.font = "14px -apple-system, BlinkMacSystemFont, sans-serif";
    ctx.fillText(subtitle, width / 2, PAD * 0.65);

    // Legend (bottom padding band): swatch + label per category, centered row
    ctx.font = "14px -apple-system, BlinkMacSystemFont, sans-serif";
    const swatchR = 7;
    const gapAfterSwatch = 8;
    const gapBetweenItems = 28;
    const widths = datasetsRaw.map((d) => ctx.measureText(d.label).width);
    const itemWidths = widths.map((w) => swatchR * 2 + gapAfterSwatch + w);
    const totalWidth = itemWidths.reduce((a, b) => a + b, 0) + gapBetweenItems * (datasetsRaw.length - 1);
    let cursorX = width / 2 - totalWidth / 2;
    const legendY = chart.height - PAD / 2;
    datasetsRaw.forEach((d, i) => {
      ctx.fillStyle = d.color;
      ctx.beginPath();
      ctx.arc(cursorX + swatchR, legendY, swatchR, 0, Math.PI * 2);
      ctx.fill();
      ctx.fillStyle = t.inkSoft;
      ctx.textAlign = "left";
      ctx.fillText(d.label, cursorX + swatchR * 2 + gapAfterSwatch, legendY);
      cursorX += itemWidths[i] + gapBetweenItems;
    });

    ctx.restore();
  },
};

// --- Chart -------------------------------------------------------------------
new Chart(canvas, {
  type: "scatter",
  data: {
    datasets: datasetsRaw.map((d) => ({
      label: d.label,
      data: d.observations.map((o) => toXY(o.theta, o.radius)),
      backgroundColor: hexToRgba(d.color, 0.72),
      borderColor: t.pageBg,
      borderWidth: 1.5,
      pointRadius: 6,
      pointHoverRadius: 6,
    })),
  },
  options: {
    responsive: true,
    maintainAspectRatio: false,
    animation: false,
    layout: { padding: PAD },
    plugins: {
      title: { display: false },
      legend: { display: false },
      tooltip: { enabled: false },
    },
    scales: {
      x: { type: "linear", min: -axisMax, max: axisMax, display: false },
      y: { type: "linear", min: -axisMax, max: axisMax, display: false },
    },
  },
  plugins: [polarChrome],
});
Runnable source as JSON, for any HTTP client: https://api.anyplot.ai/specs/polar-scatter/chartjs/code. Any spec id and library id listed in llms-full.txt fit the same URL shape; every URL below is complete and callable.
{
  "spec_id": "polar-scatter",
  "language": "javascript",
  "library": "chartjs",
  "page": "https://anyplot.ai/polar-scatter/javascript/chartjs",
  "hub": "https://anyplot.ai/polar-scatter",
  "code_json": "https://api.anyplot.ai/specs/polar-scatter/chartjs/code",
  "spec_json": "https://api.anyplot.ai/specs/polar-scatter",
  "render_light_png": "https://storage.googleapis.com/anyplot-images/plots/polar-scatter/javascript/chartjs/plot-light.png",
  "render_dark_png": "https://storage.googleapis.com/anyplot-images/plots/polar-scatter/javascript/chartjs/plot-dark.png",
  "interactive_light_html": "https://storage.googleapis.com/anyplot-images/plots/polar-scatter/javascript/chartjs/plot-light.html",
  "interactive_dark_html": "https://storage.googleapis.com/anyplot-images/plots/polar-scatter/javascript/chartjs/plot-dark.html",
  "quality_score": 92.0,
  "license": "MIT",
  "guide": "https://anyplot.ai/llms.txt"
}
Part of Polar Scatter Plot on anyplot.ai.