The same plot in 14 other libraries — JavaScript: Chart.js, Apache ECharts, Highcharts, MUI X Charts; Python: Altair, Bokeh, lets-plot, Matplotlib, Plotly, plotnine, Pygal, Seaborn; R: ggplot2; Julia: Makie.jl. Compare all 15 side by side: Polar Scatter Plot in Python, R, Julia and JavaScript.
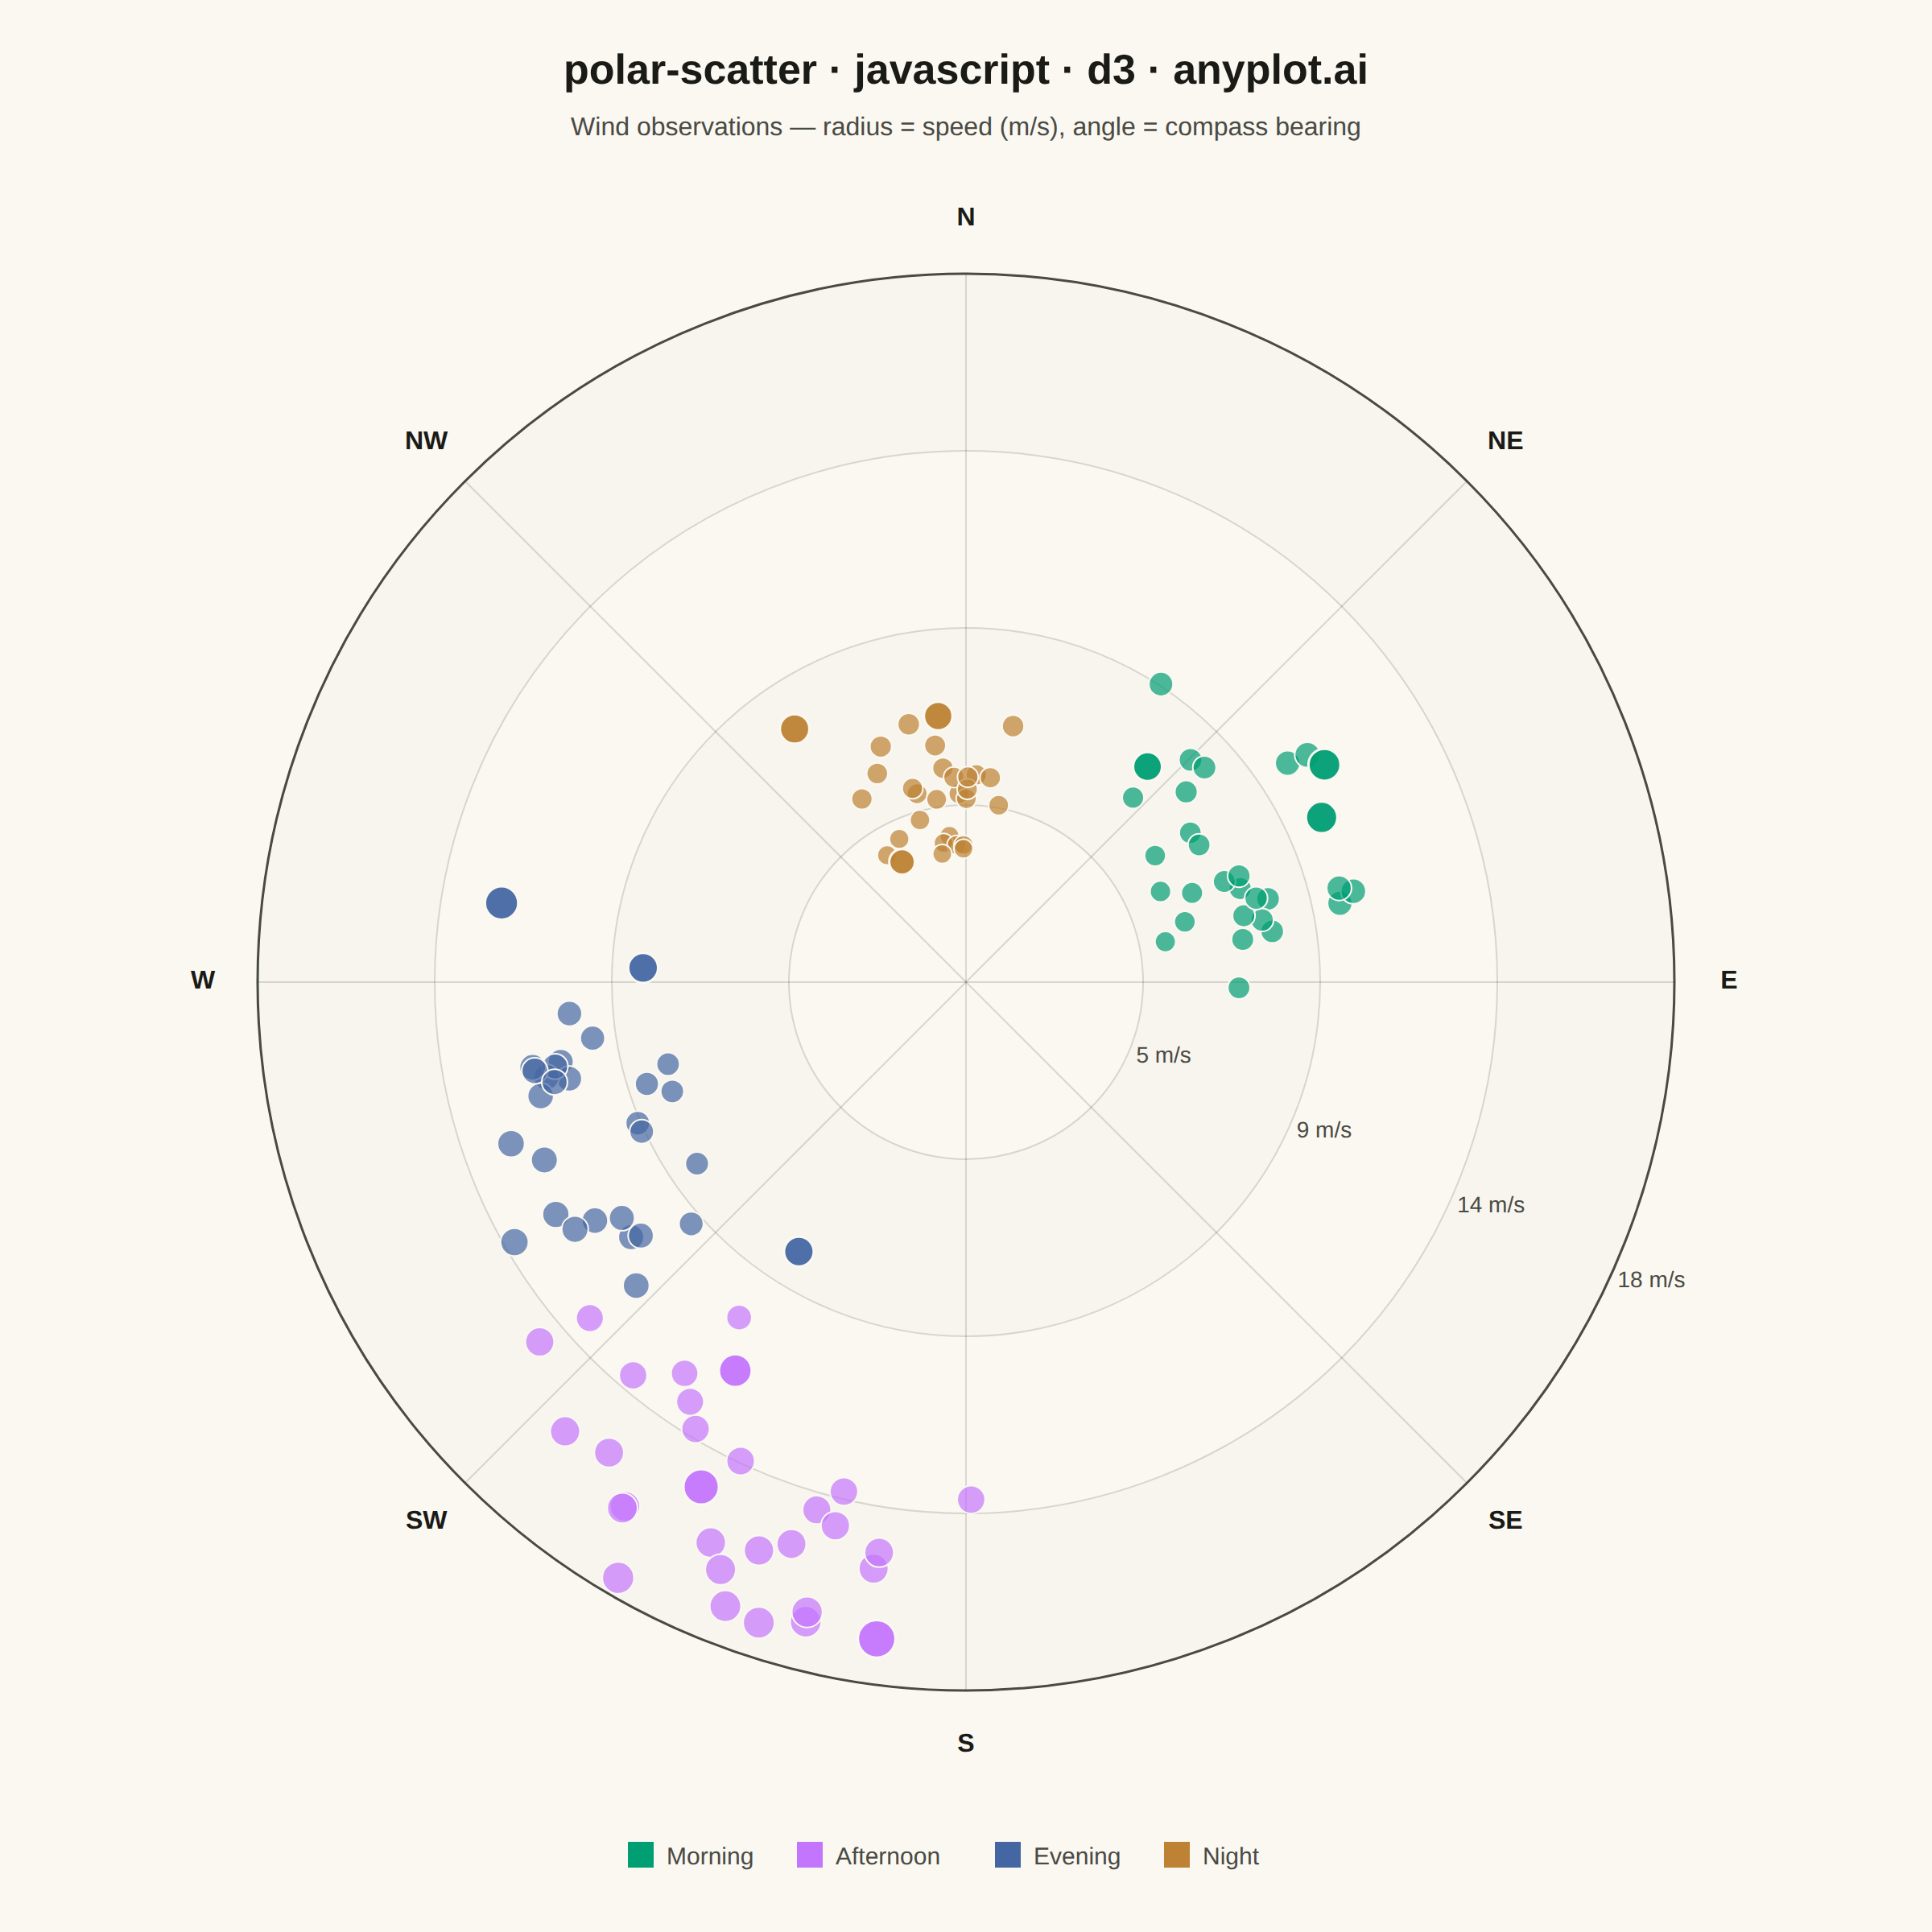
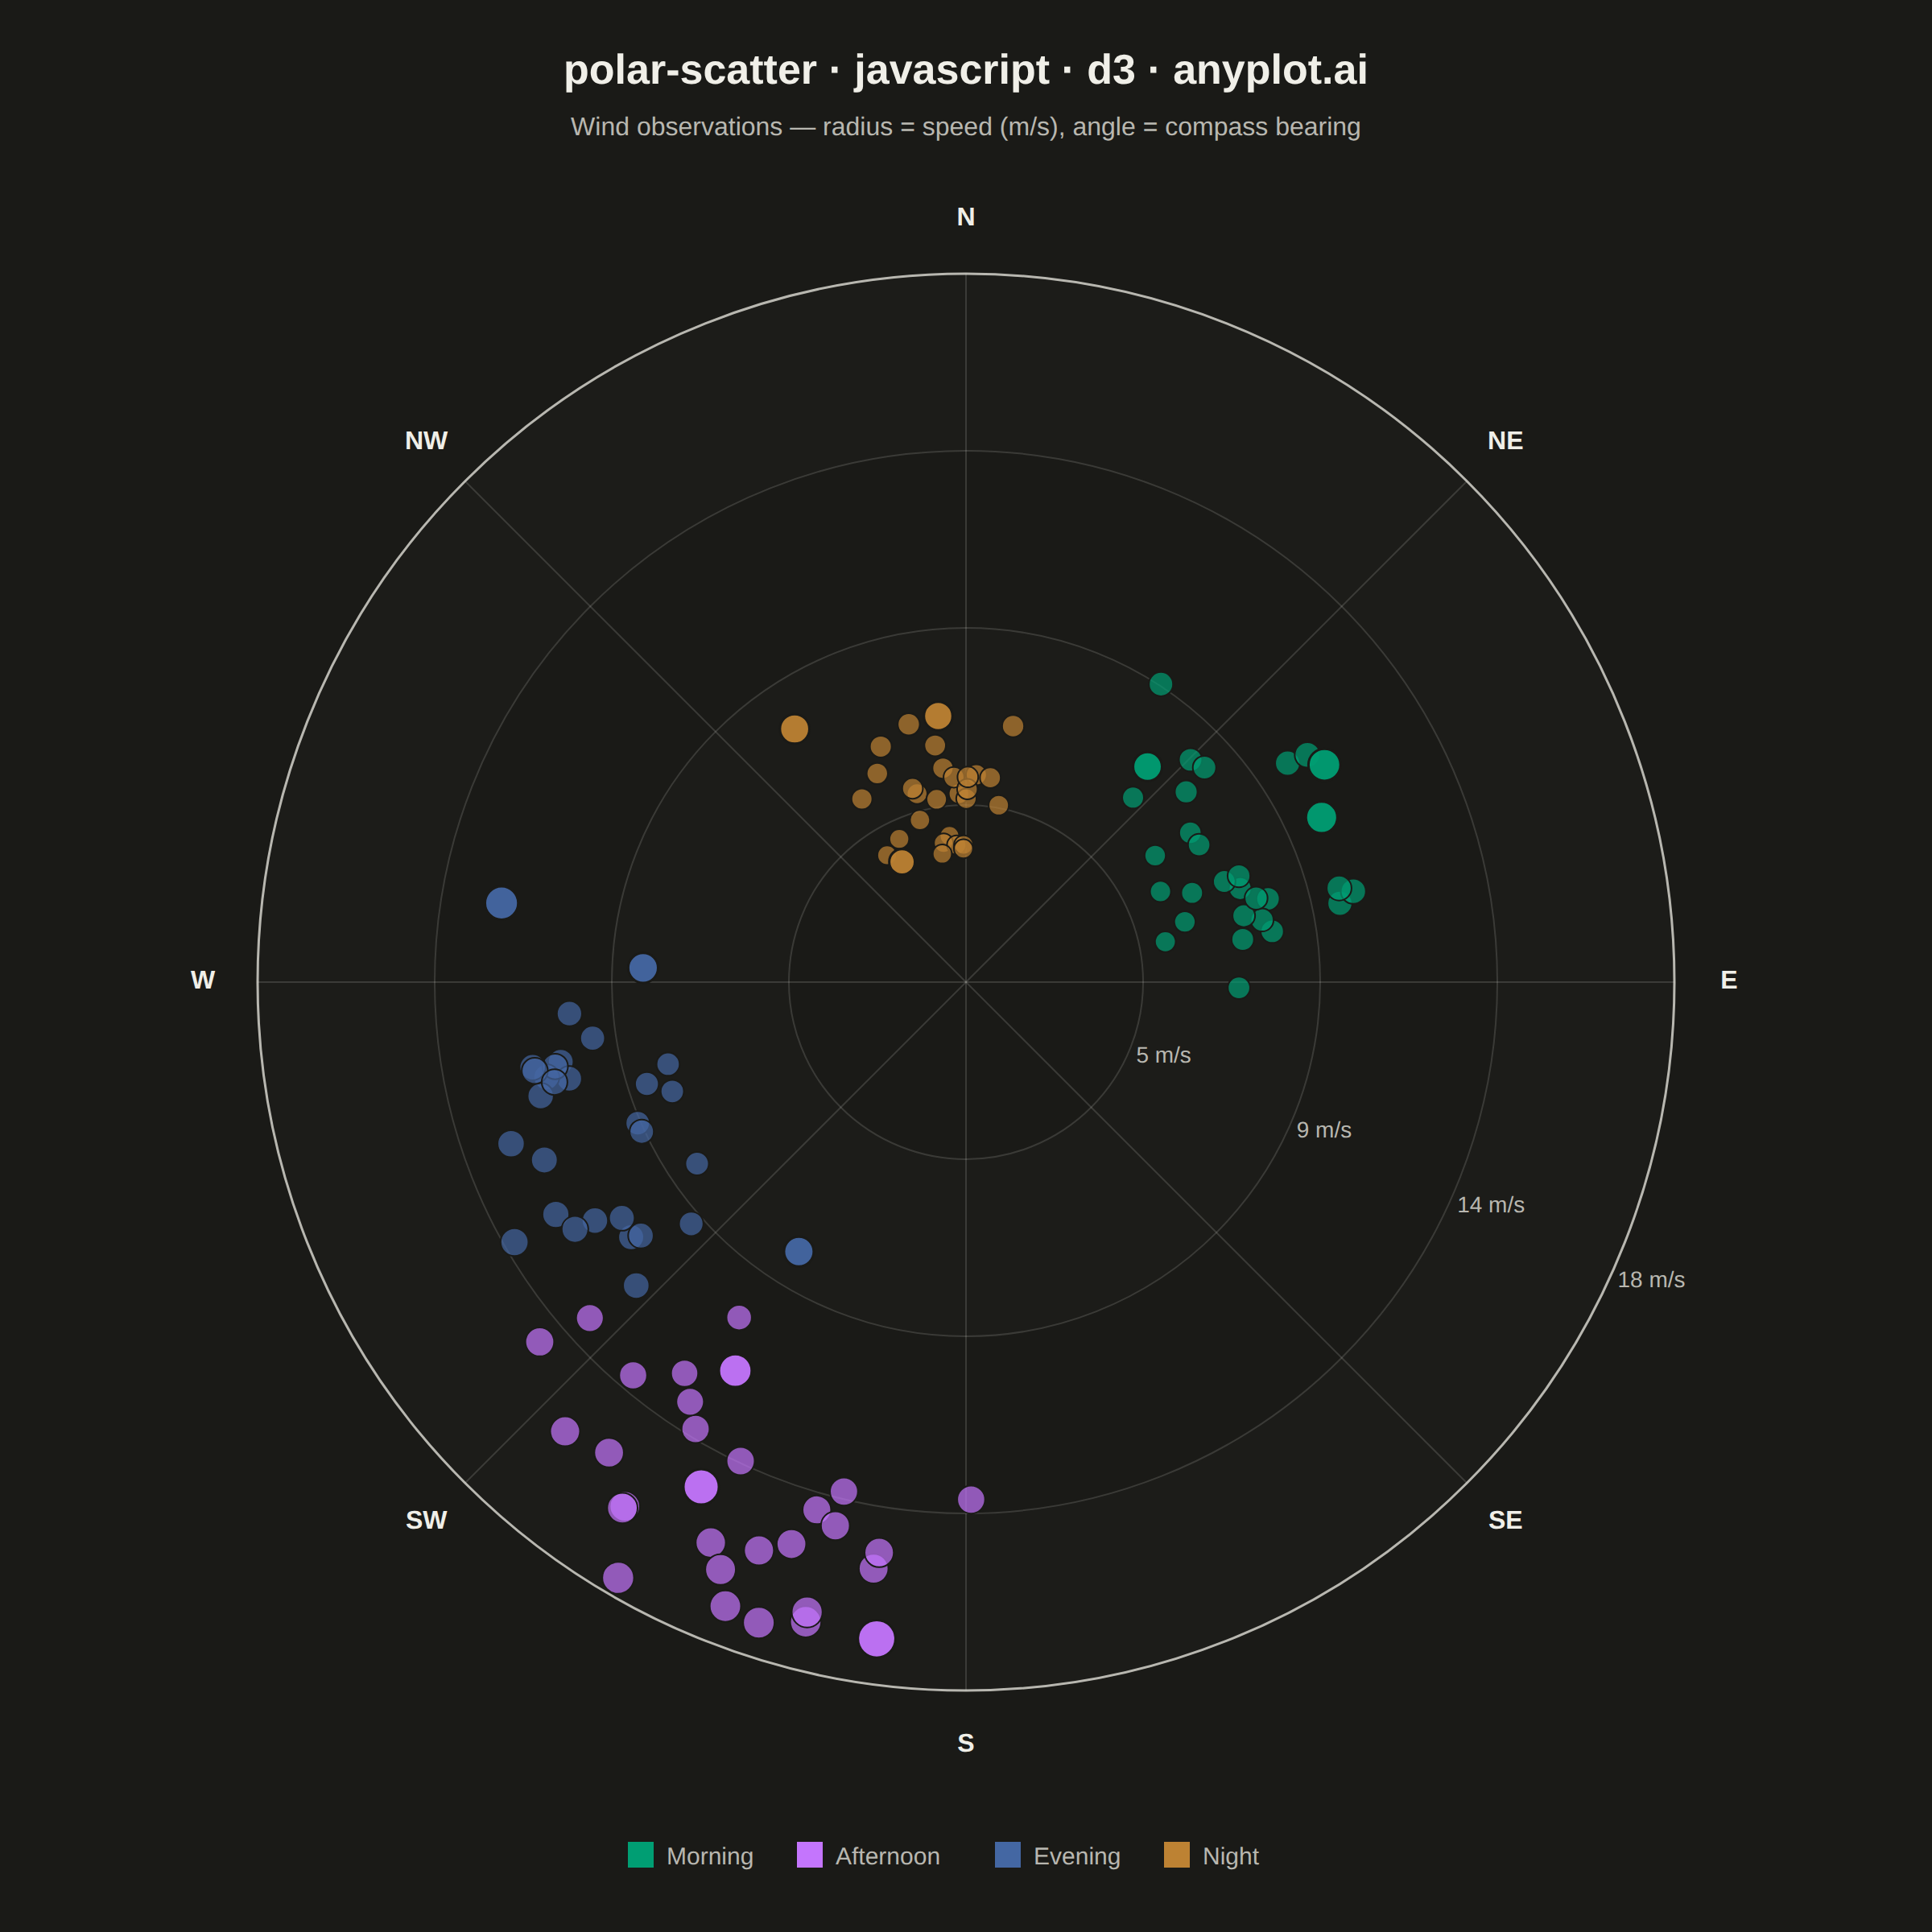
A scatter plot displayed in polar coordinates where data points are positioned using angle (theta) and radius (r) rather than Cartesian x and y coordinates. This visualization is particularly effective for cyclical or directional data where the angular component carries meaningful information.
// anyplot.ai
// polar-scatter: Polar Scatter Plot
// Library: d3 7.9.0 | JavaScript 22.23.2
// Quality: 94/100 | Created: 2026-09-05

//# anyplot-orientation: square

const t = window.ANYPLOT_TOKENS;
const { width, height } = window.ANYPLOT_SIZE;

// --- Data (in-memory, deterministic LCG — wind observations) ---------------
let seed = 42;
function rand() {
  seed = (seed * 1103515245 + 12345) & 0x7fffffff;
  return seed / 0x7fffffff;
}
function noise() {
  // roughly bell-shaped in [-1, 1]
  return (rand() + rand() + rand() - 1.5) / 1.5;
}

const CATEGORY_CONFIG = [
  { category: "morning", angle: 65, angleSpread: 38, speedBase: 8, speedSpread: 4 },
  { category: "afternoon", angle: 205, angleSpread: 34, speedBase: 15, speedSpread: 5 },
  { category: "evening", angle: 245, angleSpread: 30, speedBase: 10, speedSpread: 4 },
  { category: "night", angle: 350, angleSpread: 42, speedBase: 5, speedSpread: 3 },
];
const POINTS_PER_CATEGORY = 30;
const OUTLIER_EVERY = 10; // every 10th observation is a genuine outlier gust
const OUTLIER_SPREAD_MULTIPLIER = 1.7;

const data = [];
for (const cfg of CATEGORY_CONFIG) {
  for (let i = 0; i < POINTS_PER_CATEGORY; i++) {
    const isOutlier = i % OUTLIER_EVERY === OUTLIER_EVERY - 1;
    const spreadMul = isOutlier ? OUTLIER_SPREAD_MULTIPLIER : 1;
    const theta = (cfg.angle + noise() * cfg.angleSpread * spreadMul + 360) % 360;
    const speed = Math.max(0.5, cfg.speedBase + noise() * cfg.speedSpread * spreadMul);
    data.push({ theta, speed, category: cfg.category, isOutlier });
  }
}

const categories = CATEGORY_CONFIG.map((c) => c.category);
const color = d3.scaleOrdinal().domain(categories).range(t.palette);

// --- Layout -------------------------------------------------------------
const margin = { top: 130, bottom: 110, left: 100, right: 100 };
const availableWidth = width - margin.left - margin.right;
const availableHeight = height - margin.top - margin.bottom;
const plotRadius = Math.min(availableWidth, availableHeight) / 2 - 40;
const cx = margin.left + availableWidth / 2;
const cy = margin.top + availableHeight / 2;

const maxSpeed = d3.max(data, (d) => d.speed);
const domainMax = Math.ceil(maxSpeed / 2) * 2;
const radialScale = d3.scaleLinear().domain([0, domainMax]).range([0, plotRadius]);
const radialTicks = d3.range(1, 5).map((i) => (domainMax * i) / 4);
const markerRadius = d3.scaleLinear().domain([0, domainMax]).range([5, 10]).clamp(true);

function toXY(thetaDeg, r) {
  const rad = (thetaDeg * Math.PI) / 180;
  return [cx + r * Math.sin(rad), cy - r * Math.cos(rad)];
}

// --- SVG mount ------------------------------------------------------------
const svg = d3.select("#container").append("svg").attr("width", width).attr("height", height);

// --- Radial bands (subtle depth cue, outermost ring first) -----------------
const bandGroup = svg.append("g");
bandGroup
  .selectAll("circle.radial-band")
  .data([...radialTicks].reverse())
  .join("circle")
  .attr("class", "radial-band")
  .attr("cx", cx)
  .attr("cy", cy)
  .attr("r", (d) => radialScale(d))
  .attr("fill", (d, i) => (i % 2 === 0 ? t.grid : t.pageBg))
  .attr("fill-opacity", (d, i) => (i % 2 === 0 ? 0.08 : 1));

// --- Radial gridlines + tick labels ----------------------------------------
const gridGroup = svg.append("g");
gridGroup
  .selectAll("circle.grid-ring")
  .data(radialTicks)
  .join("circle")
  .attr("class", "grid-ring")
  .attr("cx", cx)
  .attr("cy", cy)
  .attr("r", (d) => radialScale(d))
  .attr("fill", "none")
  .attr("stroke", t.grid)
  .attr("stroke-width", 1);

// Labels sit along a clear sector (between E and SE) so they never collide
// with a data cluster, unlike a fixed N-spoke placement.
const TICK_LABEL_ANGLE = 115;
gridGroup
  .selectAll("text.grid-label")
  .data(radialTicks)
  .join("text")
  .attr("class", "grid-label")
  .attr("x", (d) => toXY(TICK_LABEL_ANGLE, radialScale(d))[0] + 6)
  .attr("y", (d) => toXY(TICK_LABEL_ANGLE, radialScale(d))[1])
  .attr("text-anchor", "start")
  .attr("dominant-baseline", "middle")
  .attr("fill", t.inkSoft)
  .style("font-size", "14px")
  .text((d) => `${d3.format(".0f")(d)} m/s`);

// Outer domain circle
svg
  .append("circle")
  .attr("cx", cx)
  .attr("cy", cy)
  .attr("r", plotRadius)
  .attr("fill", "none")
  .attr("stroke", t.inkSoft)
  .attr("stroke-width", 1.5);

// --- Angular spokes + compass labels -----------------------------------
const COMPASS = [
  { deg: 0, label: "N" },
  { deg: 45, label: "NE" },
  { deg: 90, label: "E" },
  { deg: 135, label: "SE" },
  { deg: 180, label: "S" },
  { deg: 225, label: "SW" },
  { deg: 270, label: "W" },
  { deg: 315, label: "NW" },
];

const spokeGroup = svg.append("g");
spokeGroup
  .selectAll("line.spoke")
  .data(COMPASS)
  .join("line")
  .attr("class", "spoke")
  .attr("x1", cx)
  .attr("y1", cy)
  .attr("x2", (d) => toXY(d.deg, plotRadius)[0])
  .attr("y2", (d) => toXY(d.deg, plotRadius)[1])
  .attr("stroke", t.grid)
  .attr("stroke-width", 1);

spokeGroup
  .selectAll("text.compass-label")
  .data(COMPASS)
  .join("text")
  .attr("class", "compass-label")
  .attr("x", (d) => toXY(d.deg, plotRadius + 34)[0])
  .attr("y", (d) => toXY(d.deg, plotRadius + 34)[1])
  .attr("text-anchor", "middle")
  .attr("dominant-baseline", "middle")
  .attr("fill", t.ink)
  .style("font-size", "16px")
  .style("font-weight", "600")
  .text((d) => d.label);

// --- Data points ---------------------------------------------------------
// Marker radius grows with speed and outlier gusts render slightly larger
// and more opaque, giving the cluster a subtle visual hierarchy instead of
// a flat wall of uniform dots.
svg
  .selectAll("circle.observation")
  .data(data)
  .join("circle")
  .attr("class", (d) => `observation${d.isOutlier ? " outlier" : ""}`)
  .attr("cx", (d) => toXY(d.theta, radialScale(d.speed))[0])
  .attr("cy", (d) => toXY(d.theta, radialScale(d.speed))[1])
  .attr("r", (d) => markerRadius(d.speed) + (d.isOutlier ? 2 : 0))
  .attr("fill", (d) => color(d.category))
  .attr("fill-opacity", (d) => (d.isOutlier ? 0.95 : 0.7))
  .attr("stroke", t.pageBg)
  .attr("stroke-width", (d) => (d.isOutlier ? 1.5 : 1));

// --- Title + subtitle ----------------------------------------------------
svg
  .append("text")
  .attr("x", width / 2)
  .attr("y", 52)
  .attr("text-anchor", "middle")
  .attr("fill", t.ink)
  .style("font-size", "26px")
  .style("font-weight", "600")
  .text("polar-scatter · javascript · d3 · anyplot.ai");

svg
  .append("text")
  .attr("x", width / 2)
  .attr("y", 84)
  .attr("text-anchor", "middle")
  .attr("fill", t.inkSoft)
  .style("font-size", "16px")
  .text("Wind observations — radius = speed (m/s), angle = compass bearing");

// --- Legend ----------------------------------------------------------------
const legendGroup = svg.append("g");
const swatch = 16;
const legendGap = 26;
const legendWidths = categories.map((c) => c.length * 9 + swatch + legendGap);
const legendTotalWidth = legendWidths.reduce((a, b) => a + b, 0);
const legendY = height - 48;

const legendEntries = (() => {
  let x = width / 2 - legendTotalWidth / 2;
  return categories.map((cat, i) => {
    const entry = { cat, x };
    x += legendWidths[i];
    return entry;
  });
})();

legendGroup
  .selectAll("rect.legend-swatch")
  .data(legendEntries)
  .join("rect")
  .attr("class", "legend-swatch")
  .attr("x", (d) => d.x)
  .attr("y", legendY - swatch / 2)
  .attr("width", swatch)
  .attr("height", swatch)
  .attr("fill", (d) => color(d.cat));

legendGroup
  .selectAll("text.legend-label")
  .data(legendEntries)
  .join("text")
  .attr("class", "legend-label")
  .attr("x", (d) => d.x + swatch + 8)
  .attr("y", legendY + swatch / 2 - 2)
  .attr("fill", t.inkSoft)
  .style("font-size", "15px")
  .text((d) => d.cat.charAt(0).toUpperCase() + d.cat.slice(1));
Runnable source as JSON, for any HTTP client: https://api.anyplot.ai/specs/polar-scatter/d3/code. Any spec id and library id listed in llms-full.txt fit the same URL shape; every URL below is complete and callable.
{
  "spec_id": "polar-scatter",
  "language": "javascript",
  "library": "d3",
  "page": "https://anyplot.ai/polar-scatter/javascript/d3",
  "hub": "https://anyplot.ai/polar-scatter",
  "code_json": "https://api.anyplot.ai/specs/polar-scatter/d3/code",
  "spec_json": "https://api.anyplot.ai/specs/polar-scatter",
  "render_light_png": "https://storage.googleapis.com/anyplot-images/plots/polar-scatter/javascript/d3/plot-light.png",
  "render_dark_png": "https://storage.googleapis.com/anyplot-images/plots/polar-scatter/javascript/d3/plot-dark.png",
  "interactive_light_html": "https://storage.googleapis.com/anyplot-images/plots/polar-scatter/javascript/d3/plot-light.html",
  "interactive_dark_html": "https://storage.googleapis.com/anyplot-images/plots/polar-scatter/javascript/d3/plot-dark.html",
  "quality_score": 94.0,
  "license": "MIT",
  "guide": "https://anyplot.ai/llms.txt"
}
Part of Polar Scatter Plot on anyplot.ai.