The same plot in 14 other libraries — JavaScript: Chart.js, D3.js, Apache ECharts, MUI X Charts; Python: Altair, Bokeh, lets-plot, Matplotlib, Plotly, plotnine, Pygal, Seaborn; R: ggplot2; Julia: Makie.jl. Compare all 15 side by side: Polar Scatter Plot in Python, R, Julia and JavaScript.
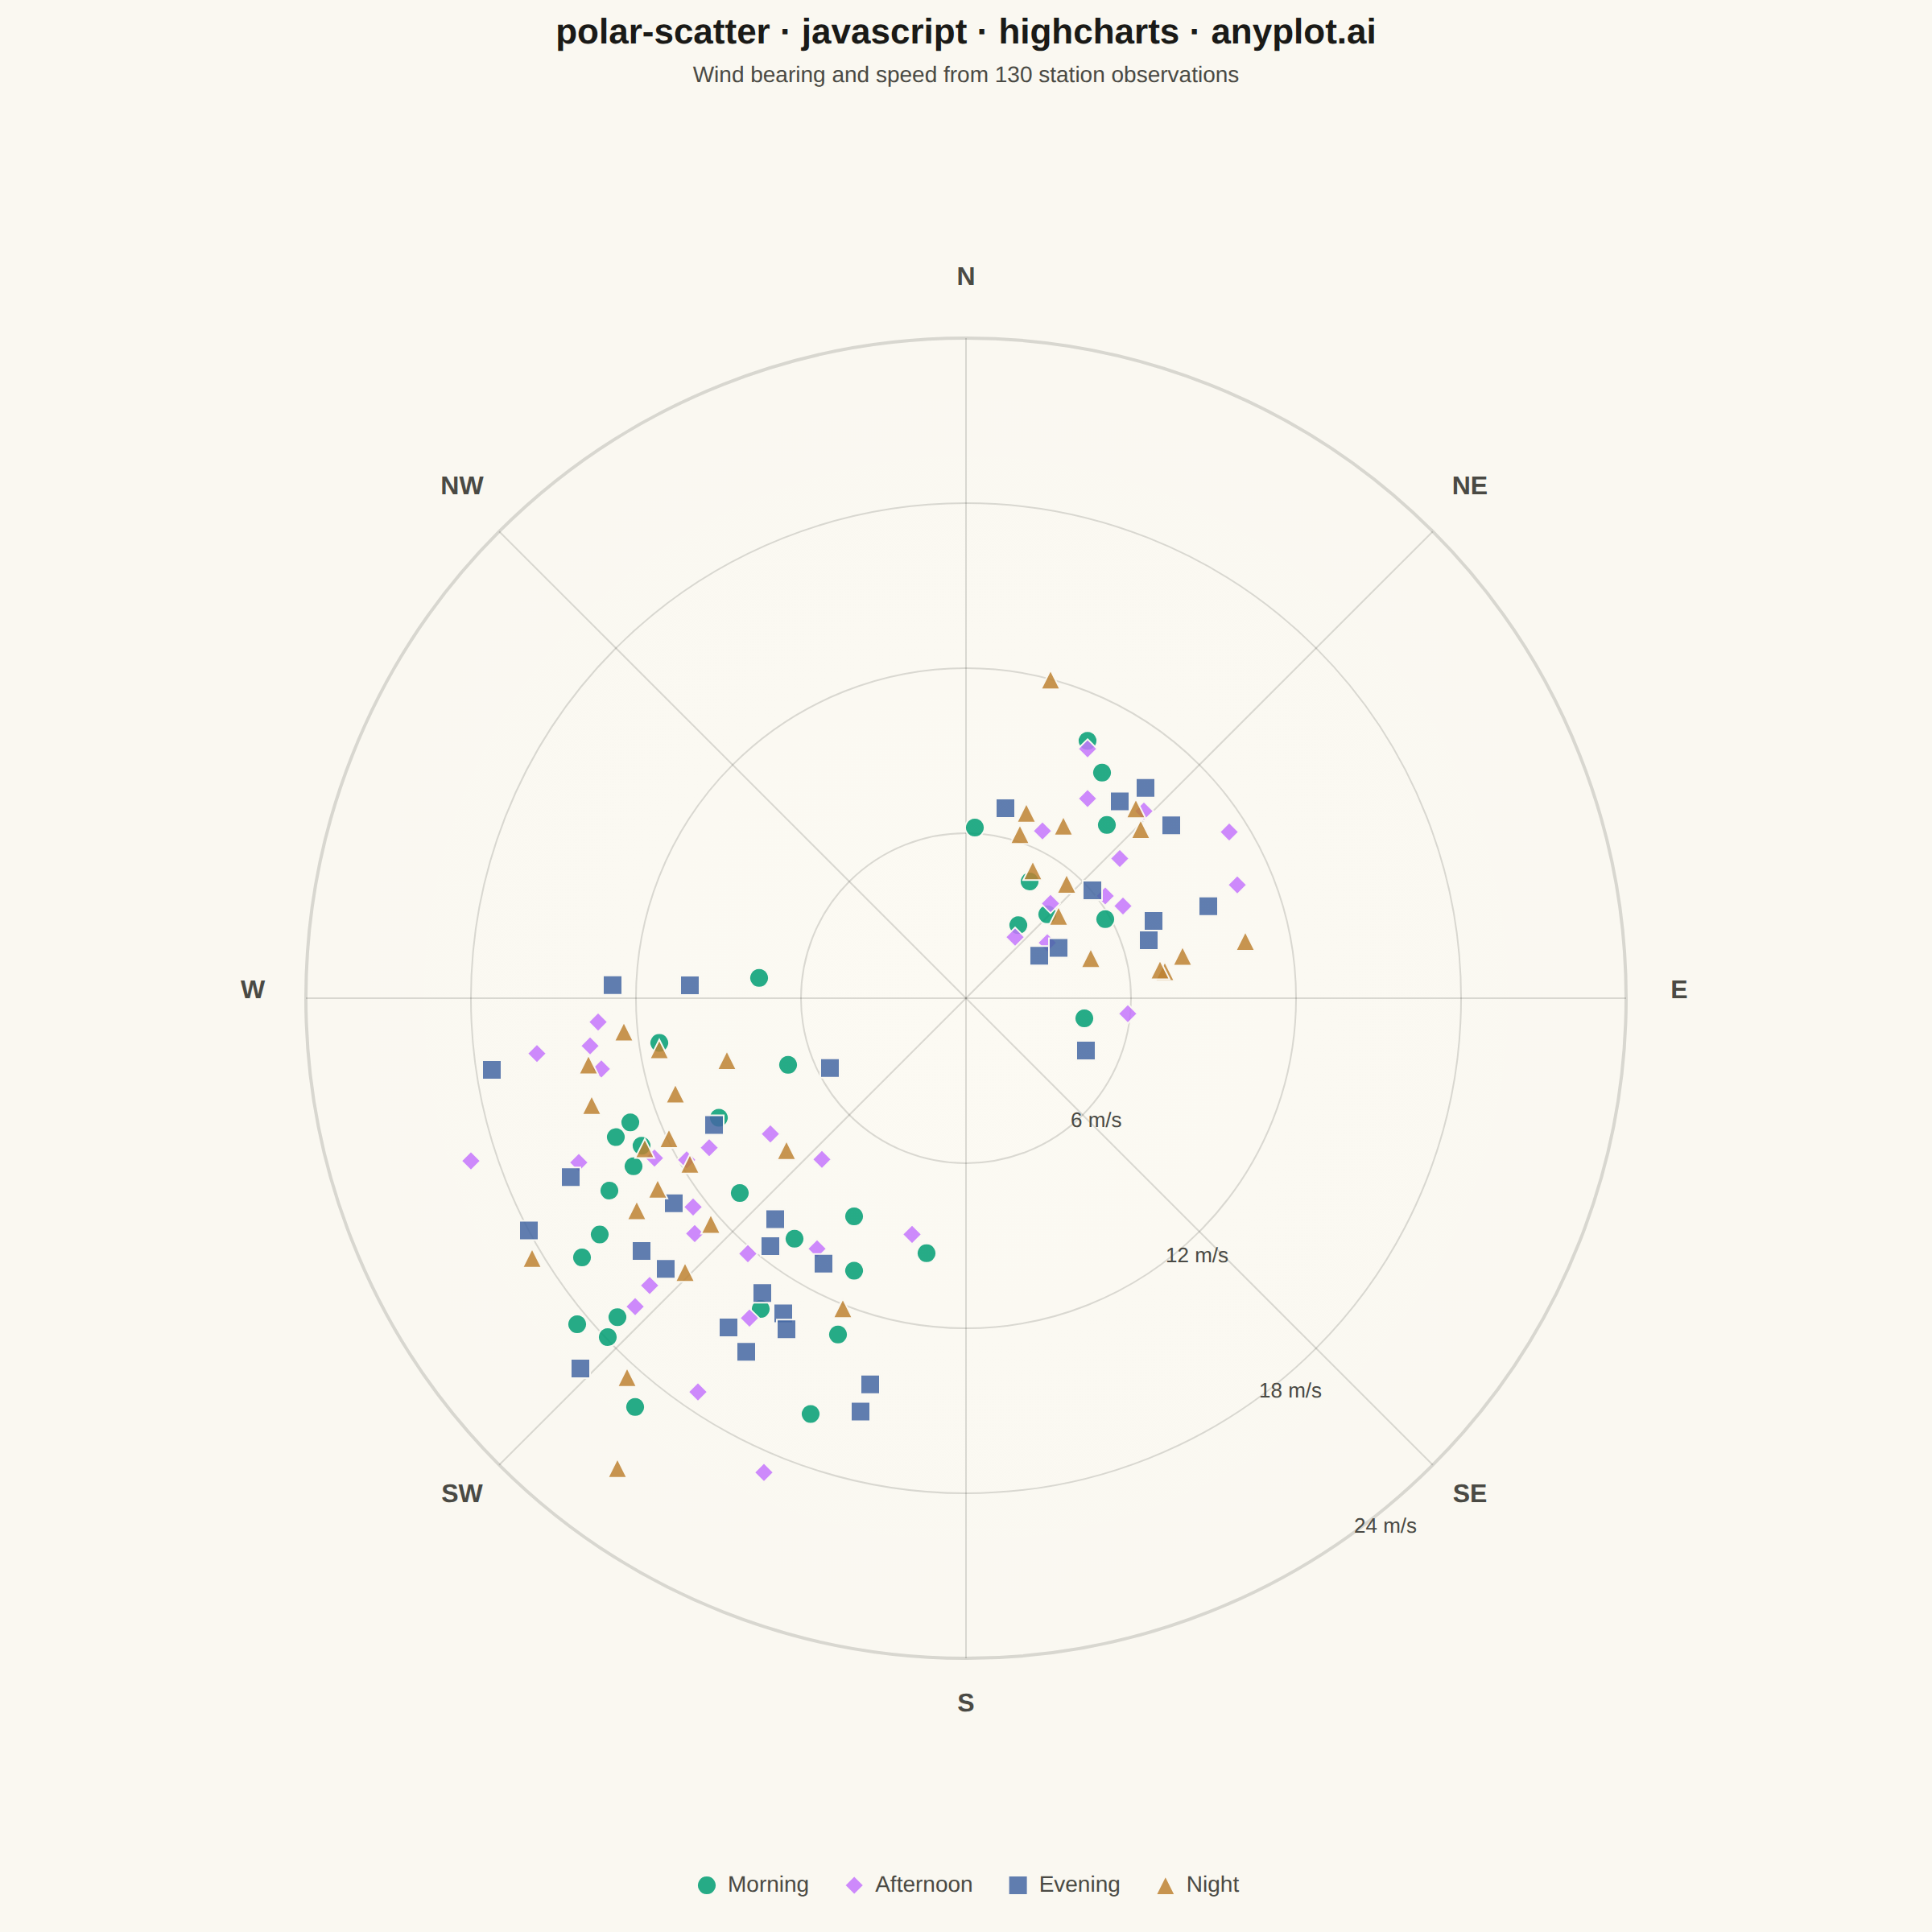
A scatter plot displayed in polar coordinates where data points are positioned using angle (theta) and radius (r) rather than Cartesian x and y coordinates. This visualization is particularly effective for cyclical or directional data where the angular component carries meaningful information.
// anyplot.ai
// polar-scatter: Polar Scatter Plot
// Library: highcharts 12.6.0 | JavaScript 22.23.2
// Quality: 89/100 | Created: 2026-09-05

//# anyplot-orientation: square

// Only the core `highcharts` bundle is loaded (no highcharts-more), so the
// native polar chart type (chart.polar) isn't available — PolarComposition
// lives in the highcharts-more module only. Each (direction, speed) polar
// coordinate is projected to Cartesian ourselves and bound as real scatter
// points on hidden, fixed-extent axes, so hover/tooltip still work in the
// interactive HTML. The radial rings, compass spokes, and their labels have
// no native polar-axis equivalent without highcharts-more, so those are
// drawn once with the core SVG renderer.
const t = window.ANYPLOT_TOKENS;

// --- Data (wind observations: bearing in degrees, speed in m/s) ------------
function lcg(seed) {
  let state = seed >>> 0;
  return () => {
    state = (state * 1664525 + 1013904223) >>> 0;
    return state / 4294967296;
  };
}
const rand = lcg(42);
const randNormal = (mean, std) => {
  const u1 = Math.max(rand(), 1e-9);
  const u2 = rand();
  const z = Math.sqrt(-2 * Math.log(u1)) * Math.cos(2 * Math.PI * u2);
  return mean + z * std;
};

const TIME_OF_DAY = ["Morning", "Afternoon", "Evening", "Night"];
const N_OBSERVATIONS = 130;
const observations = [];
for (let i = 0; i < N_OBSERVATIONS; i += 1) {
  // Two prevailing regimes: a strong south-westerly and a lighter north-easterly.
  const southwesterly = rand() < 0.65;
  const meanBearing = southwesterly ? 232 : 48;
  const bearingSpread = southwesterly ? 22 : 28;
  const meanSpeed = southwesterly ? 13.5 : 7.5;
  const speedSpread = southwesterly ? 3.5 : 2.5;

  const bearing = ((randNormal(meanBearing, bearingSpread) % 360) + 360) % 360;
  const speed = Math.max(0.6, randNormal(meanSpeed, speedSpread));
  const timeOfDay = Math.floor(rand() * TIME_OF_DAY.length);
  observations.push({ bearing, speed, timeOfDay });
}

const maxSpeed = Math.max(...observations.map((o) => o.speed));
// Round up to a multiple of 4 (not 5) so MAX_RADIUS/4 is always a whole
// number — every ring label is a clean, evenly-spaced integer.
const MAX_RADIUS = Math.ceil(maxSpeed / 4) * 4;
const RING_STEP = MAX_RADIUS / 4;
const RING_LEVELS = [RING_STEP, RING_STEP * 2, RING_STEP * 3, MAX_RADIUS];
const COMPASS = [
  { deg: 0, label: "N" },
  { deg: 45, label: "NE" },
  { deg: 90, label: "E" },
  { deg: 135, label: "SE" },
  { deg: 180, label: "S" },
  { deg: 225, label: "SW" },
  { deg: 270, label: "W" },
  { deg: 315, label: "NW" },
];

const TITLE = "polar-scatter · javascript · highcharts · anyplot.ai";
const titleFontSize = Math.round(22 * Math.min(1, 67 / TITLE.length)) + "px";

// --- Chart (empty core chart used as a canvas for the renderer overlay) ----
const chart = Highcharts.chart("container", {
  chart: {
    backgroundColor: "transparent",
    animation: false,
    style: { fontFamily: "inherit" },
    margin: [150, 110, 110, 110],
  },
  credits: { enabled: false },
  title: {
    text: TITLE,
    style: { color: t.ink, fontSize: titleFontSize, fontWeight: "600" },
  },
  subtitle: {
    text: "Wind bearing and speed from 130 station observations",
    style: { color: t.inkSoft, fontSize: "14px" },
  },
  xAxis: { visible: false, gridLineWidth: 0, lineWidth: 0, tickLength: 0 },
  yAxis: { visible: false, gridLineWidth: 0, lineWidth: 0, tickLength: 0 },
  legend: {
    enabled: true,
    itemStyle: { color: t.inkSoft, fontSize: "14px" },
    itemHoverStyle: { color: t.ink },
  },
  tooltip: {
    enabled: true,
    backgroundColor: t.elevatedBg,
    borderColor: t.grid,
    style: { color: t.ink },
    formatter() {
      const bearing = Math.round(this.point.custom.bearing);
      const speed = this.point.custom.speed.toFixed(1);
      return `<b>${this.series.name}</b><br/>${bearing}° · ${speed} m/s`;
    },
  },
  plotOptions: { series: { animation: false } },
  series: [],
});

// Fix the (visible: false) axes to a known pixel-space extent so real series
// can be data-bound at the same polar-projected coordinates the renderer
// overlay below uses for the grid.
chart.xAxis[0].setExtremes(0, chart.plotWidth, false);
chart.yAxis[0].setExtremes(0, chart.plotHeight, false);

// --- Geometry ----------------------------------------------------------------
const cx = chart.plotLeft + chart.plotWidth / 2;
const cy = chart.plotTop + chart.plotHeight / 2;
const outerR = Math.min(chart.plotWidth, chart.plotHeight) / 2 - 60;

// 0° points straight up (north); bearings increase clockwise, matching a compass.
const angleOf = (bearing) => ((bearing - 90) * Math.PI) / 180;
const pointAt = (bearing, radiusFrac) => {
  const angle = angleOf(bearing);
  return [cx + outerR * radiusFrac * Math.cos(angle), cy + outerR * radiusFrac * Math.sin(angle)];
};
// Project a renderer-space [x, y] pixel into the fixed-extent axis coordinates
// the data-bound series below use (yAxis increases upward, so flip y).
const toAxisXY = ([sx, sy]) => [sx - chart.plotLeft, chart.plotTop + chart.plotHeight - sy];

// Convert a palette hex color to rgba so overlapping markers can be given a
// slight fill translucency without losing the category color.
const hexToRgba = (hex, alpha) => {
  const clean = hex.replace("#", "");
  const value = parseInt(clean, 16);
  const r = (value >> 16) & 255;
  const g = (value >> 8) & 255;
  const b = value & 255;
  return `rgba(${r}, ${g}, ${b}, ${alpha})`;
};

// Subtle radial tint behind the grid — lifts the chrome beyond a flat plane
// without competing with the data. Low alpha throughout so it reads as a
// faint glow, not a filled disc.
chart.renderer
  .circle(cx, cy, outerR)
  .attr({
    fill: {
      radialGradient: { cx: 0.5, cy: 0.5, r: 0.5 },
      stops: [
        [0, hexToRgba(t.elevatedBg, 0.4)],
        [1, hexToRgba(t.elevatedBg, 0)],
      ],
    },
    zIndex: 0,
  })
  .add();

// --- Radial grid rings + value labels (no native polar axis without more.js) --
// The two prevailing-wind clusters sit around 48° (20°-76°) and 232°
// (210°-254°), so the SE sector stays clear of data at every radius — the
// natural spot for the scale.
const RING_LABEL_ANGLE = 145;
RING_LEVELS.forEach((level, index) => {
  const isOutermost = index === RING_LEVELS.length - 1;
  chart.renderer
    .circle(cx, cy, outerR * (level / MAX_RADIUS))
    .attr({ stroke: t.grid, "stroke-width": isOutermost ? 2 : 1, fill: "none", zIndex: 1 })
    .add();

  const [lx, ly] = pointAt(RING_LABEL_ANGLE, level / MAX_RADIUS);
  chart.renderer
    .text(`${level} m/s`, lx + 6, ly - 4)
    .attr({ zIndex: 3 })
    .css({ color: t.inkSoft, fontSize: "13px" })
    .add();
});

// --- Angular spokes + compass labels -----------------------------------------
COMPASS.forEach(({ deg, label }) => {
  const [ex, ey] = pointAt(deg, 1);
  chart.renderer
    .path(["M", cx, cy, "L", ex, ey])
    .attr({ stroke: t.grid, "stroke-width": 1, zIndex: 1 })
    .add();

  const [lx, ly] = pointAt(deg, 1.08);
  chart.renderer
    .text(label, lx, ly)
    .attr({ align: "center", zIndex: 3 })
    .css({ color: t.inkSoft, fontSize: "16px", fontWeight: "600" })
    .add();
});

// --- Scatter series, one per time-of-day category (real data-bound points) --
const series = TIME_OF_DAY.map((name, categoryIndex) => {
  const data = observations
    .filter((o) => o.timeOfDay === categoryIndex)
    .map((o) => {
      const [sx, sy] = pointAt(o.bearing, o.speed / MAX_RADIUS);
      const [ax, ay] = toAxisXY([sx, sy]);
      return { x: ax, y: ay, custom: { bearing: o.bearing, speed: o.speed } };
    });
  return {
    type: "scatter",
    name,
    color: t.palette[categoryIndex],
    marker: {
      radius: 6,
      lineColor: t.pageBg,
      lineWidth: 1,
      fillColor: hexToRgba(t.palette[categoryIndex], 0.85),
    },
    data,
  };
});
series.forEach((s) => chart.addSeries(s, false));
chart.redraw();
Runnable source as JSON, for any HTTP client: https://api.anyplot.ai/specs/polar-scatter/highcharts/code. Any spec id and library id listed in llms-full.txt fit the same URL shape; every URL below is complete and callable.
{
  "spec_id": "polar-scatter",
  "language": "javascript",
  "library": "highcharts",
  "page": "https://anyplot.ai/polar-scatter/javascript/highcharts",
  "hub": "https://anyplot.ai/polar-scatter",
  "code_json": "https://api.anyplot.ai/specs/polar-scatter/highcharts/code",
  "spec_json": "https://api.anyplot.ai/specs/polar-scatter",
  "render_light_png": "https://storage.googleapis.com/anyplot-images/plots/polar-scatter/javascript/highcharts/plot-light.png",
  "render_dark_png": "https://storage.googleapis.com/anyplot-images/plots/polar-scatter/javascript/highcharts/plot-dark.png",
  "interactive_light_html": "https://storage.googleapis.com/anyplot-images/plots/polar-scatter/javascript/highcharts/plot-light.html",
  "interactive_dark_html": "https://storage.googleapis.com/anyplot-images/plots/polar-scatter/javascript/highcharts/plot-dark.html",
  "quality_score": 89.0,
  "license": "MIT",
  "guide": "https://anyplot.ai/llms.txt"
}
Part of Polar Scatter Plot on anyplot.ai.