The same plot in 14 other libraries — JavaScript: Chart.js, D3.js, Highcharts, MUI X Charts; Python: Altair, Bokeh, lets-plot, Matplotlib, Plotly, plotnine, Pygal, Seaborn; R: ggplot2; Julia: Makie.jl. Compare all 15 side by side: t-SNE and UMAP Embedding Visualization in Python, R, Julia and JavaScript.
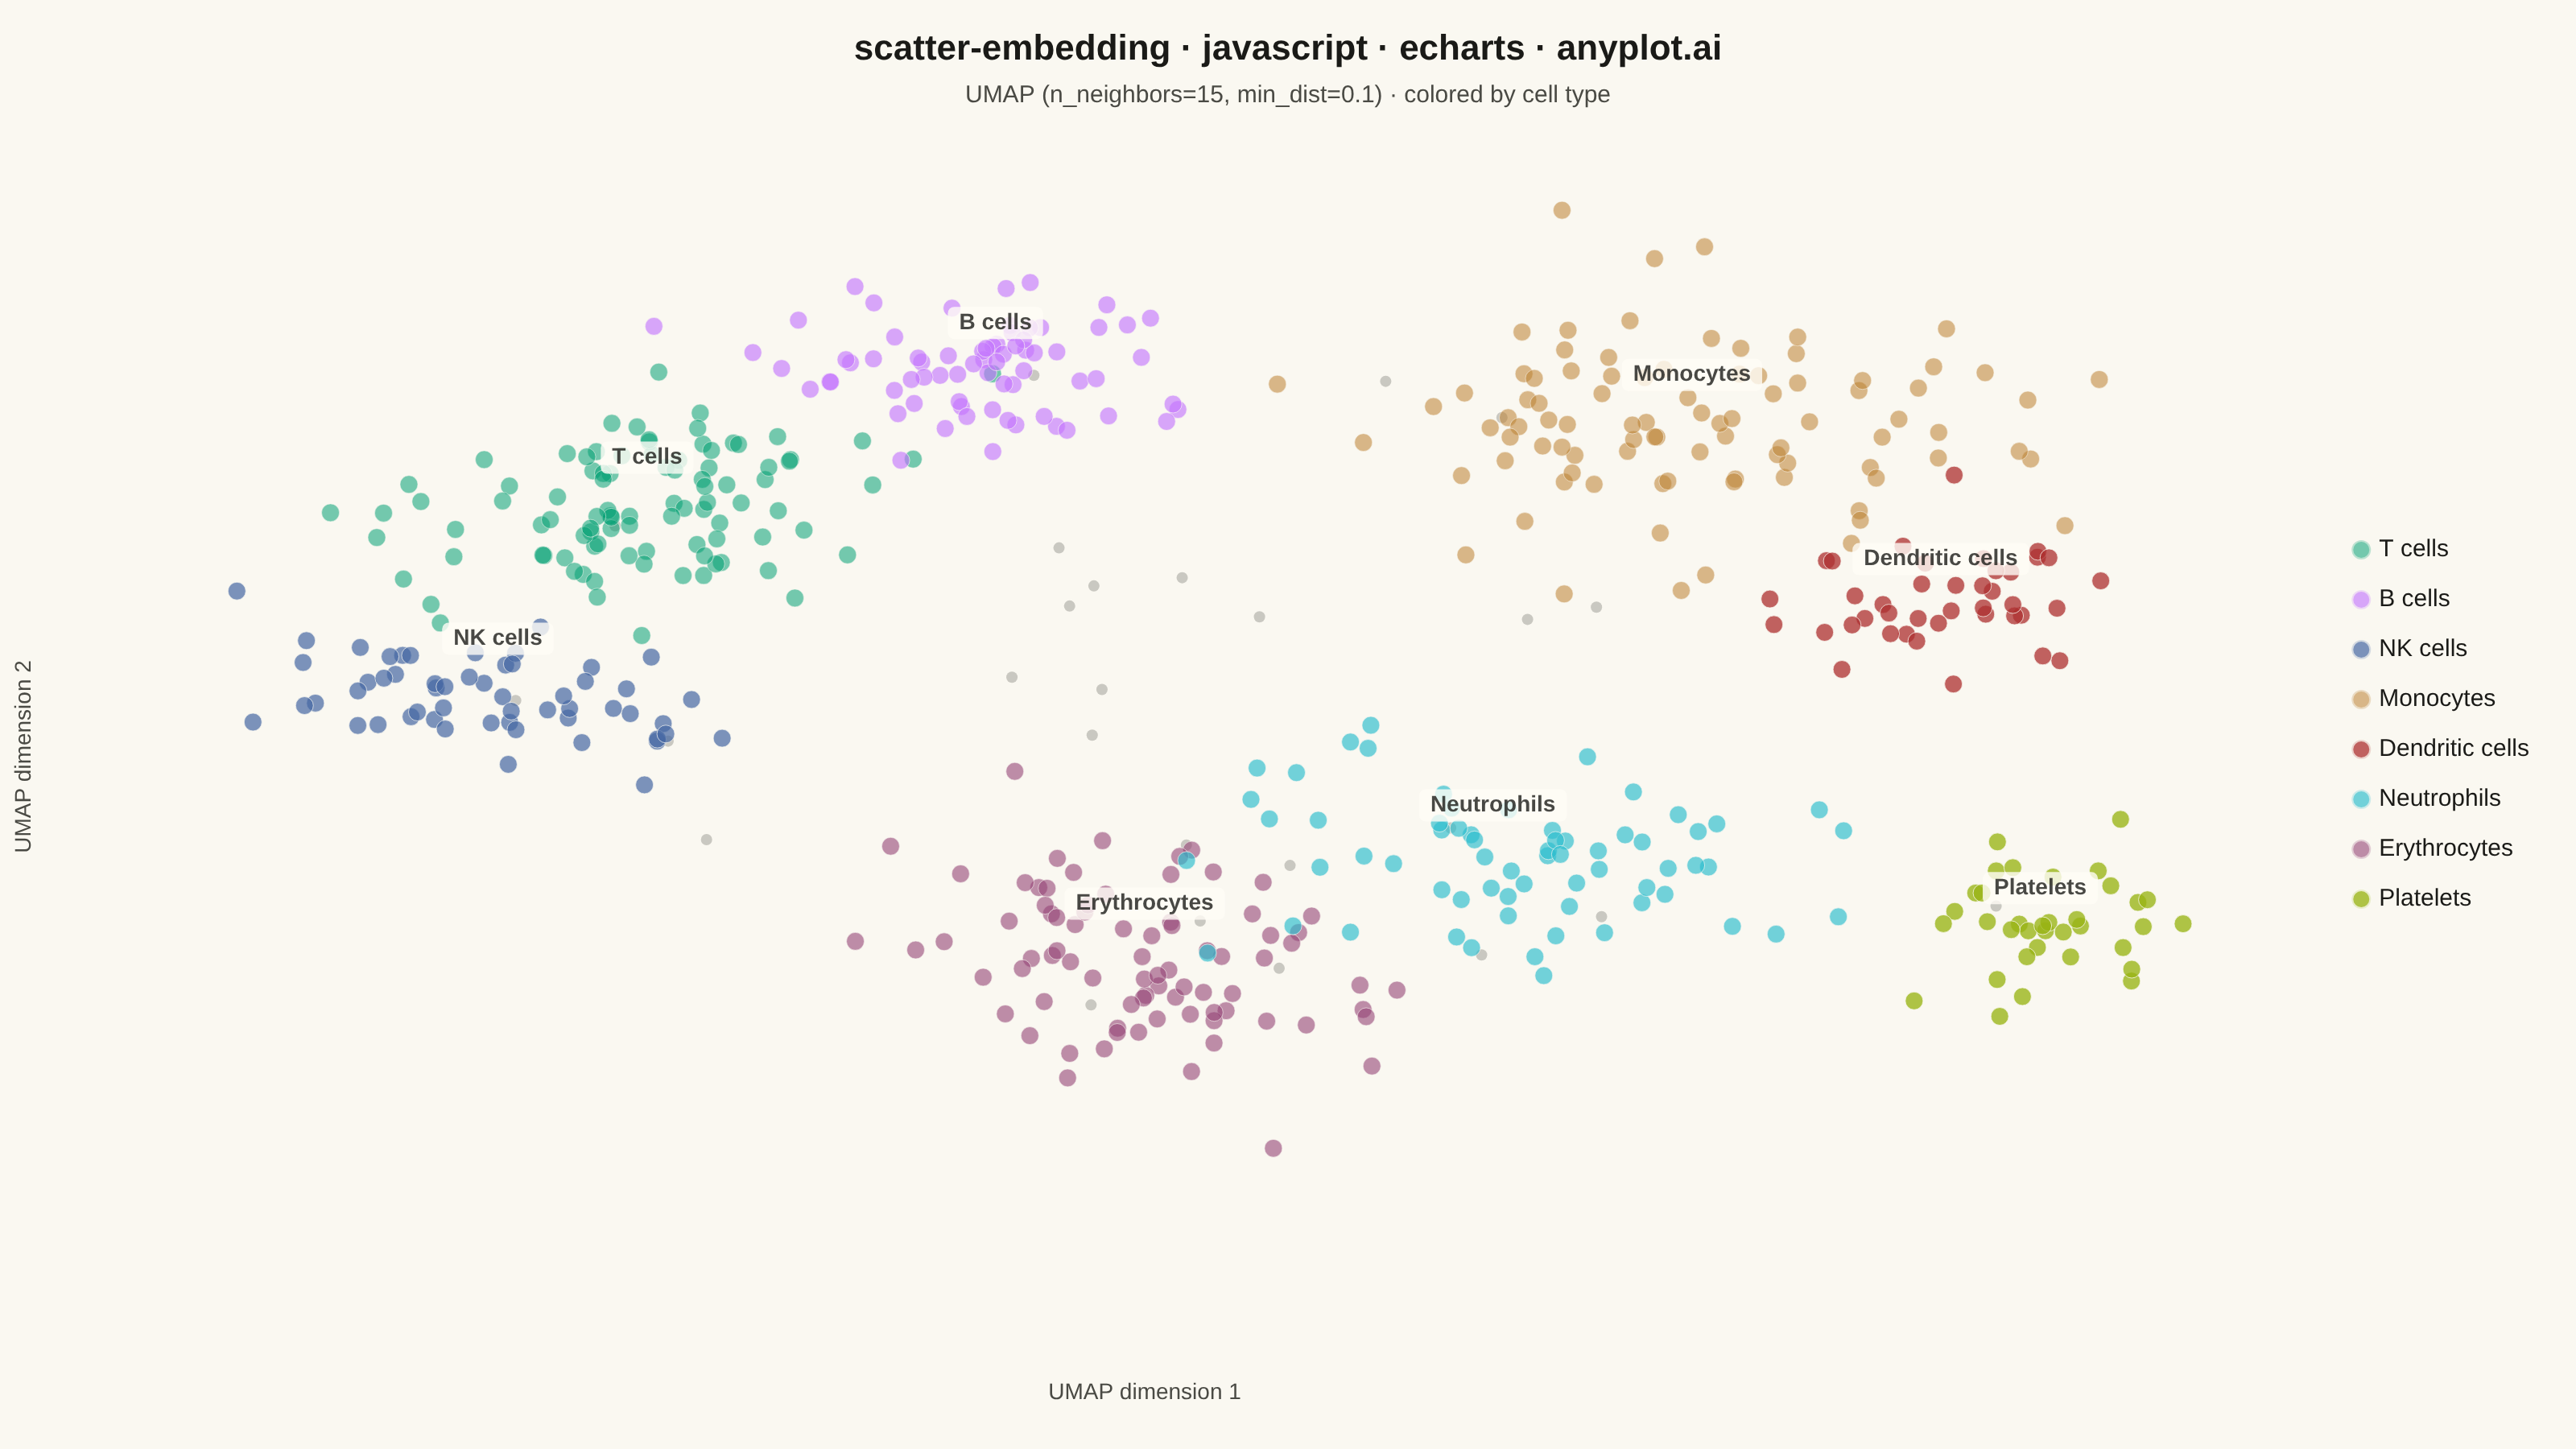
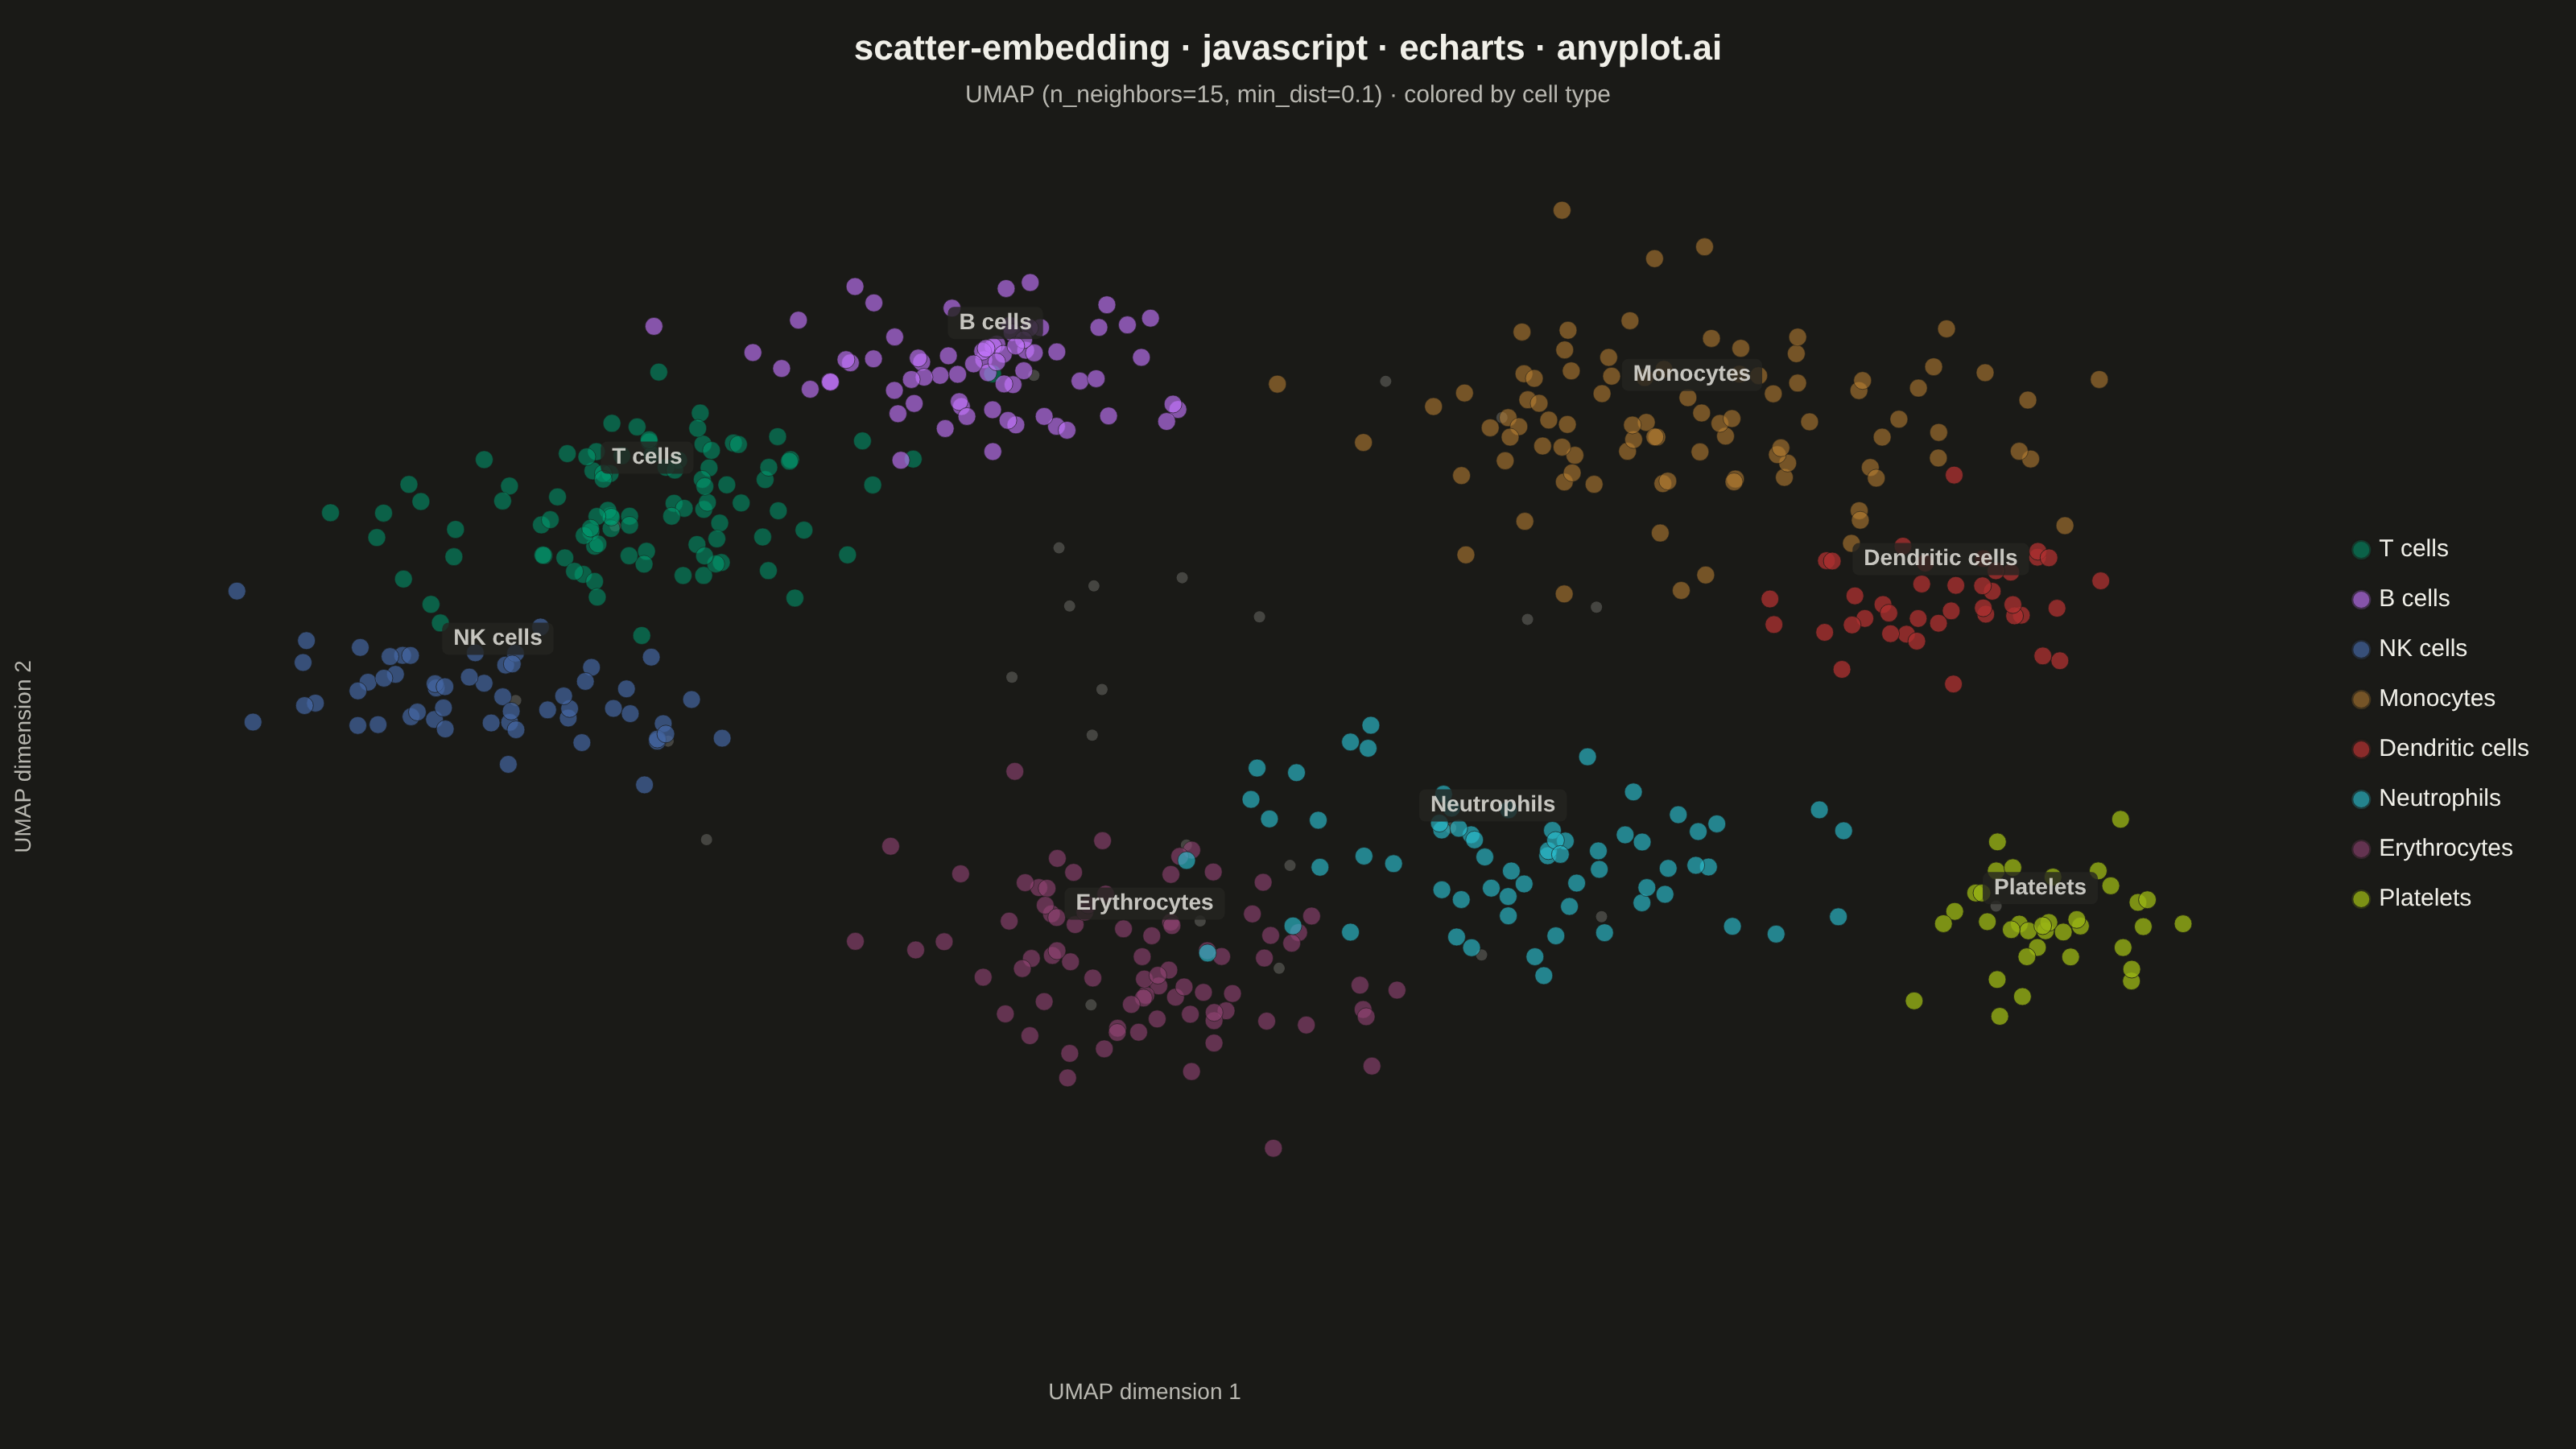
A scatter plot displaying high-dimensional data projected into 2D space using non-linear dimensionality reduction techniques such as t-SNE or UMAP. Points are colored by cluster or class label, revealing groupings and latent structure in the data. This is a standard visualization in machine learning for exploring embeddings, single-cell RNA-seq data, and NLP document clustering, helping practitioners verify that learned representations capture meaningful distinctions.
// anyplot.ai
// scatter-embedding: t-SNE and UMAP Embedding Visualization
// Library: echarts 6.1.0 | JavaScript 22.23.1
// Quality: 92/100 | Created: 2026-08-11

const t = window.ANYPLOT_TOKENS;

// --- Deterministic PRNG (LCG) + Box-Muller for gaussian jitter --------------
let seed = 20260811;
function rnd() {
  seed = (seed * 1103515245 + 12345) & 0x7fffffff;
  return seed / 0x7fffffff;
}
function gauss() {
  const u1 = Math.max(rnd(), 1e-9);
  const u2 = rnd();
  return Math.sqrt(-2 * Math.log(u1)) * Math.cos(2 * Math.PI * u2);
}

// --- Synthetic single-cell RNA-seq UMAP embedding ---------------------------
// 8 cell-type clusters, each with its own center, elongation and rotation —
// mimics a real UMAP projection where cluster shape/density varies by type,
// rather than uniform circular blobs.
const CLUSTERS = [
  { label: "T cells", cx: -6.5, cy: 3.0, sx: 1.3, sy: 1.0, rot: 0.4, n: 95 },
  { label: "B cells", cx: -3.0, cy: 6.0, sx: 1.0, sy: 0.9, rot: -0.3, n: 70 },
  { label: "NK cells", cx: -8.0, cy: -1.0, sx: 0.9, sy: 1.1, rot: 0.8, n: 55 },
  { label: "Monocytes", cx: 4.0, cy: 4.5, sx: 1.6, sy: 1.3, rot: 0.2, n: 90 },
  { label: "Dendritic cells", cx: 6.5, cy: 1.0, sx: 0.8, sy: 0.8, rot: 0.0, n: 40 },
  { label: "Neutrophils", cx: 2.0, cy: -4.5, sx: 1.4, sy: 1.0, rot: -0.5, n: 65 },
  { label: "Erythrocytes", cx: -1.5, cy: -7.0, sx: 1.1, sy: 1.4, rot: 0.6, n: 80 },
  { label: "Platelets", cx: 7.5, cy: -6.0, sx: 0.7, sy: 0.7, rot: 0.0, n: 35 },
];
const nMin = Math.min(...CLUSTERS.map((c) => c.n));
const nMax = Math.max(...CLUSTERS.map((c) => c.n));

// Denser clusters get slightly lower opacity so overplotting stays legible;
// sparser clusters render a touch bolder — a deliberate, density-aware
// marker treatment rather than one flat alpha for every series.
function densityOpacity(n) {
  const frac = (n - nMin) / (nMax - nMin);
  return 0.78 - frac * 0.24;
}

const clusterSeries = CLUSTERS.map((c, idx) => {
  const points = [];
  for (let i = 0; i < c.n; i++) {
    const gx = gauss() * c.sx;
    const gy = gauss() * c.sy;
    const rx = gx * Math.cos(c.rot) - gy * Math.sin(c.rot);
    const ry = gx * Math.sin(c.rot) + gy * Math.cos(c.rot);
    points.push([c.cx + rx, c.cy + ry]);
  }
  return {
    name: c.label,
    type: "scatter",
    data: points,
    symbolSize: 11,
    // Color pinned to the canonical Imprint index (not render order) so the
    // legend/z-order reshuffle below never changes which hue a cell type gets.
    itemStyle: {
      color: t.palette[idx],
      opacity: densityOpacity(c.n),
      borderColor: t.pageBg,
      borderWidth: 0.5,
    },
    emphasis: { itemStyle: { opacity: 1, borderWidth: 1.5 } },
    n: c.n,
  };
})
  // Deliberate z-ordering: draw the densest clusters first (bottom layer) so
  // smaller, sparser clusters always render on top and stay fully visible
  // instead of being buried under a larger neighbor.
  .sort((a, b) => b.n - a.n);

// A thin scatter of unassigned/background cells between clusters — real
// UMAP/t-SNE projections rarely produce perfectly clean, noise-free blobs.
const NOISE_N = 26;
const noisePoints = [];
for (let i = 0; i < NOISE_N; i++) {
  const a = CLUSTERS[Math.floor(rnd() * CLUSTERS.length)];
  const b = CLUSTERS[Math.floor(rnd() * CLUSTERS.length)];
  const frac = 0.25 + rnd() * 0.5;
  const jx = gauss() * 0.5;
  const jy = gauss() * 0.5;
  noisePoints.push([a.cx + (b.cx - a.cx) * frac + jx, a.cy + (b.cy - a.cy) * frac + jy]);
}
const noiseSeries = {
  name: "noise",
  type: "scatter",
  silent: true,
  data: noisePoints,
  symbolSize: 7,
  itemStyle: { color: t.inkSoft, opacity: 0.28 },
};

const centroidLabels = {
  name: "centroids",
  type: "scatter",
  silent: true,
  symbolSize: 0,
  // Nudge the label above each cluster's centroid rather than dead center,
  // so it sits over sparser edge points instead of the densest core.
  data: CLUSTERS.map((c) => ({ value: [c.cx, c.cy + c.sy * 0.95], name: c.label })),
  label: {
    show: true,
    formatter: "{b}",
    color: t.ink,
    fontSize: 14,
    fontWeight: 600,
    padding: [3, 7],
    borderRadius: 4,
    backgroundColor: t.elevatedBg,
  },
};

// --- Render -------------------------------------------------------------
const chart = echarts.init(document.getElementById("container"));

chart.setOption({
  animation: false,
  color: t.palette,
  backgroundColor: "transparent",
  title: {
    text: "scatter-embedding · javascript · echarts · anyplot.ai",
    subtext: "UMAP (n_neighbors=15, min_dist=0.1) · colored by cell type",
    left: "center",
    textStyle: { color: t.ink, fontSize: 22, fontWeight: 600 },
    subtextStyle: { color: t.inkSoft, fontSize: 15 },
  },
  legend: {
    data: CLUSTERS.map((c) => c.label),
    icon: "circle",
    orient: "vertical",
    right: 24,
    top: "middle",
    itemWidth: 12,
    itemHeight: 12,
    itemGap: 16,
    textStyle: { color: t.ink, fontSize: 15 },
  },
  tooltip: {
    trigger: "item",
    formatter: (p) => p.seriesName,
  },
  grid: { left: 60, right: 240, top: 110, bottom: 70 },
  // Minimal frame (style-guide "remove all spines" alternative for clean
  // scatter plots): no axis line, no split lines — just the descriptive
  // dimension names, since embedding coordinates carry no interpretable
  // ticks and a full box border reads as unnecessary chartjunk here.
  xAxis: {
    type: "value",
    name: "UMAP dimension 1",
    nameLocation: "middle",
    nameGap: 28,
    nameTextStyle: { color: t.inkSoft, fontSize: 14 },
    axisLabel: { show: false },
    axisTick: { show: false },
    axisLine: { show: false },
    splitLine: { show: false },
  },
  yAxis: {
    type: "value",
    name: "UMAP dimension 2",
    nameLocation: "middle",
    nameGap: 40,
    nameTextStyle: { color: t.inkSoft, fontSize: 14 },
    axisLabel: { show: false },
    axisTick: { show: false },
    axisLine: { show: false },
    splitLine: { show: false },
  },
  series: [noiseSeries, ...clusterSeries, centroidLabels],
});

chart.on("finished", () => {
  window.__anyplotReady = true;
});
Runnable source as JSON, for any HTTP client: https://api.anyplot.ai/specs/scatter-embedding/echarts/code. Any spec id and library id listed in llms-full.txt fit the same URL shape; every URL below is complete and callable.
{
  "spec_id": "scatter-embedding",
  "language": "javascript",
  "library": "echarts",
  "page": "https://anyplot.ai/scatter-embedding/javascript/echarts",
  "hub": "https://anyplot.ai/scatter-embedding",
  "code_json": "https://api.anyplot.ai/specs/scatter-embedding/echarts/code",
  "spec_json": "https://api.anyplot.ai/specs/scatter-embedding",
  "render_light_png": "https://storage.googleapis.com/anyplot-images/plots/scatter-embedding/javascript/echarts/plot-light.png",
  "render_dark_png": "https://storage.googleapis.com/anyplot-images/plots/scatter-embedding/javascript/echarts/plot-dark.png",
  "interactive_light_html": "https://storage.googleapis.com/anyplot-images/plots/scatter-embedding/javascript/echarts/plot-light.html",
  "interactive_dark_html": "https://storage.googleapis.com/anyplot-images/plots/scatter-embedding/javascript/echarts/plot-dark.html",
  "quality_score": 92.0,
  "license": "MIT",
  "guide": "https://anyplot.ai/llms.txt"
}
Part of t-SNE and UMAP Embedding Visualization on anyplot.ai.