The same plot in 14 other libraries — JavaScript: Chart.js, D3.js, Apache ECharts, Highcharts; Python: Altair, Bokeh, lets-plot, Matplotlib, Plotly, plotnine, Pygal, Seaborn; R: ggplot2; Julia: Makie.jl. Compare all 15 side by side: t-SNE and UMAP Embedding Visualization in Python, R, Julia and JavaScript.
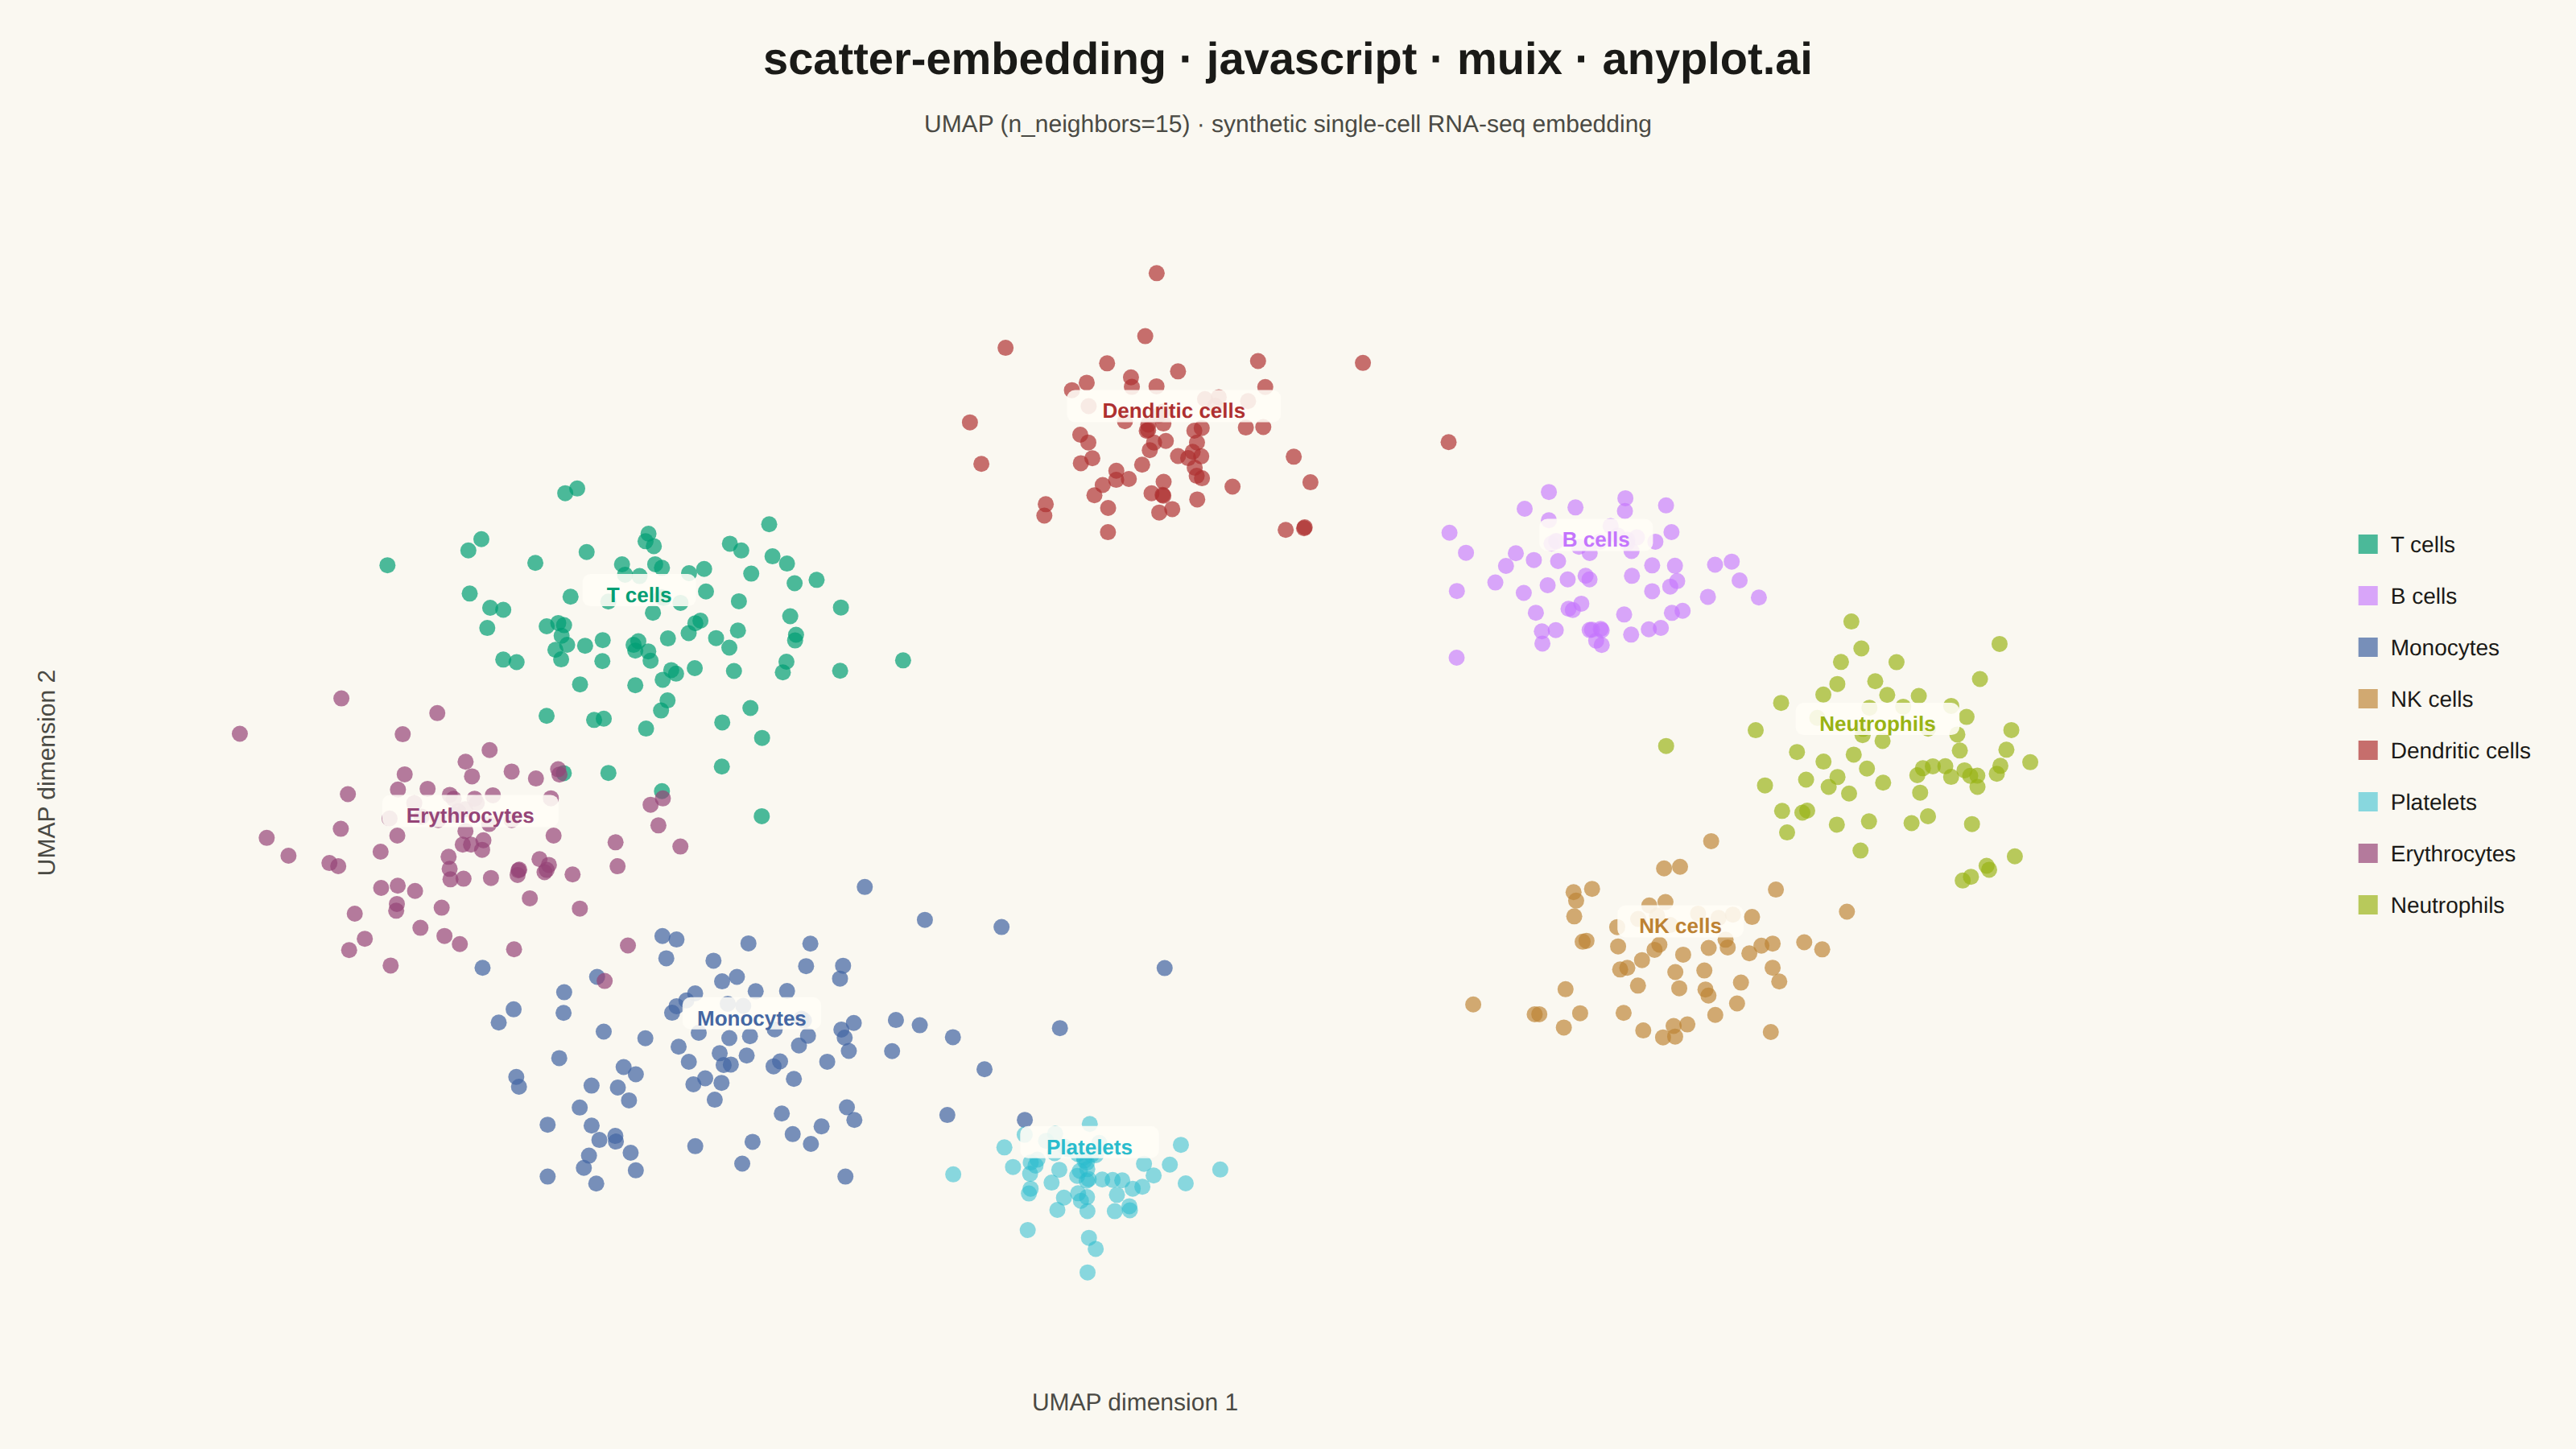
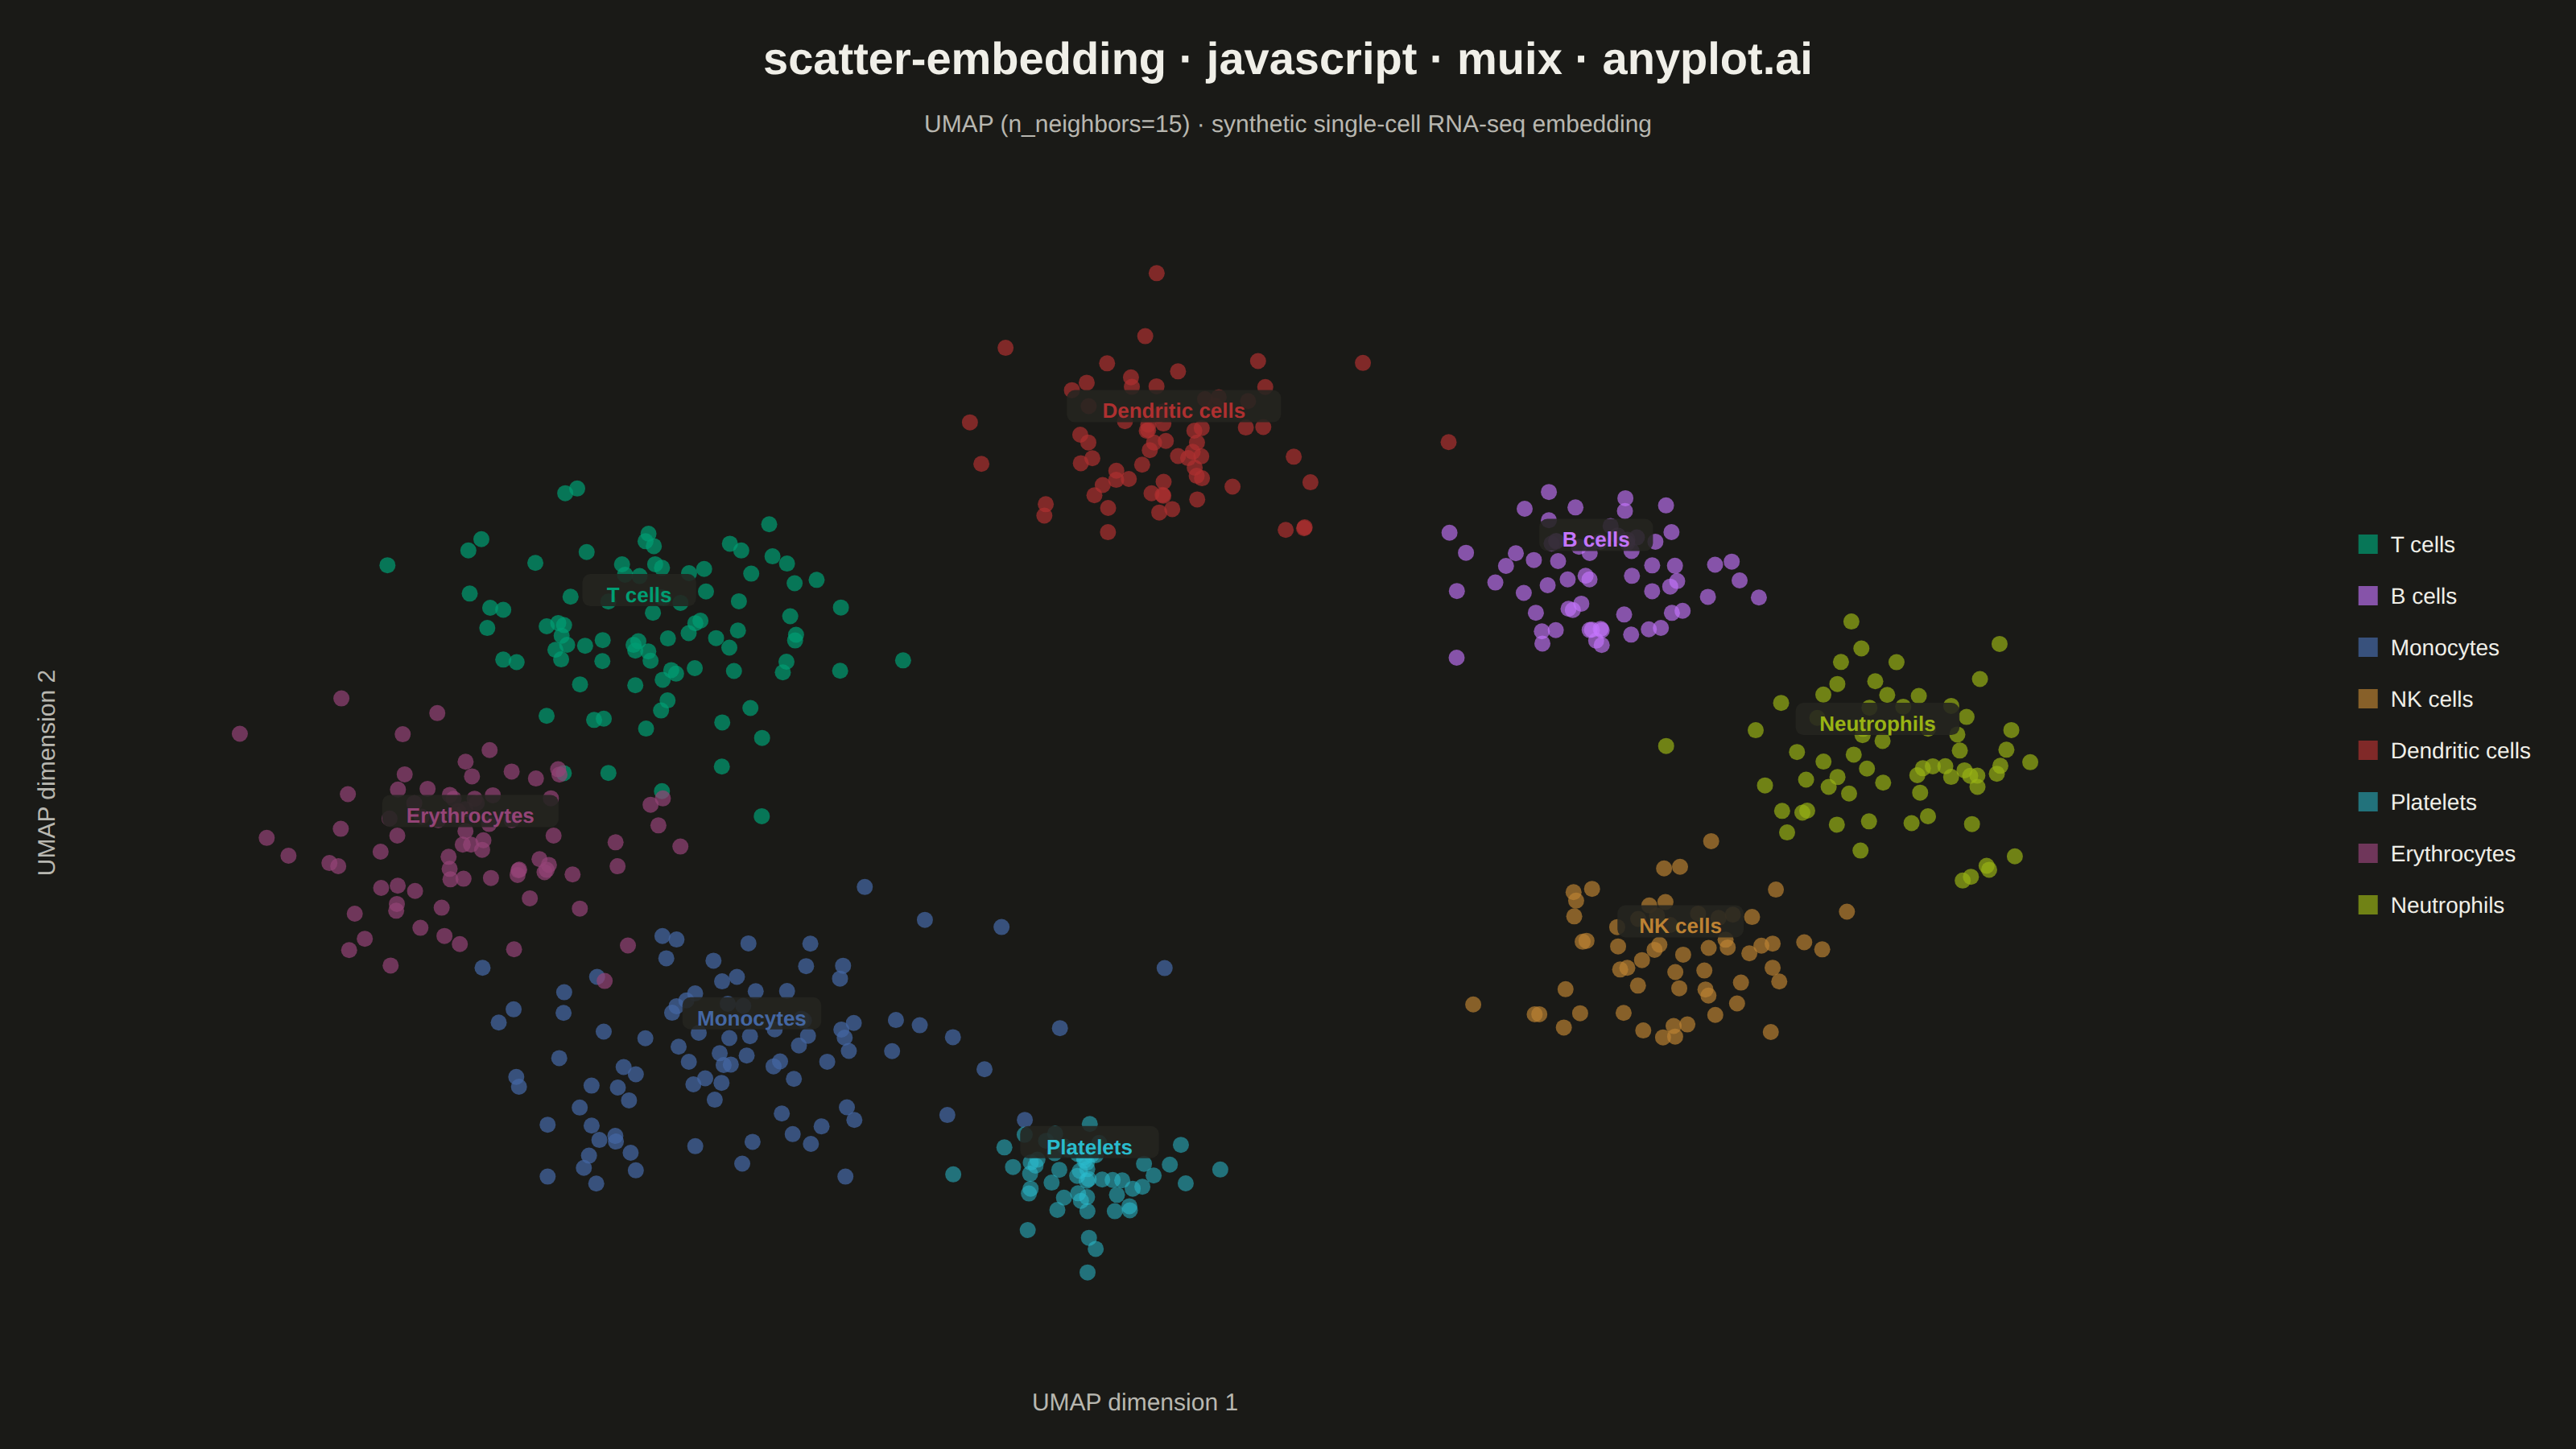
A scatter plot displaying high-dimensional data projected into 2D space using non-linear dimensionality reduction techniques such as t-SNE or UMAP. Points are colored by cluster or class label, revealing groupings and latent structure in the data. This is a standard visualization in machine learning for exploring embeddings, single-cell RNA-seq data, and NLP document clustering, helping practitioners verify that learned representations capture meaningful distinctions.
// anyplot.ai
// scatter-embedding: t-SNE and UMAP Embedding Visualization
// Library: muix 7.29.1 | JavaScript 22.23.1
// Quality: 90/100 | Created: 2026-08-11
//# anyplot-orientation: landscape
// anyplot.ai
// scatter-embedding: t-SNE and UMAP Embedding Visualization
// Library: MUI X Charts | React | Node 22
// License: @mui/x-charts — MIT (community). Pro/Premium are out of scope.
// Quality: pending | Created: 2026-08-11

import { ChartContainer } from "@mui/x-charts/ChartContainer";
import { ScatterPlot } from "@mui/x-charts/ScatterChart";
import { ChartsXAxis } from "@mui/x-charts/ChartsXAxis";
import { ChartsYAxis } from "@mui/x-charts/ChartsYAxis";
import { ChartsLegend } from "@mui/x-charts/ChartsLegend";
import { useXScale, useYScale } from "@mui/x-charts/hooks";

const t = window.ANYPLOT_TOKENS;
const { width, height } = window.ANYPLOT_SIZE;

// Deterministic LCG (seed 42) — no Math.random() in the browser harness
let seed = 42;
function rng() {
  seed = (1664525 * seed + 1013904223) >>> 0;
  return seed / 4294967296;
}
function randn() {
  const u = Math.max(rng(), 1e-9);
  const v = rng();
  return Math.sqrt(-2 * Math.log(u)) * Math.cos(2 * Math.PI * v);
}
function hexToRgba(hex, alpha) {
  const r = parseInt(hex.slice(1, 3), 16);
  const g = parseInt(hex.slice(3, 5), 16);
  const b = parseInt(hex.slice(5, 7), 16);
  return `rgba(${r}, ${g}, ${b}, ${alpha})`;
}

// --- Data: simulated UMAP projection of single-cell RNA-seq data -----------
// 8 cell-type clusters scattered around distinct centroids in 2D embedding
// space (the axes themselves carry no interpretable units). Point count and
// spread vary per cluster — real UMAP/t-SNE embeddings show clusters of
// differing size and compactness, not uniform blobs.
const CLUSTERS = [
  { label: "T cells", cx: -9, cy: 5, spread: 1.9, n: 90 },
  { label: "B cells", cx: 8, cy: 6.5, spread: 1.3, n: 65 },
  { label: "Monocytes", cx: -7, cy: -6.5, spread: 2.1, n: 95 },
  { label: "NK cells", cx: 9.5, cy: -4, spread: 1.4, n: 60 },
  { label: "Dendritic cells", cx: 0.5, cy: 10, spread: 1.6, n: 70 },
  { label: "Platelets", cx: -1, cy: -10, spread: 1.0, n: 55 },
  { label: "Erythrocytes", cx: -12, cy: -1, spread: 1.75, n: 80 },
  { label: "Neutrophils", cx: 13, cy: 1.5, spread: 1.5, n: 65 },
];

const clusterData = CLUSTERS.map((cluster) =>
  Array.from({ length: cluster.n }, (_, i) => ({
    id: `${cluster.label}-${i}`,
    x: cluster.cx + randn() * cluster.spread,
    y: cluster.cy + randn() * cluster.spread,
  })),
);

// Denser, tighter clusters get more transparency so overlapping cores stay
// distinguishable; sparser clusters can afford to render more opaque.
const densities = CLUSTERS.map((c) => c.n / (c.spread * c.spread));
const MIN_DENSITY = Math.min(...densities);
const MAX_DENSITY = Math.max(...densities);
function alphaForCluster(cluster) {
  const density = cluster.n / (cluster.spread * cluster.spread);
  const t01 = (density - MIN_DENSITY) / (MAX_DENSITY - MIN_DENSITY || 1);
  return 0.72 - t01 * 0.17; // 0.72 (sparse) -> 0.55 (dense)
}

const allPoints = clusterData.flat();
const xs = allPoints.map((p) => p.x);
const ys = allPoints.map((p) => p.y);
const xPad = (Math.max(...xs) - Math.min(...xs)) * 0.08;
const yPad = (Math.max(...ys) - Math.min(...ys)) * 0.08;
const X_MIN = Math.min(...xs) - xPad;
const X_MAX = Math.max(...xs) + xPad;
const Y_MIN = Math.min(...ys) - yPad;
const Y_MAX = Math.max(...ys) + yPad;

const MARGIN = { top: 120, right: 250, bottom: 60, left: 60 };

// Centroid labels rendered at data coordinates via the live D3 scales — the
// redundant color+text encoding required once a chart uses all 8 categorical
// series (see default-style-guide.md "series-count guidance").
function CentroidLabels() {
  const xScale = useXScale();
  const yScale = useYScale();
  if (!xScale || !yScale) return null;

  return (
    <g>
      {CLUSTERS.map((cluster, i) => {
        const cx = xScale(cluster.cx);
        const cy = yScale(cluster.cy) - 20;
        const halfWidth = cluster.label.length * 3.9 + 8;
        return (
          <g key={cluster.label}>
            <rect
              x={cx - halfWidth}
              y={cy - 14}
              width={halfWidth * 2}
              height={20}
              rx={5}
              fill={t.elevatedBg}
              opacity={0.88}
            />
            <text
              x={cx}
              y={cy}
              textAnchor="middle"
              dominantBaseline="middle"
              fontSize={13}
              fontWeight={600}
              fill={t.palette[i]}
            >
              {cluster.label}
            </text>
          </g>
        );
      })}
    </g>
  );
}

const TITLE = "scatter-embedding · javascript · muix · anyplot.ai";
const SUBTITLE = "UMAP (n_neighbors=15) · synthetic single-cell RNA-seq embedding";

export default function Chart() {
  return (
    <ChartContainer
      width={width}
      height={height}
      margin={MARGIN}
      sx={{ "& .MuiChartsAxis-line, & .MuiChartsAxis-tick": { display: "none" } }}
      series={CLUSTERS.map((cluster, i) => ({
        type: "scatter",
        id: cluster.label,
        label: cluster.label,
        data: clusterData[i],
        color: hexToRgba(t.palette[i], alphaForCluster(cluster)),
        markerSize: 5,
      }))}
      xAxis={[
        {
          id: "umap1",
          scaleType: "linear",
          min: X_MIN,
          max: X_MAX,
          disableTicks: true,
          disableLine: true,
          tickLabelStyle: { display: "none" },
          label: "UMAP dimension 1",
          labelStyle: { fontSize: 15, fill: t.inkSoft },
        },
      ]}
      yAxis={[
        {
          id: "umap2",
          scaleType: "linear",
          min: Y_MIN,
          max: Y_MAX,
          disableTicks: true,
          disableLine: true,
          tickLabelStyle: { display: "none" },
          label: "UMAP dimension 2",
          labelStyle: { fontSize: 15, fill: t.inkSoft },
        },
      ]}
    >
      <ScatterPlot skipAnimation />
      <CentroidLabels />
      <ChartsXAxis axisId="umap1" />
      <ChartsYAxis axisId="umap2" />
      <ChartsLegend
        position={{ vertical: "middle", horizontal: "right" }}
        direction="column"
        slotProps={{
          legend: {
            itemMarkWidth: 12,
            itemMarkHeight: 12,
            markGap: 8,
            itemGap: 18,
            labelStyle: { fontSize: 14, fill: t.ink },
          },
        }}
      />
      <text x={width / 2} y={46} textAnchor="middle" fontSize={28} fontWeight={600} fill={t.ink}>
        {TITLE}
      </text>
      <text x={width / 2} y={82} textAnchor="middle" fontSize={15} fill={t.inkSoft}>
        {SUBTITLE}
      </text>
    </ChartContainer>
  );
}
Runnable source as JSON, for any HTTP client: https://api.anyplot.ai/specs/scatter-embedding/muix/code. Any spec id and library id listed in llms-full.txt fit the same URL shape; every URL below is complete and callable.
{
  "spec_id": "scatter-embedding",
  "language": "javascript",
  "library": "muix",
  "page": "https://anyplot.ai/scatter-embedding/javascript/muix",
  "hub": "https://anyplot.ai/scatter-embedding",
  "code_json": "https://api.anyplot.ai/specs/scatter-embedding/muix/code",
  "spec_json": "https://api.anyplot.ai/specs/scatter-embedding",
  "render_light_png": "https://storage.googleapis.com/anyplot-images/plots/scatter-embedding/javascript/muix/plot-light.png",
  "render_dark_png": "https://storage.googleapis.com/anyplot-images/plots/scatter-embedding/javascript/muix/plot-dark.png",
  "interactive_light_html": "https://storage.googleapis.com/anyplot-images/plots/scatter-embedding/javascript/muix/plot-light.html",
  "interactive_dark_html": "https://storage.googleapis.com/anyplot-images/plots/scatter-embedding/javascript/muix/plot-dark.html",
  "quality_score": 90.0,
  "license": "MIT",
  "guide": "https://anyplot.ai/llms.txt"
}
Part of t-SNE and UMAP Embedding Visualization on anyplot.ai.