The same plot in 14 other libraries — JavaScript: Chart.js, D3.js, Highcharts, MUI X Charts; Python: Altair, Bokeh, lets-plot, Matplotlib, Plotly, plotnine, Pygal, Seaborn; R: ggplot2; Julia: Makie.jl. Compare all 15 side by side: Lag Plot for Time Series Autocorrelation Diagnosis in Python, R, Julia and JavaScript.
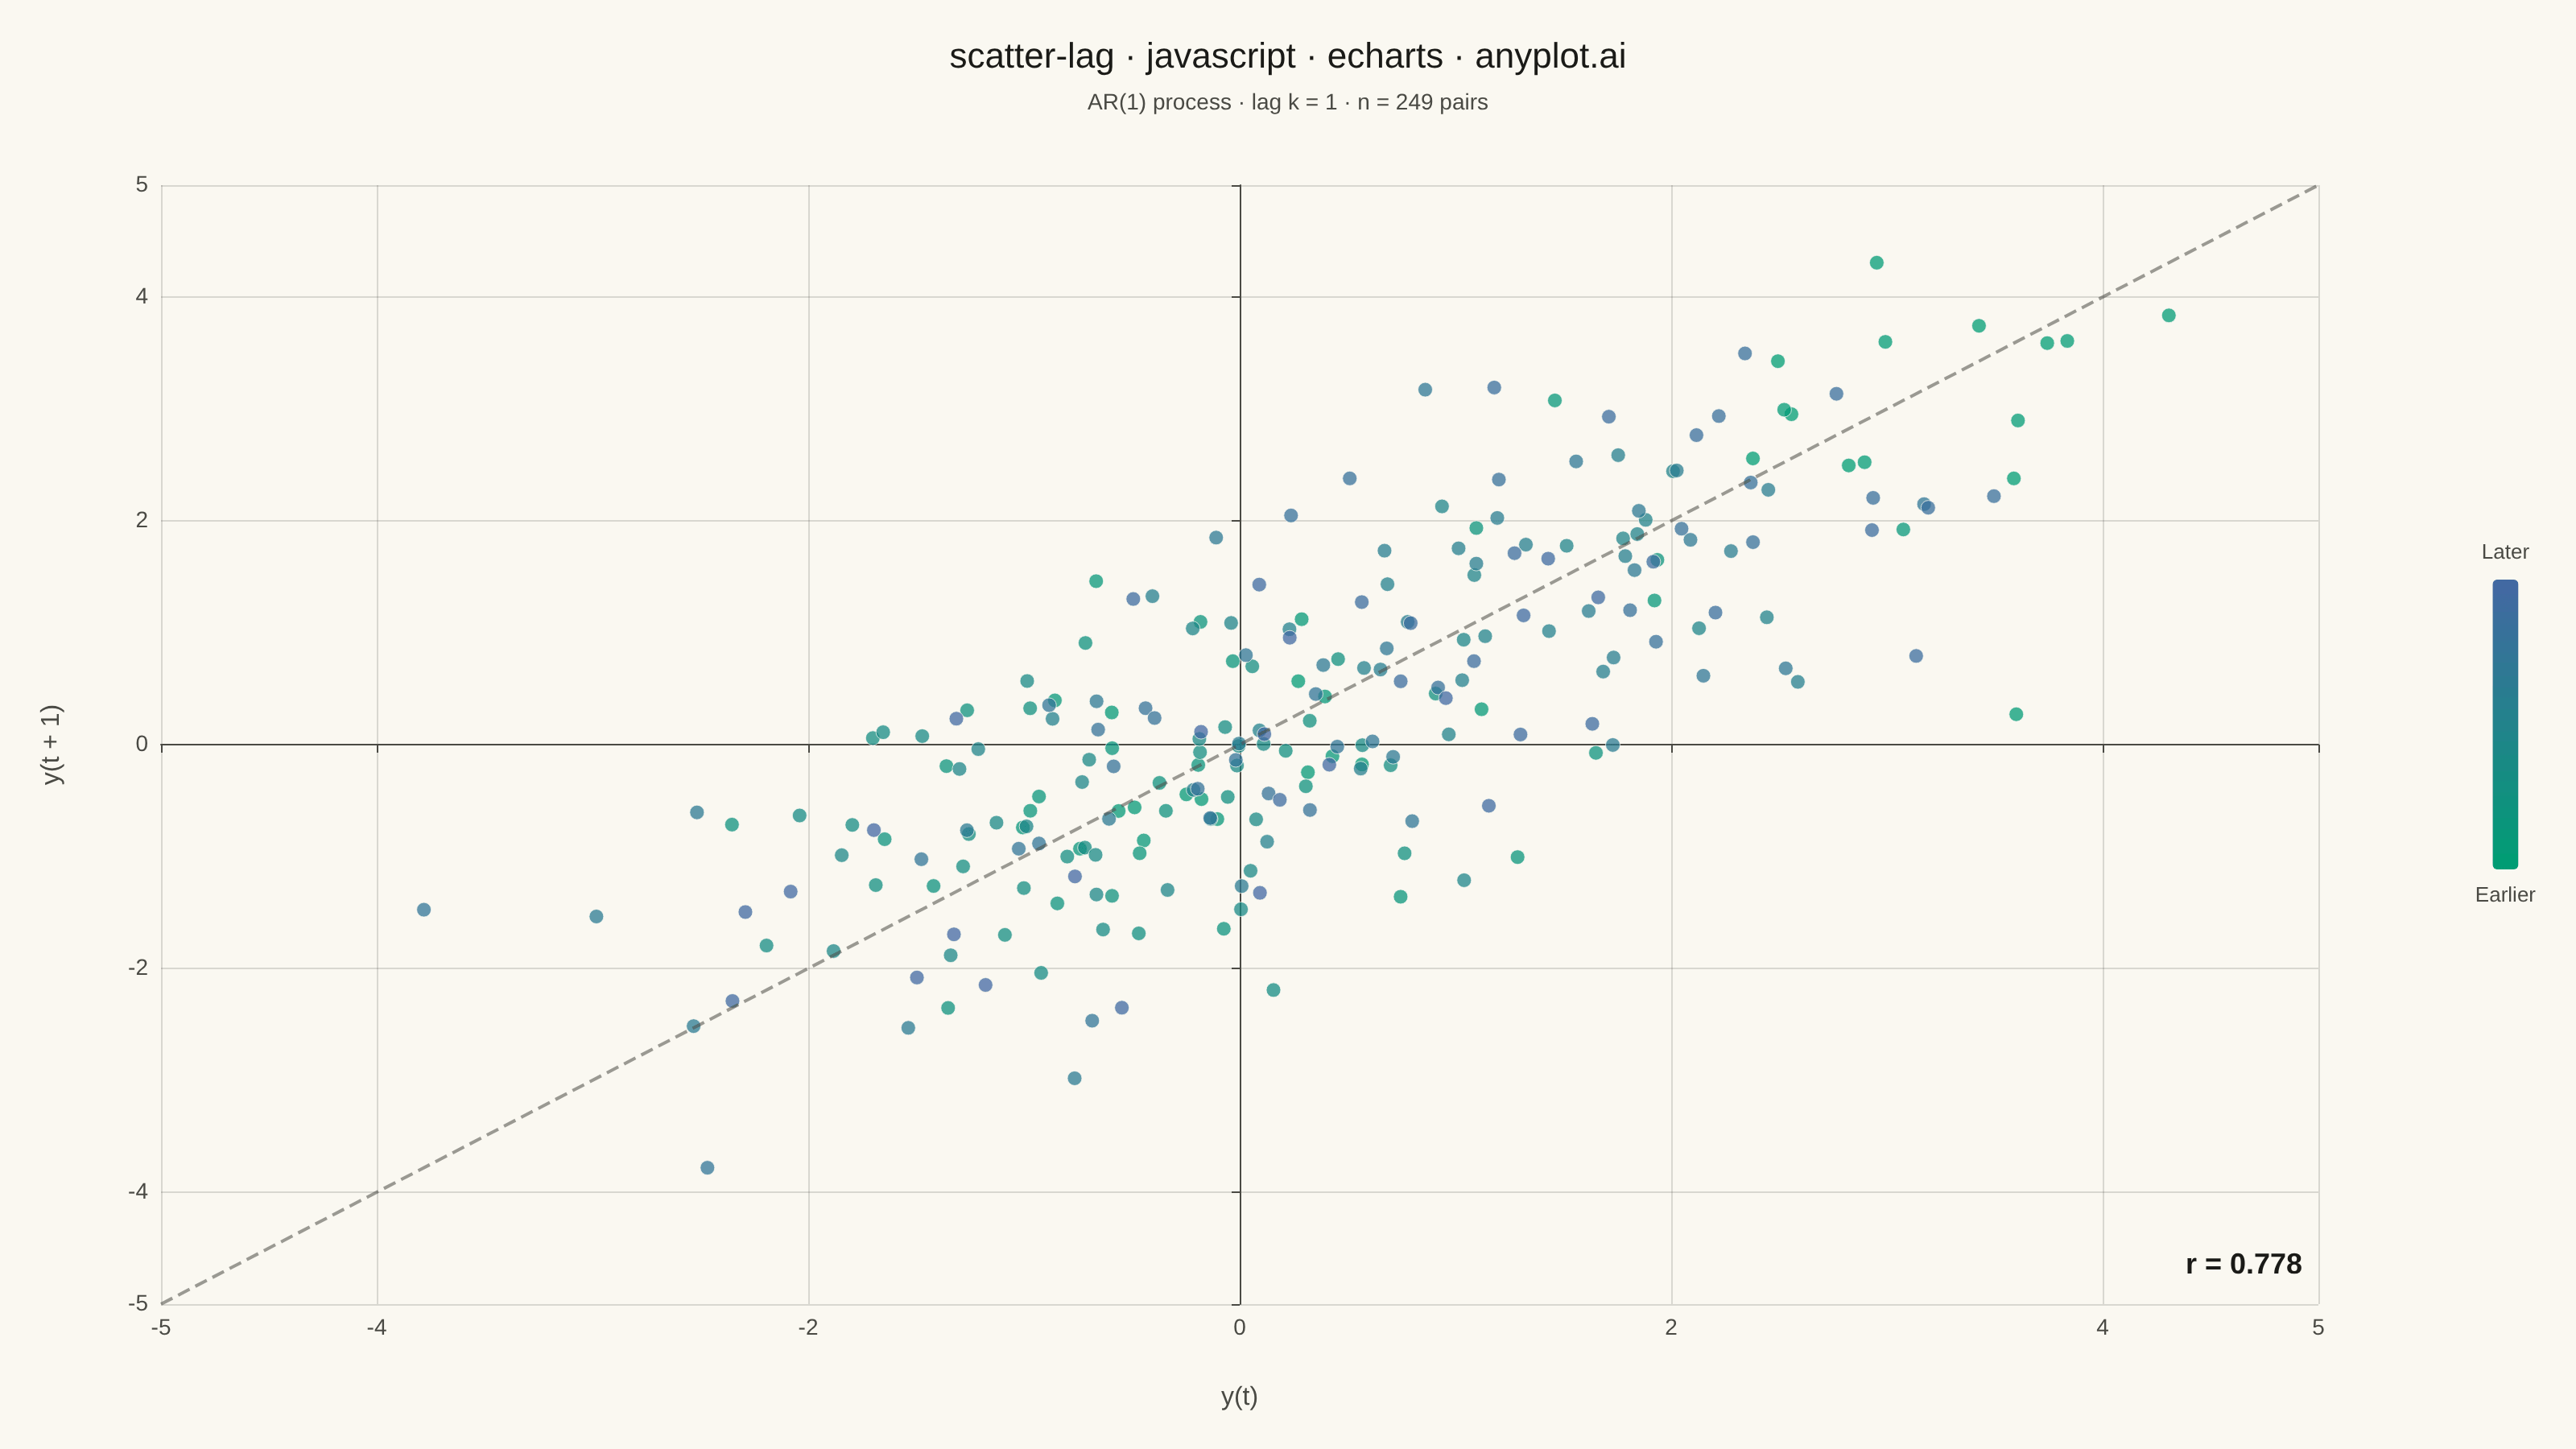
A lag plot is a scatter plot of a time series against a lagged version of itself, plotting y(t) on the x-axis versus y(t+k) on the y-axis for a given lag order k. If the data is purely random, points scatter uniformly with no visible structure; if autocorrelation is present, distinctive patterns emerge — linear clusters for autoregressive processes, elliptical shapes for seasonal data. This provides a quick visual diagnostic for time series dependence, complementing numerical tools like ACF/PACF.
// anyplot.ai
// scatter-lag: Lag Plot for Time Series Autocorrelation Diagnosis
// Library: echarts 5.5.1 | JavaScript 22.22.3
// Quality: 90/100 | Created: 2026-06-24

const t = window.ANYPLOT_TOKENS;

// --- Data: synthetic AR(1) process (deterministic LCG + Box-Muller) ---
let lcgState = 42 >>> 0;
const lcg = () => { lcgState = (lcgState * 1664525 + 1013904223) >>> 0; return lcgState / 0x100000000; };
const randn = () => Math.sqrt(-2 * Math.log(Math.max(lcg(), 1e-10))) * Math.cos(2 * Math.PI * lcg());

const phi = 0.82;
const n = 250;
const ts = [randn() * 2];
for (let i = 1; i < n; i++) ts.push(phi * ts[i - 1] + randn());

// Lag-1 pairs: x = y(t), y-axis = y(t+1)
const lag = 1;
const xVals = ts.slice(0, n - lag);
const yVals = ts.slice(lag);
const m = xVals.length; // 249

// Pearson correlation coefficient
const mX = xVals.reduce((a, b) => a + b, 0) / m;
const mY = yVals.reduce((a, b) => a + b, 0) / m;
let num = 0, dX = 0, dY = 0;
for (let i = 0; i < m; i++) {
    const dx = xVals[i] - mX, dy = yVals[i] - mY;
    num += dx * dy; dX += dx * dx; dY += dy * dy;
}
const r = num / Math.sqrt(dX * dY);

const allVals = xVals.concat(yVals);
const rawMin = Math.min(...allVals);
const rawMax = Math.max(...allVals);
const pad = (rawMax - rawMin) * 0.05;
// Round to clean integers so ECharts doesn't display raw float ticks at the axis edges
const minV = Math.floor(rawMin - pad);
const maxV = Math.ceil(rawMax + pad);

// Third dimension drives visualMap color (time index → temporal structure)
const scatterData = xVals.map((xi, i) => [xi, yVals[i], i]);

// --- Init ---
const chart = echarts.init(document.getElementById("container"));

// --- Option ---
chart.setOption({
    animation: false,
    backgroundColor: "transparent",
    title: {
        text: "scatter-lag · javascript · echarts · anyplot.ai",
        subtext: "AR(1) process · lag k = 1 · n = " + m + " pairs",
        left: "center",
        top: 20,
        textStyle: { color: t.ink, fontSize: 22, fontWeight: "normal" },
        subtextStyle: { color: t.inkSoft, fontSize: 14 }
    },
    grid: { left: 100, right: 160, top: 115, bottom: 90 },
    xAxis: {
        type: "value",
        name: "y(t)",
        nameLocation: "middle",
        nameGap: 50,
        nameTextStyle: { color: t.inkSoft, fontSize: 16 },
        axisLabel: { color: t.inkSoft, fontSize: 14 },
        axisLine: { show: true, lineStyle: { color: t.inkSoft } },
        splitLine: { lineStyle: { color: t.grid } },
        min: minV,
        max: maxV
    },
    yAxis: {
        type: "value",
        name: "y(t + 1)",
        nameLocation: "middle",
        nameGap: 60,
        nameTextStyle: { color: t.inkSoft, fontSize: 16 },
        axisLabel: { color: t.inkSoft, fontSize: 14 },
        axisLine: { show: true, lineStyle: { color: t.inkSoft } },
        splitLine: { lineStyle: { color: t.grid } },
        min: minV,
        max: maxV
    },
    visualMap: {
        type: "continuous",
        min: 0,
        max: m - 1,
        dimension: 2,
        inRange: { color: t.seq },
        show: true,
        right: 20,
        top: "center",
        orient: "vertical",
        itemHeight: 180,
        itemWidth: 16,
        text: ["Later", "Earlier"],
        textStyle: { color: t.inkSoft, fontSize: 13 }
    },
    series: [
        {
            type: "line",
            data: [[minV, minV], [maxV, maxV]],
            symbol: "none",
            silent: true,
            lineStyle: { color: t.inkSoft, type: "dashed", opacity: 0.55, width: 2 },
            emphasis: { disabled: true }
        },
        {
            type: "scatter",
            data: scatterData,
            symbolSize: 9,
            itemStyle: {
                opacity: 0.75,
                borderColor: t.pageBg,
                borderWidth: 0.5
            }
        }
    ],
    graphic: [
        {
            type: "text",
            right: 170,
            bottom: 105,
            style: {
                text: "r = " + r.toFixed(3),
                fill: t.ink,
                fontSize: 18,
                fontWeight: "bold"
            }
        }
    ]
});
Runnable source as JSON, for any HTTP client: https://api.anyplot.ai/specs/scatter-lag/echarts/code. Any spec id and library id listed in llms-full.txt fit the same URL shape; every URL below is complete and callable.
{
  "spec_id": "scatter-lag",
  "language": "javascript",
  "library": "echarts",
  "page": "https://anyplot.ai/scatter-lag/javascript/echarts",
  "hub": "https://anyplot.ai/scatter-lag",
  "code_json": "https://api.anyplot.ai/specs/scatter-lag/echarts/code",
  "spec_json": "https://api.anyplot.ai/specs/scatter-lag",
  "render_light_png": "https://storage.googleapis.com/anyplot-images/plots/scatter-lag/javascript/echarts/plot-light.png",
  "render_dark_png": "https://storage.googleapis.com/anyplot-images/plots/scatter-lag/javascript/echarts/plot-dark.png",
  "interactive_light_html": "https://storage.googleapis.com/anyplot-images/plots/scatter-lag/javascript/echarts/plot-light.html",
  "interactive_dark_html": "https://storage.googleapis.com/anyplot-images/plots/scatter-lag/javascript/echarts/plot-dark.html",
  "quality_score": 90.0,
  "license": "MIT",
  "guide": "https://anyplot.ai/llms.txt"
}
Part of Lag Plot for Time Series Autocorrelation Diagnosis on anyplot.ai.