The same plot in 14 other libraries — Python: Altair, Bokeh, lets-plot, Matplotlib, Plotly, plotnine, Pygal, Seaborn; R: ggplot2; JavaScript: Chart.js, D3.js, Apache ECharts, Highcharts, MUI X Charts. Compare all 15 side by side: Skew-T Log-P Atmospheric Diagram in Python, R, Julia and JavaScript.
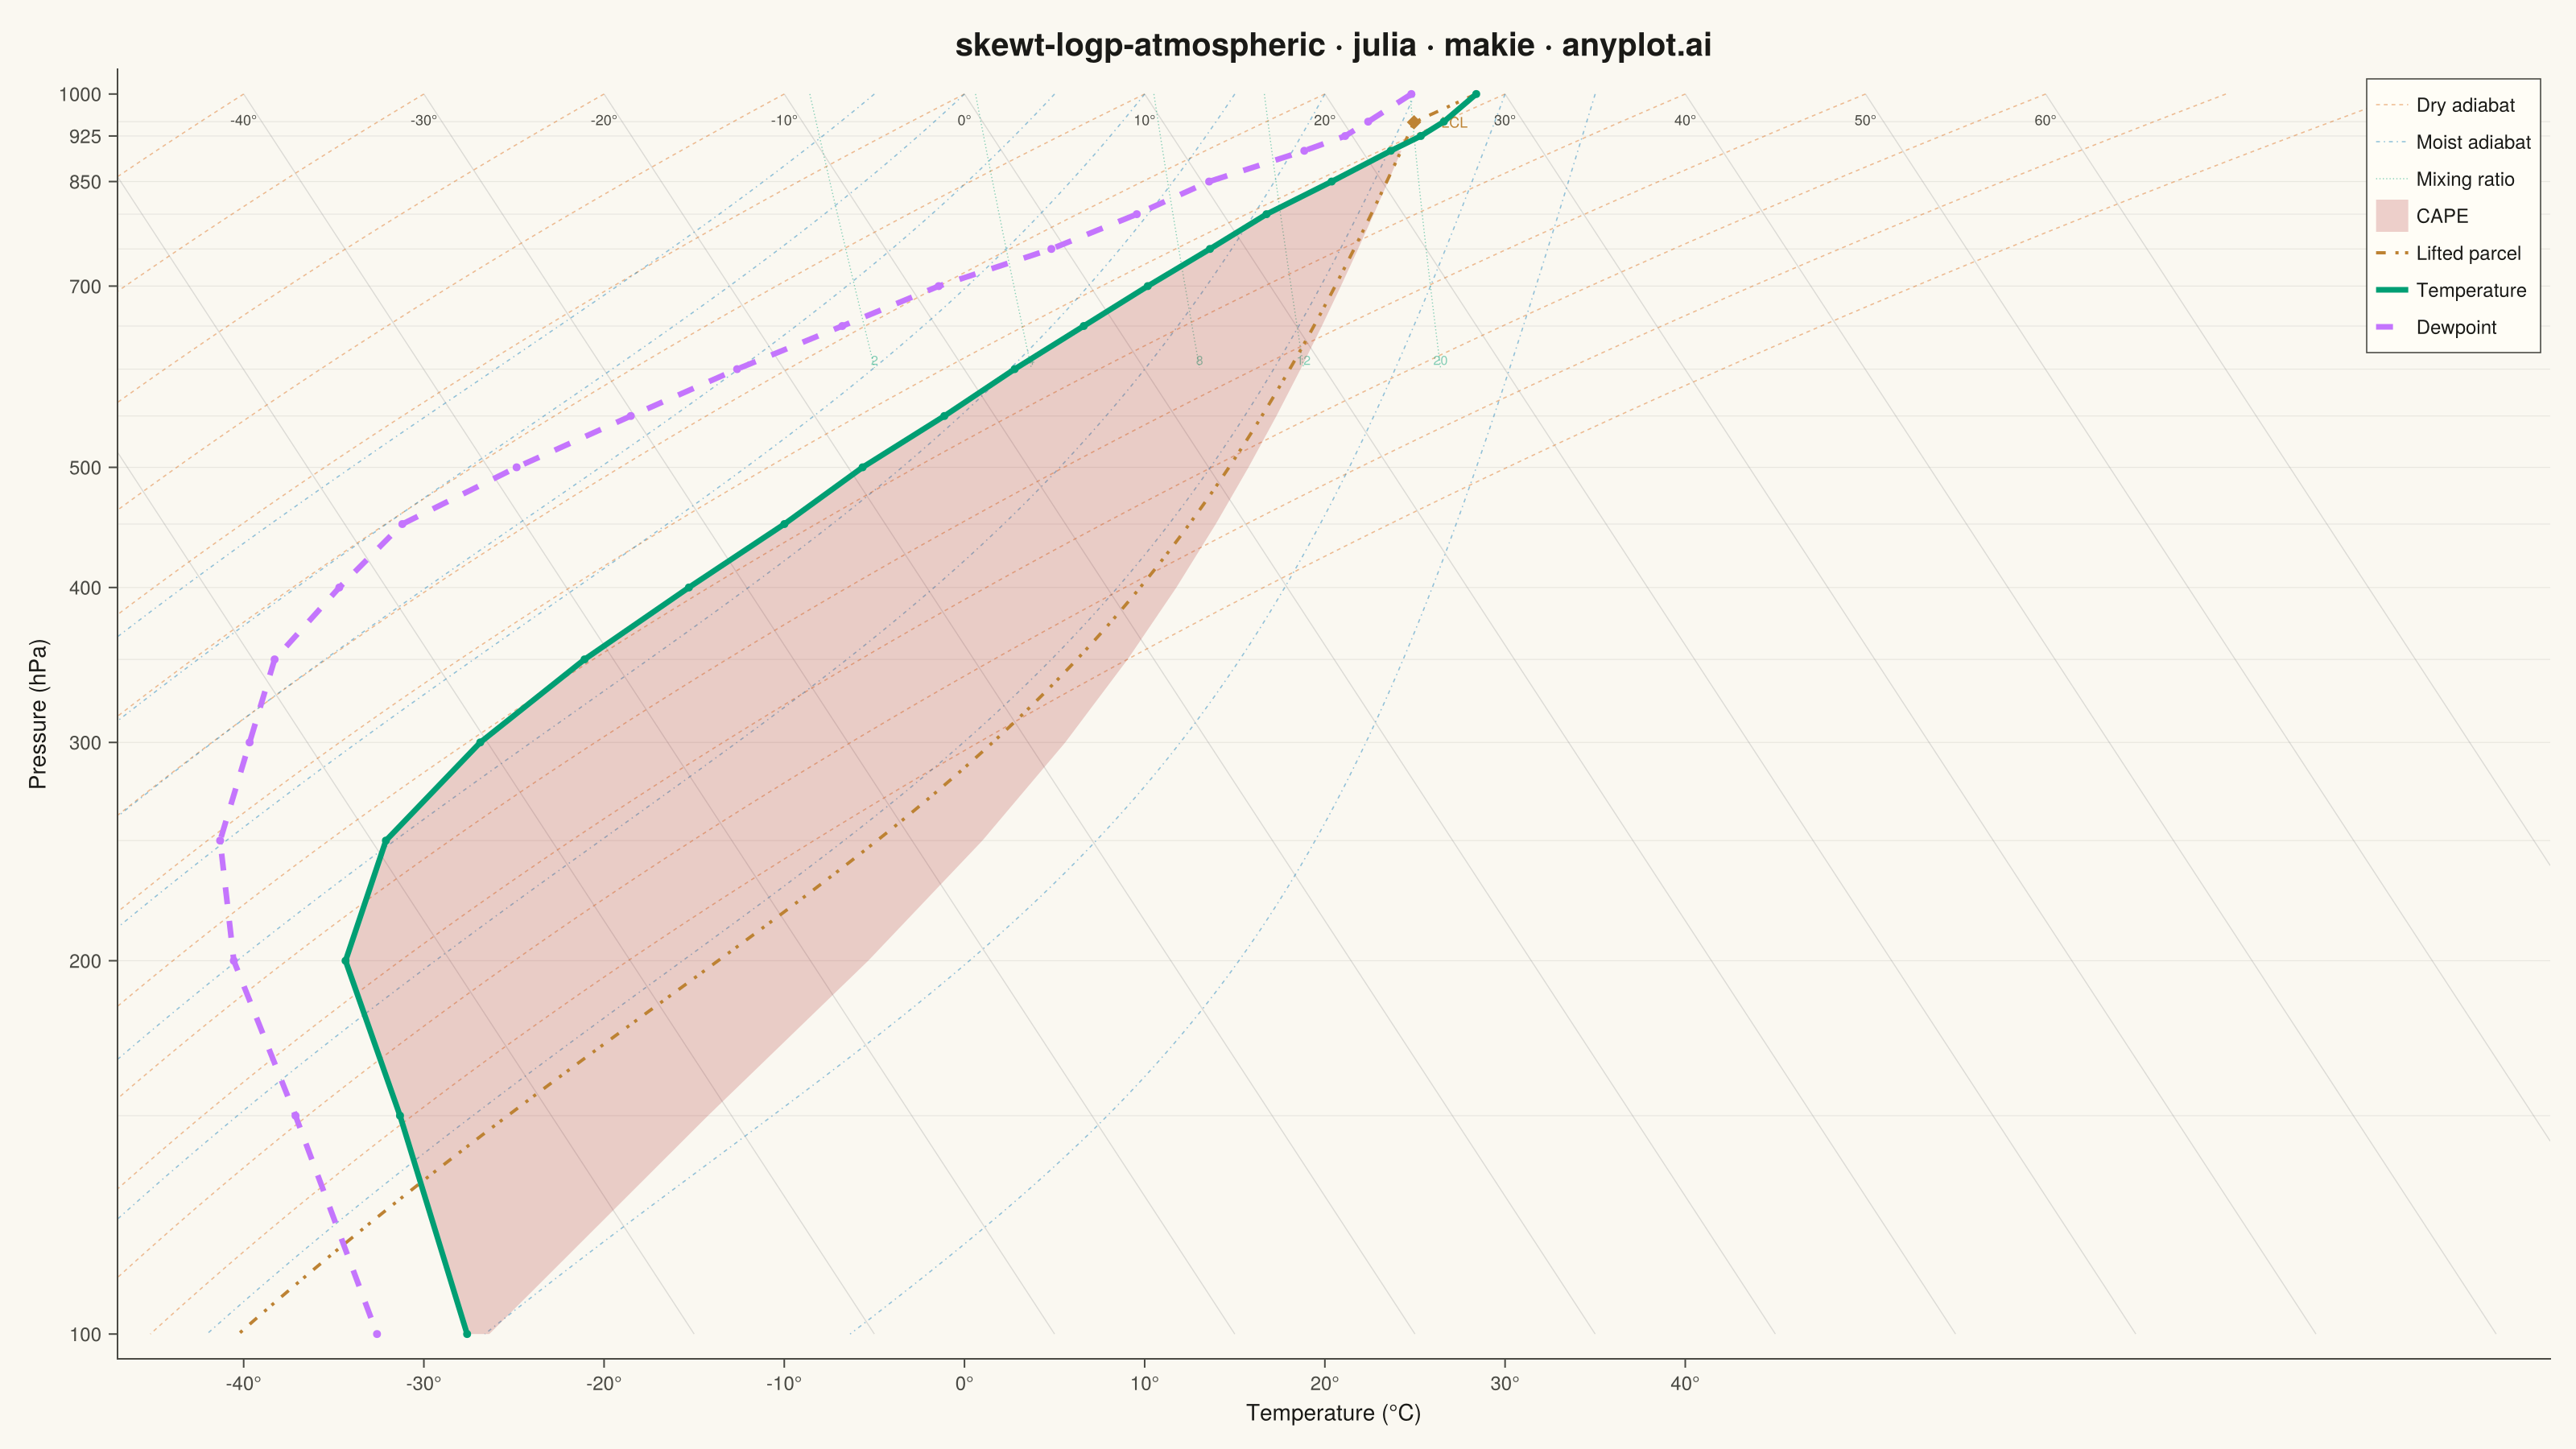
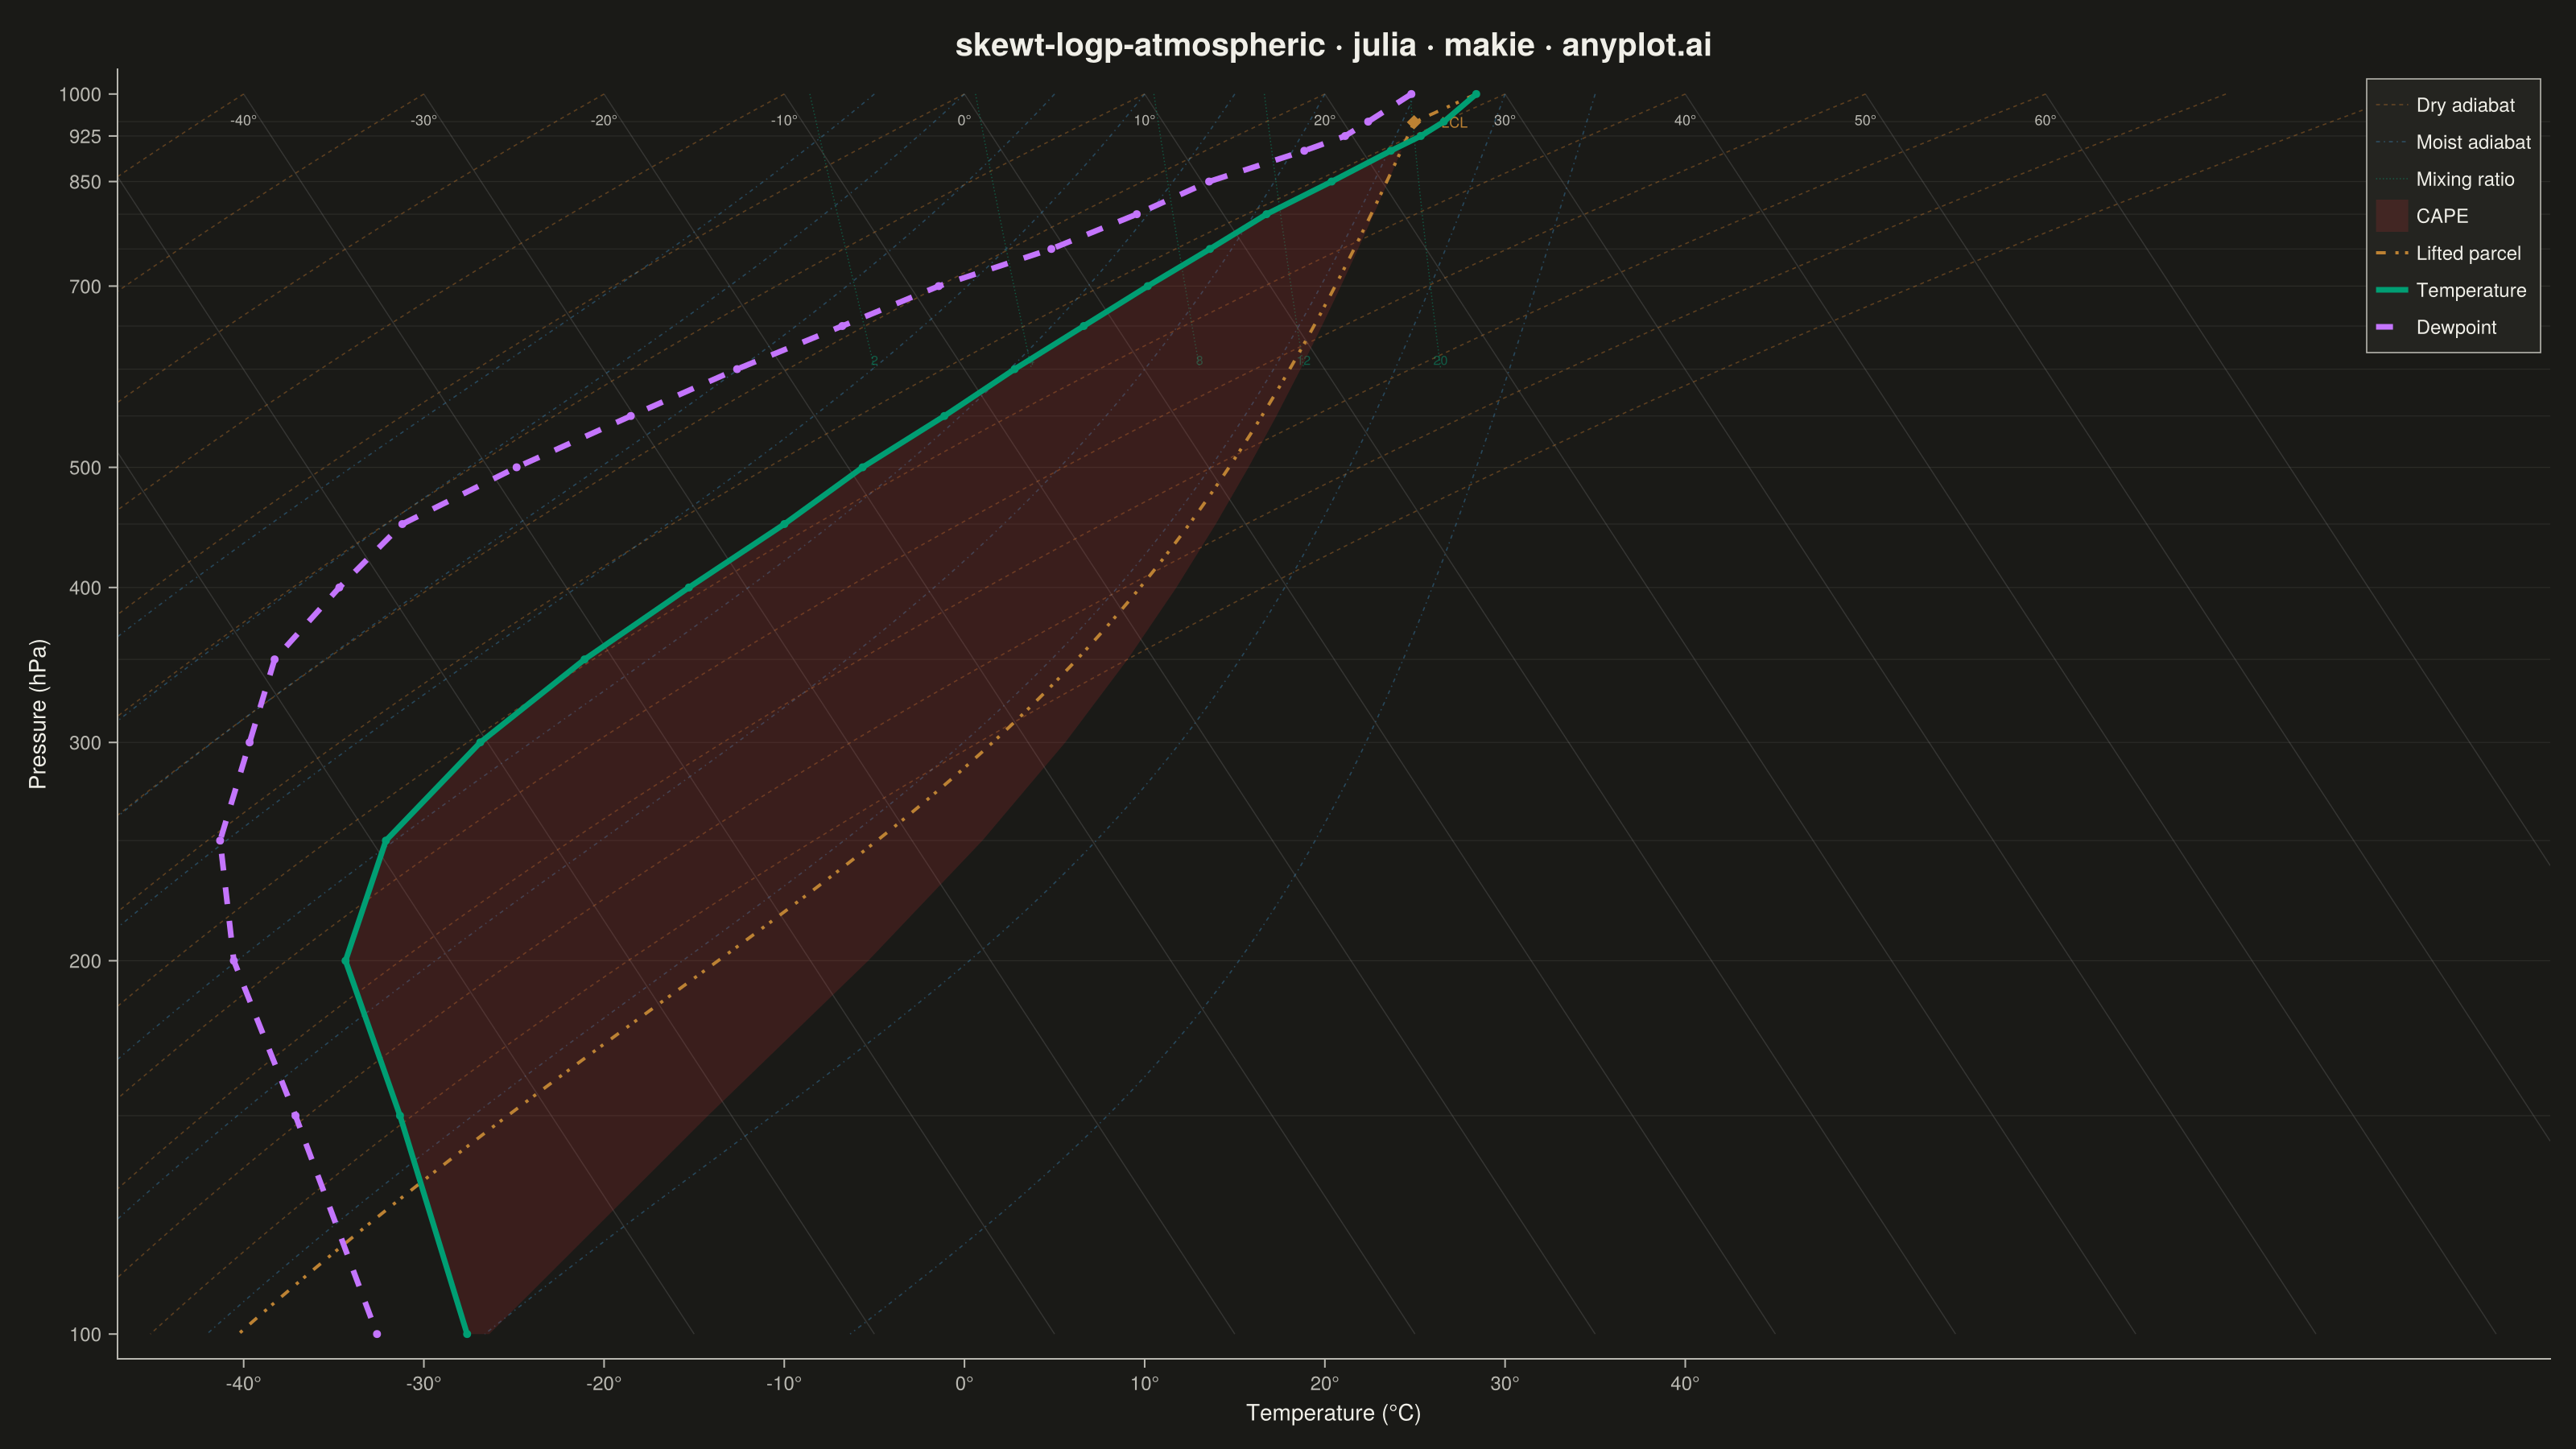
A Skew-T Log-P diagram is a specialized thermodynamic chart used in meteorology to display vertical atmospheric profiles. It features a logarithmic pressure axis (inverted, with surface at bottom) and temperature isotherms skewed 45 degrees to the right, allowing simultaneous visualization of temperature, dewpoint, and derived stability parameters. This diagram is essential for analyzing atmospheric soundings and assessing weather conditions.
# anyplot.ai
# skewt-logp-atmospheric: Skew-T Log-P Atmospheric Diagram
# Library: makie 0.22.10 | Julia 1.11.9
# Quality: 85/100 | Created: 2026-05-22

using CairoMakie
using Colors
using Random

Random.seed!(42)

const THEME       = get(ENV, "ANYPLOT_THEME", "light")
const PAGE_BG     = THEME == "light" ? colorant"#FAF8F1" : colorant"#1A1A17"
const ELEVATED_BG = THEME == "light" ? colorant"#FFFDF6" : colorant"#242420"
const INK         = THEME == "light" ? colorant"#1A1A17" : colorant"#F0EFE8"
const INK_SOFT    = THEME == "light" ? colorant"#4A4A44" : colorant"#B8B7B0"
const IMPRINT   = [
    colorant"#009E73",
    colorant"#C475FD",
    colorant"#4467A3",
    colorant"#BD8233",
    colorant"#AE3030",
    colorant"#2ABCCD",
    colorant"#954477",
]

# Skew-T parameters and thermodynamic constants
const SKEW     = 45.0
const Lv_CONST = 2.501e6
const Rd_CONST = 287.0
const Rv_CONST = 461.5
const Cp_CONST = 1005.0

# Coordinate helpers
skew_x(T_C, P_hPa) = T_C + SKEW * log10(1000.0 / P_hPa)
y_p(P_hPa)         = log10(P_hPa)

# Saturation vapor pressure via Bolton (1980), hPa
sat_es(T_C) = 6.112 * exp(17.67 * T_C / (T_C + 243.5))

# Saturation mixing ratio, g/kg
ws_sat(T_C, P_hPa) = 622.0 * sat_es(T_C) / (P_hPa - sat_es(T_C))

# Log-spaced pressure array from 1000 → 100 hPa
const P_FINE = collect(exp10.(LinRange(log10(1000.0), log10(100.0), 300)))

# Tropical convective sounding (standard atmosphere with instability)
const P_OBS = [1000.0, 950.0, 925.0, 900.0, 850.0, 800.0, 750.0, 700.0,
               650.0, 600.0, 550.0, 500.0, 450.0, 400.0, 350.0, 300.0,
               250.0, 200.0, 150.0, 100.0]

const T_OBS = [28.4,  25.6,  23.8,  21.6,  17.2,  12.4,   8.0,   3.2,
               -1.8,  -7.2, -12.8, -19.2, -25.6, -33.2, -41.6, -50.4,
               -59.2, -65.8, -68.4, -72.6]

const TD_OBS = [24.8,  21.4,  19.6,  16.8,  10.4,   5.2,  -0.8,  -8.4,
               -15.2, -22.6, -30.2, -38.4, -46.8, -52.6, -58.8, -63.2,
               -68.4, -72.0, -74.2, -77.6]

# Reference line helpers

function isotherm_line(T0, p_arr)
    return [skew_x(T0, P) for P in p_arr], y_p.(p_arr)
end

function dry_adiabat_line(theta_K, p_arr)
    Rcp = Rd_CONST / Cp_CONST
    return [skew_x(theta_K * (P / 1000.0)^Rcp - 273.15, P) for P in p_arr], y_p.(p_arr)
end

function mixing_ratio_line(ws_gkg, p_arr)
    xs = map(p_arr) do P
        es_t = ws_gkg * P / (622.0 + ws_gkg)
        es_t <= 0.0 && return NaN
        a = log(es_t / 6.112)
        skew_x(243.5 * a / (17.67 - a), P)
    end
    return xs, y_p.(p_arr)
end

function moist_adiabat_line(T0_C, P0_hPa, p_arr)
    xs  = Float64[]
    ys  = Float64[]
    T_K = T0_C + 273.15
    for i in 1:length(p_arr)
        P = p_arr[i]
        P > P0_hPa + 0.5 && continue
        push!(xs, skew_x(T_K - 273.15, P))
        push!(ys, y_p(P))
        if i < length(p_arr)
            ws    = max(0.0, ws_sat(T_K - 273.15, P) / 1000.0)
            dT_dp = (Rd_CONST * T_K + Lv_CONST * ws) /
                    (P * (Cp_CONST + Lv_CONST^2 * ws / (Rv_CONST * T_K^2)))
            T_K   = T_K + dT_dp * (p_arr[i + 1] - P)
        end
    end
    return xs, ys
end

# Compute lifted parcel temperatures (Bolton 1980) and return LCL metadata.
# p_arr must be sorted descending (1000 → 100 hPa).
function lifted_parcel_temps(T_surf_C, Td_surf_C, P_surf_hPa, p_arr)
    T_K  = T_surf_C + 273.15
    Td_K = Td_surf_C + 273.15
    Rcp  = Rd_CONST / Cp_CONST

    # LCL temperature and pressure (Bolton 1980)
    T_LCL_K = 56.0 + 1.0 / (1.0 / (Td_K - 56.0) + log(T_K / Td_K) / 800.0)
    P_LCL   = P_surf_hPa * (T_LCL_K / T_K)^(Cp_CONST / Rd_CONST)

    T_moist = T_LCL_K
    prev_P  = P_LCL
    T_out   = Float64[]

    for P in p_arr
        if P >= P_LCL
            # Dry adiabatic lifting
            push!(T_out, T_K * (P / P_surf_hPa)^Rcp - 273.15)
        else
            # Moist adiabatic lifting — one Euler step from prev level
            ws      = max(0.0, ws_sat(T_moist - 273.15, prev_P) / 1000.0)
            dT_dp   = (Rd_CONST * T_moist + Lv_CONST * ws) /
                      (prev_P * (Cp_CONST + Lv_CONST^2 * ws / (Rv_CONST * T_moist^2)))
            T_moist = T_moist + dT_dp * (P - prev_P)
            prev_P  = P
            push!(T_out, T_moist - 273.15)
        end
    end
    return T_out, T_LCL_K - 273.15, P_LCL
end

# Parcel path at both resolutions
parcel_Ts_obs, T_LCL_C, P_LCL_hPa = lifted_parcel_temps(
    T_OBS[1], TD_OBS[1], P_OBS[1], P_OBS)
parcel_Ts_fine, _, _ = lifted_parcel_temps(
    T_OBS[1], TD_OBS[1], P_OBS[1], P_FINE)

# Figure
fig = Figure(
    size            = (1600, 900),
    fontsize        = 14,
    backgroundcolor = PAGE_BG,
)

ax = Axis(
    fig[1, 1];
    title              = "skewt-logp-atmospheric · julia · makie · anyplot.ai",
    titlesize          = 20,
    titlecolor         = INK,
    xlabel             = "Temperature (°C)",
    ylabel             = "Pressure (hPa)",
    xlabelsize         = 14,
    ylabelsize         = 14,
    xticklabelsize     = 12,
    yticklabelsize     = 12,
    xlabelcolor        = INK,
    ylabelcolor        = INK,
    xticklabelcolor    = INK_SOFT,
    yticklabelcolor    = INK_SOFT,
    xtickcolor         = INK_SOFT,
    ytickcolor         = INK_SOFT,
    backgroundcolor    = PAGE_BG,
    leftspinecolor     = INK_SOFT,
    bottomspinecolor   = INK_SOFT,
    topspinevisible    = false,
    rightspinevisible  = false,
    xgridvisible       = false,
    ygridvisible       = false,
    yreversed          = true,
)

# Y-axis: log10(P) with 1000 hPa at bottom, 100 hPa at top
ylims!(ax, y_p(100.0) - 0.02, y_p(1000.0) + 0.02)
const P_YTICKS = [1000.0, 925.0, 850.0, 700.0, 500.0, 400.0, 300.0, 200.0, 100.0]
ax.yticks = (y_p.(P_YTICKS), string.(Int.(P_YTICKS)))

# X-axis: skewed temperature coordinate, ticks at surface temps
xlims!(ax, -47.0, 88.0)
const T_XTICKS = Float64[-40, -30, -20, -10, 0, 10, 20, 30, 40]
ax.xticks = (T_XTICKS, string.(Int.(T_XTICKS)) .* "°")

# Background isobars
isobar_col = RGBAf(INK.r, INK.g, INK.b, 0.08f0)
for P in [950.0, 925.0, 850.0, 800.0, 750.0, 700.0, 650.0, 600.0, 550.0,
          500.0, 450.0, 400.0, 350.0, 300.0, 250.0, 200.0, 150.0]
    hlines!(ax, y_p(P); color = isobar_col, linewidth = 0.6)
end

# Isotherms (every 10 °C)
iso_col = THEME == "light" ?
    RGBAf(0.55f0, 0.55f0, 0.55f0, 0.28f0) :
    RGBAf(0.62f0, 0.62f0, 0.62f0, 0.22f0)

for T0 in -60.0:10.0:60.0
    xs, ys = isotherm_line(T0, P_FINE)
    lines!(ax, xs, ys; color = iso_col, linewidth = 0.7)
    x_bot = skew_x(T0, 1000.0)
    if -47.0 <= x_bot <= 88.0
        text!(ax, x_bot, y_p(1000.0) - 0.014;
              text    = "$(Int(T0))°",
              fontsize = 9,
              color   = INK_SOFT,
              align   = (:center, :top))
    end
end

# Dry adiabats (potential temperature from -40 to 80 °C, every 10 °C)
dry_col = THEME == "light" ?
    RGBAf(0.84f0, 0.37f0, 0.0f0, 0.40f0) :
    RGBAf(0.90f0, 0.55f0, 0.20f0, 0.33f0)

for (i, theta_C) in enumerate(-40.0:10.0:80.0)
    xs, ys = dry_adiabat_line(theta_C + 273.15, P_FINE)
    lbl    = i == 1 ? "Dry adiabat" : nothing
    if isnothing(lbl)
        lines!(ax, xs, ys; color = dry_col, linewidth = 0.8, linestyle = :dash)
    else
        lines!(ax, xs, ys; color = dry_col, linewidth = 0.8, linestyle = :dash, label = lbl)
    end
end

# Moist adiabats (surface start temps -5 to 35 °C, every 5 °C)
moist_col = THEME == "light" ?
    RGBAf(0.0f0, 0.447f0, 0.698f0, 0.42f0) :
    RGBAf(0.25f0, 0.62f0, 0.87f0, 0.35f0)

for (i, T_start) in enumerate(-5.0:5.0:35.0)
    xs, ys = moist_adiabat_line(T_start, 1000.0, P_FINE)
    lbl    = i == 1 ? "Moist adiabat" : nothing
    if isnothing(lbl)
        lines!(ax, xs, ys; color = moist_col, linewidth = 0.8, linestyle = :dashdot)
    else
        lines!(ax, xs, ys; color = moist_col, linewidth = 0.8, linestyle = :dashdot, label = lbl)
    end
end

# Mixing ratio lines (g/kg), displayed only below 600 hPa
p_low   = P_FINE[P_FINE .>= 599.0]
mix_col = THEME == "light" ?
    RGBAf(0.0f0, 0.62f0, 0.45f0, 0.48f0) :
    RGBAf(0.0f0, 0.75f0, 0.55f0, 0.40f0)

for (i, ws_gkg) in enumerate([2.0, 4.0, 8.0, 12.0, 20.0])
    xs, ys = mixing_ratio_line(ws_gkg, p_low)
    valid  = .!isnan.(xs) .& isfinite.(xs)
    lbl    = i == 1 ? "Mixing ratio" : nothing
    if any(valid)
        if isnothing(lbl)
            lines!(ax, xs[valid], ys[valid]; color = mix_col, linewidth = 0.7, linestyle = :dot)
        else
            lines!(ax, xs[valid], ys[valid]; color = mix_col, linewidth = 0.7, linestyle = :dot, label = lbl)
        end
        # Label at top of visible section (600 hPa)
        x_top = xs[valid][end]
        y_top = ys[valid][end]
        if -47.0 <= x_top <= 88.0
            text!(ax, x_top, y_top;
                  text    = "$(Int(ws_gkg))",
                  fontsize = 8,
                  color   = mix_col,
                  align   = (:center, :bottom))
        end
    end
end

# CAPE region — poly! fills the closed polygon between parcel and environment.
# This uses Makie's native polygon primitive for efficient filled-area rendering.
cape_mask = parcel_Ts_obs .> T_OBS
if any(cape_mask)
    ci          = findall(cape_mask)
    env_xs_c    = [skew_x(T_OBS[i],        P_OBS[i]) for i in ci]
    par_xs_c    = [skew_x(parcel_Ts_obs[i], P_OBS[i]) for i in ci]
    ys_c        = y_p.(P_OBS[ci])
    cape_pts    = Point2f.(
        vcat(par_xs_c, reverse(env_xs_c)),
        vcat(ys_c,     reverse(ys_c)),
    )
    cape_fill = RGBAf(IMPRINT[5].r, IMPRINT[5].g, IMPRINT[5].b, 0.22f0)
    poly!(ax, cape_pts; color = cape_fill, strokewidth = 0, label = "CAPE")
end

# Lifted parcel trace (smooth, fine resolution)
parcel_xs_fine = [skew_x(T, P) for (T, P) in zip(parcel_Ts_fine, P_FINE)]
lines!(ax, parcel_xs_fine, y_p.(P_FINE);
       color = IMPRINT[4], linewidth = 2.0, linestyle = :dashdotdot,
       label = "Lifted parcel")

# LCL marker
lcl_x = skew_x(T_LCL_C, P_LCL_hPa)
lcl_y = y_p(P_LCL_hPa)
scatter!(ax, [lcl_x], [lcl_y];
         color = IMPRINT[4], markersize = 10, marker = :diamond, strokewidth = 0)
text!(ax, lcl_x + 1.5, lcl_y;
      text    = "LCL",
      fontsize = 9,
      color   = IMPRINT[4],
      align   = (:left, :center))

# Sounding profiles
T_xs   = [skew_x(T, P) for (T, P) in zip(T_OBS, P_OBS)]
TD_xs  = [skew_x(Td, P) for (Td, P) in zip(TD_OBS, P_OBS)]
obs_ys = y_p.(P_OBS)

lines!(ax, T_xs, obs_ys;
       color = IMPRINT[1], linewidth = 3.5, label = "Temperature")
scatter!(ax, T_xs, obs_ys;
         color = IMPRINT[1], markersize = 7, strokewidth = 0)

lines!(ax, TD_xs, obs_ys;
       color = IMPRINT[2], linewidth = 3.5, linestyle = :dash, label = "Dewpoint")
scatter!(ax, TD_xs, obs_ys;
         color = IMPRINT[2], markersize = 7, strokewidth = 0)

axislegend(ax;
    position        = :rt,
    backgroundcolor = ELEVATED_BG,
    labelcolor      = INK,
    framecolor      = INK_SOFT,
    framewidth      = 0.8,
    labelsize       = 12,
)

save("plot-$(THEME).png", fig; px_per_unit = 2)
Runnable source as JSON, for any HTTP client: https://api.anyplot.ai/specs/skewt-logp-atmospheric/makie/code. Any spec id and library id listed in llms-full.txt fit the same URL shape; every URL below is complete and callable.
{
  "spec_id": "skewt-logp-atmospheric",
  "language": "julia",
  "library": "makie",
  "page": "https://anyplot.ai/skewt-logp-atmospheric/julia/makie",
  "hub": "https://anyplot.ai/skewt-logp-atmospheric",
  "code_json": "https://api.anyplot.ai/specs/skewt-logp-atmospheric/makie/code",
  "spec_json": "https://api.anyplot.ai/specs/skewt-logp-atmospheric",
  "render_light_png": "https://storage.googleapis.com/anyplot-images/plots/skewt-logp-atmospheric/julia/makie/plot-light.png",
  "render_dark_png": "https://storage.googleapis.com/anyplot-images/plots/skewt-logp-atmospheric/julia/makie/plot-dark.png",
  "quality_score": 85.0,
  "license": "MIT",
  "guide": "https://anyplot.ai/llms.txt"
}
Part of Skew-T Log-P Atmospheric Diagram on anyplot.ai.