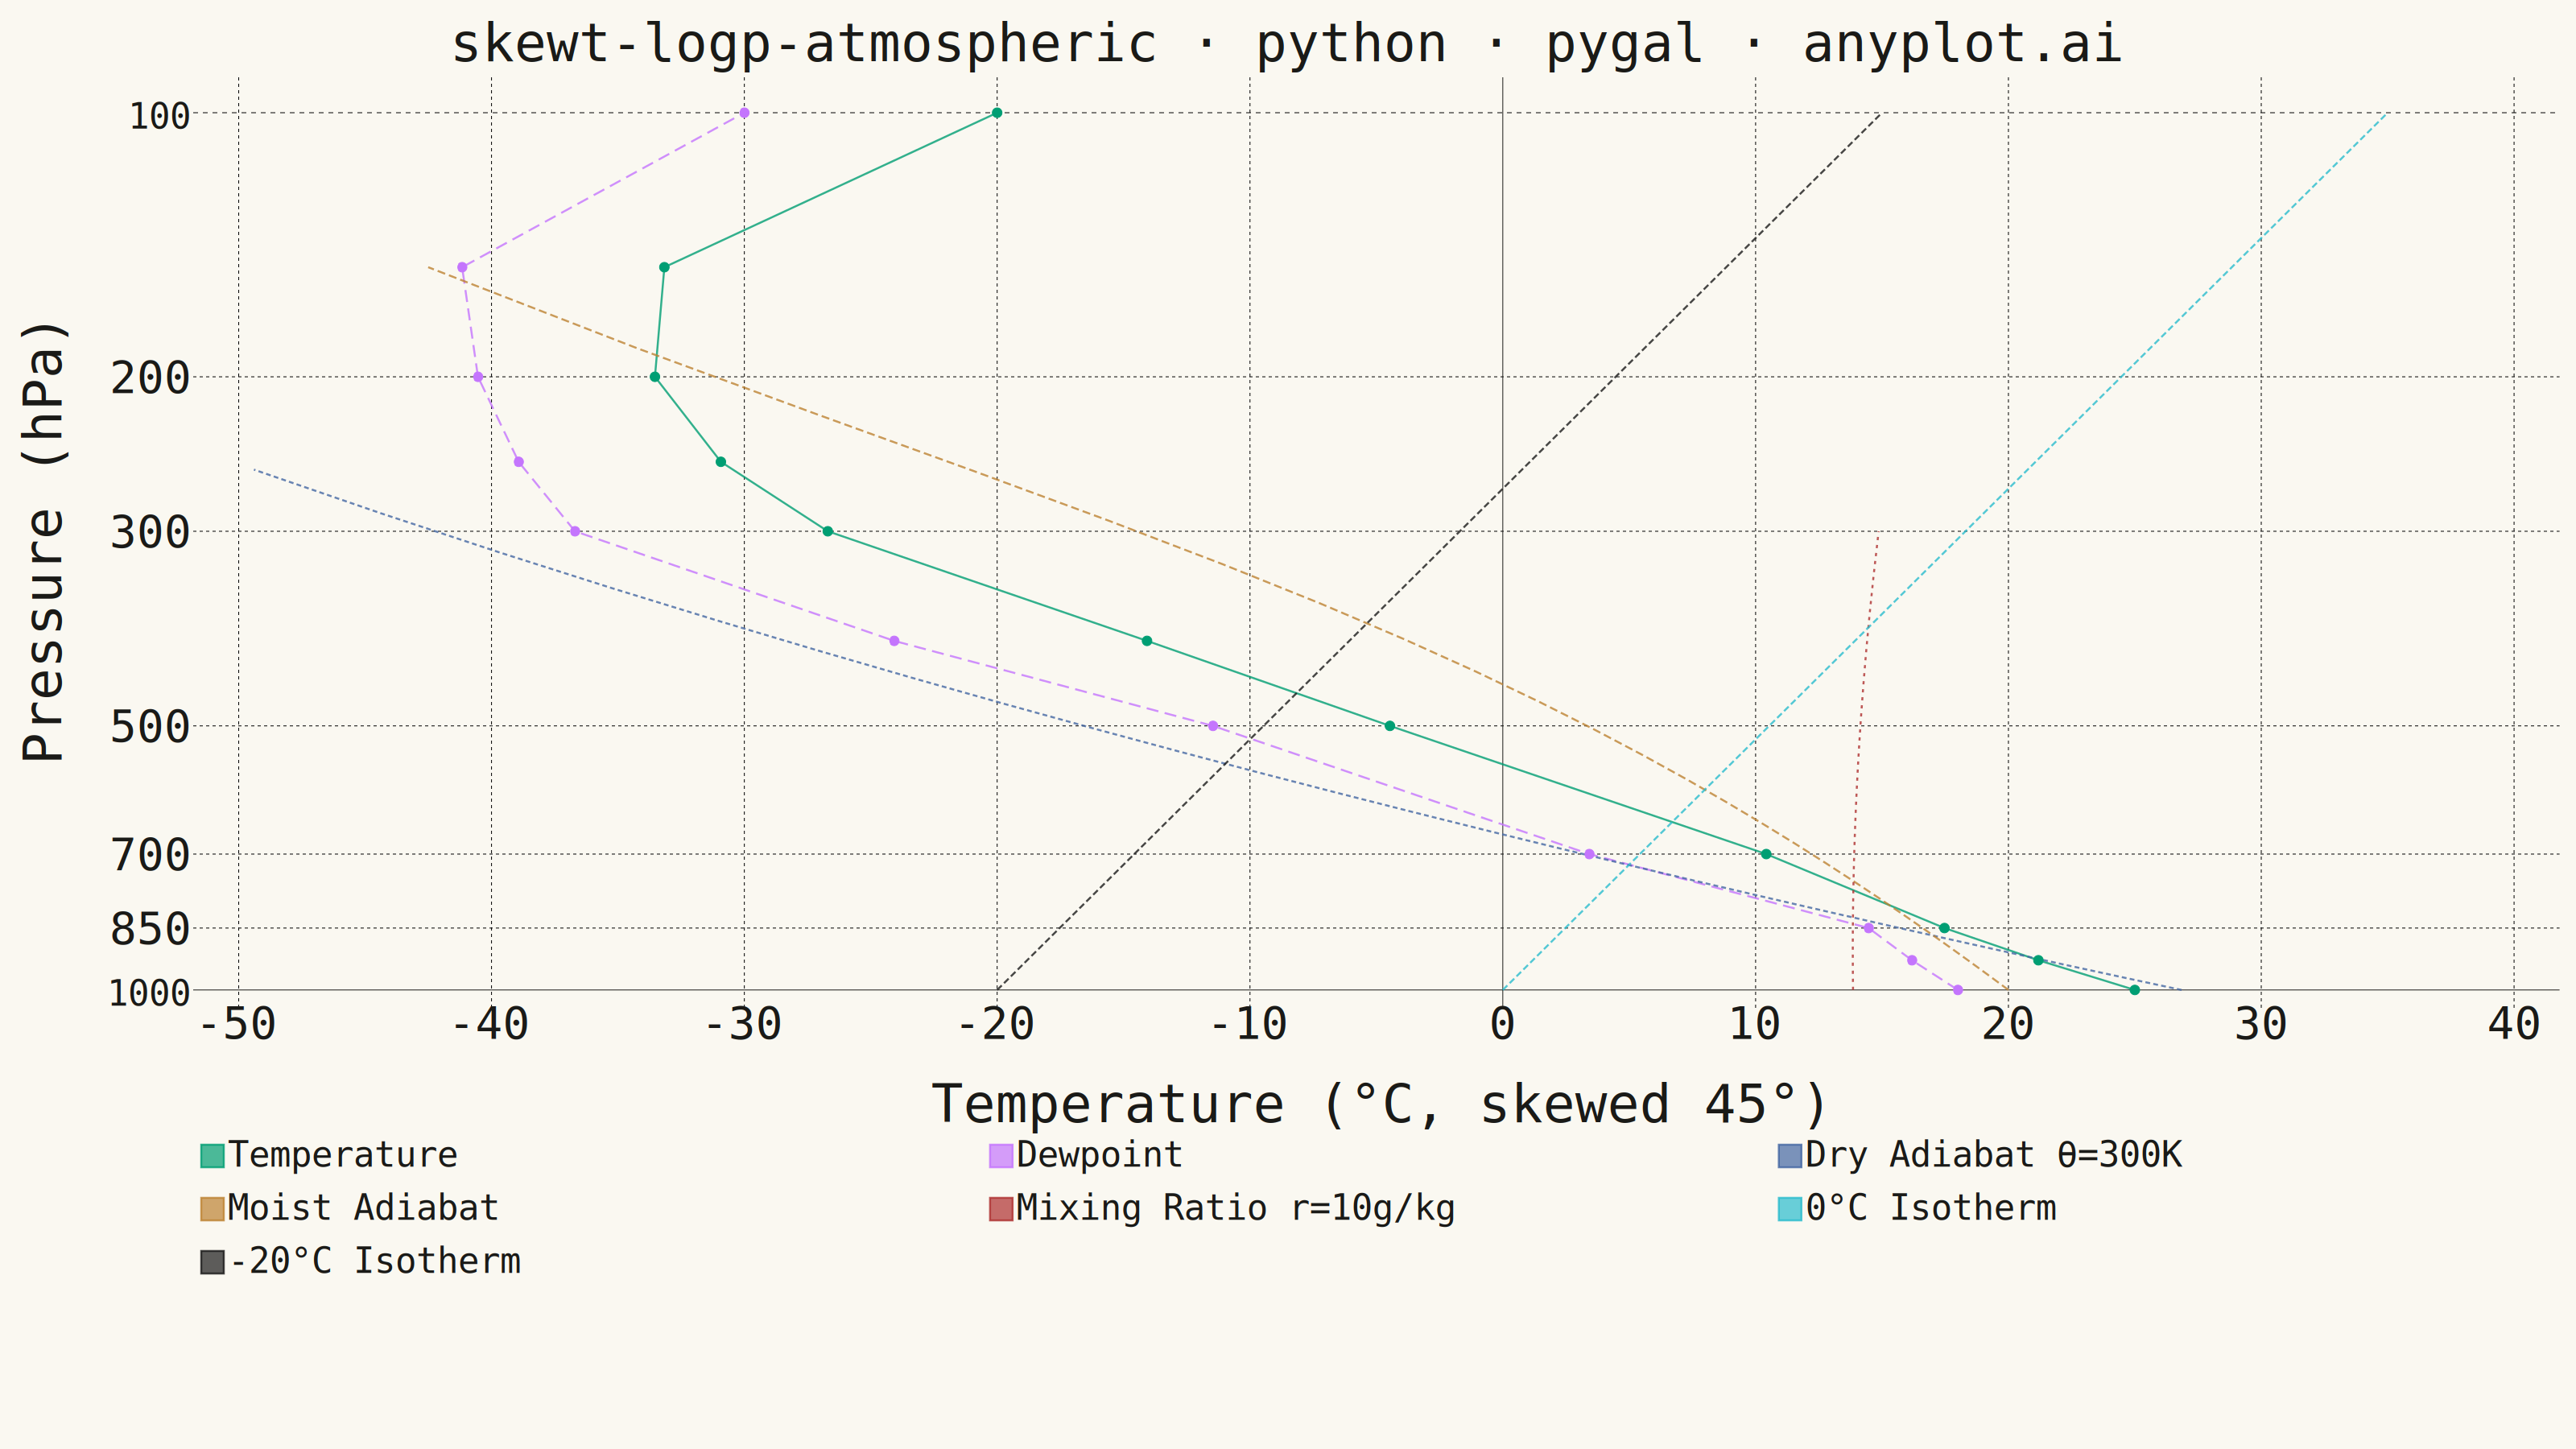
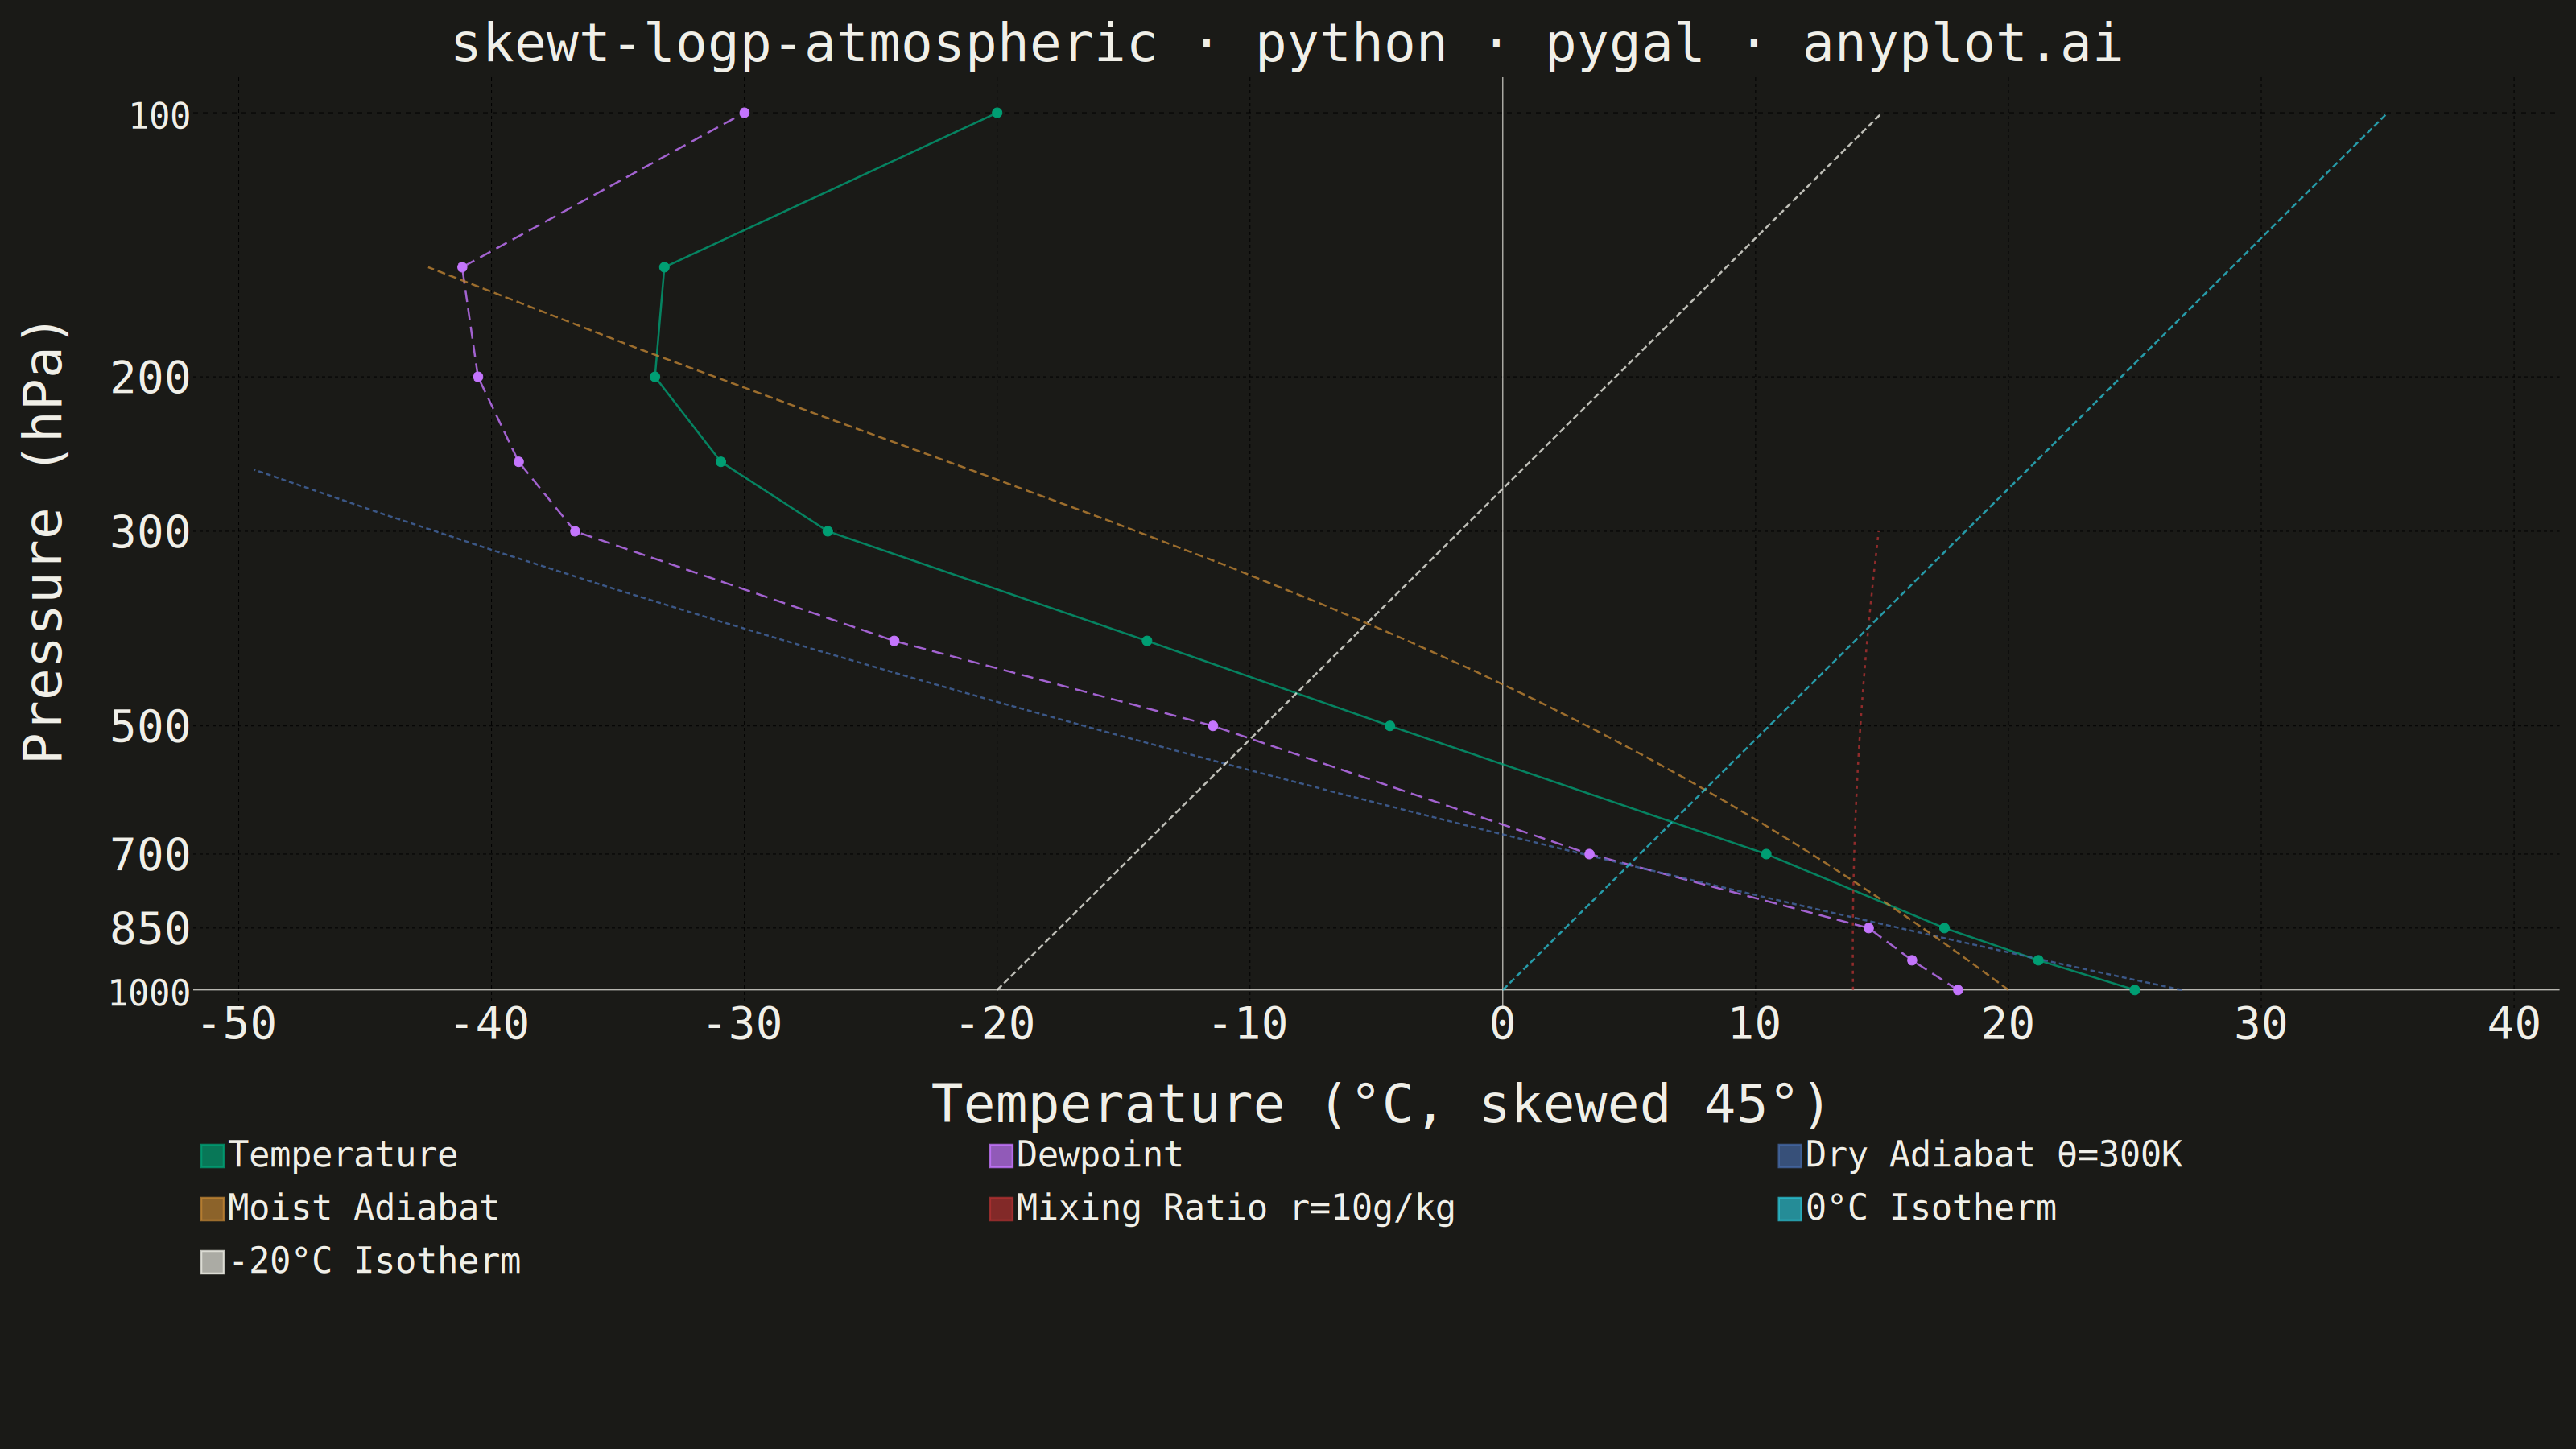
A Skew-T Log-P diagram is a specialized thermodynamic chart used in meteorology to display vertical atmospheric profiles. It features a logarithmic pressure axis (inverted, with surface at bottom) and temperature isotherms skewed 45 degrees to the right, allowing simultaneous visualization of temperature, dewpoint, and derived stability parameters. This diagram is essential for analyzing atmospheric soundings and assessing weather conditions.
""" anyplot.ai
skewt-logp-atmospheric: Skew-T Log-P Atmospheric Diagram
Library: pygal 3.1.0 | Python 3.13.13
Quality: 80/100 | Updated: 2026-05-21
"""

import os
import sys


# Running as pygal.py: remove script dir from sys.path so 'import pygal' finds the package
_this_dir = os.path.dirname(os.path.abspath(__file__))
sys.path = [p for p in sys.path if os.path.abspath(p or os.getcwd()) != _this_dir]

import numpy as np
import pygal
from pygal.style import Style


# Theme tokens
THEME = os.getenv("ANYPLOT_THEME", "light")
PAGE_BG = "#FAF8F1" if THEME == "light" else "#1A1A17"
INK = "#1A1A17" if THEME == "light" else "#F0EFE8"
INK_MUTED = "#6B6A63" if THEME == "light" else "#A8A79F"
NEUTRAL = "#1A1A1A" if THEME == "light" else "#E8E8E0"  # position-8 adaptive neutral

# Position 7 (yellow #954477) is prohibited for thin lines on light surfaces;
# replace with NEUTRAL for the -20°C isotherm reference line
IMPRINT = ("#009E73", "#C475FD", "#4467A3", "#BD8233", "#AE3030", "#2ABCCD", NEUTRAL)

# Data — realistic mid-latitude atmospheric sounding
np.random.seed(42)
pressure = np.array([1000, 925, 850, 700, 500, 400, 300, 250, 200, 150, 100])
temperature = np.array([25, 20, 15, 5, -15, -28, -45, -52, -58, -62, -55])
dewpoint = np.array([18, 15, 12, -2, -22, -38, -55, -60, -65, -70, -65])

log_p = np.log10(1000.0 / pressure)
skew_factor = 35
temp_skewed = temperature + skew_factor * log_p
dewpoint_skewed = dewpoint + skew_factor * log_p

# Physical constants for moist adiabatic lapse rate
LV = 2.501e6  # Latent heat of vaporization (J/kg)
RD = 287.05  # Gas constant for dry air (J/kg/K)
RV = 461.5  # Gas constant for water vapor (J/kg/K)
CP = 1004.0  # Specific heat of dry air (J/kg/K)
G = 9.81  # Gravity (m/s^2)


def moist_adiabat(T0_C, pressures):
    """Integrate proper moist adiabatic lapse rate (MALR) along pressure levels."""
    temps = [T0_C]
    T = T0_C + 273.15
    for i in range(len(pressures) - 1):
        p = pressures[i]
        es = 6.112 * np.exp(17.67 * (T - 273.15) / ((T - 273.15) + 243.5))
        ws = 0.622 * es / (p - es)  # saturation mixing ratio kg/kg (p, es both hPa)
        malr = G * (1 + LV * ws / (RD * T)) / (CP + LV**2 * ws / (RV * T**2))  # K/m
        # dT/dp_hPa = MALR * Rd*T / (g*p_hPa) — hPa units cancel via hydrostatic
        T += malr * RD * T / (G * p) * (pressures[i + 1] - p)
        temps.append(T - 273.15)
    return np.array(temps)


# Style
custom_style = Style(
    background=PAGE_BG,
    plot_background=PAGE_BG,
    foreground=INK,
    foreground_strong=INK,
    foreground_subtle=INK_MUTED,
    colors=IMPRINT,
    title_font_size=66,
    label_font_size=56,
    major_label_font_size=44,
    legend_font_size=44,
    value_font_size=36,
    stroke_width=2.5,
)

# Reduced Y-axis label set — skip 925/400/250/150 to avoid crowding at log-compressed bottom
key_pressures = [1000, 850, 700, 500, 300, 200, 100]
y_labels = [{"value": float(np.log10(1000.0 / p)), "label": str(p)} for p in key_pressures]

# Plot
chart = pygal.XY(
    width=3200,
    height=1800,
    style=custom_style,
    title="skewt-logp-atmospheric · python · pygal · anyplot.ai",
    x_title="Temperature (°C, skewed 45°)",
    y_title="Pressure (hPa)",
    show_dots=True,
    dots_size=6,
    stroke_style={"width": 4},
    show_x_guides=True,
    show_y_guides=True,
    show_legend=True,
    legend_at_bottom=True,
    range=(0, 1.02),
    xrange=(-50, 40),  # narrowed from 75 — reference lines reach at most x≈35
    y_labels=y_labels,
    truncate_legend=-1,
    legend_box_size=28,
    margin_bottom=220,
)

# Temperature profile (green #009E73 — series 1, primary data)
temp_points = [(float(temp_skewed[i]), float(log_p[i])) for i in range(len(pressure))]
chart.add("Temperature", temp_points, stroke_style={"width": 7})

# Dewpoint profile (vermillion #C475FD — series 2)
dewpoint_points = [(float(dewpoint_skewed[i]), float(log_p[i])) for i in range(len(pressure))]
chart.add("Dewpoint", dewpoint_points, stroke_style={"width": 6, "dasharray": "15,8"})

# Dry adiabat θ=300K (blue #4467A3 — series 3)
theta = 300
dry_adiabat_points = []
for p in np.linspace(1000, 100, 30):
    lp = np.log10(1000.0 / p)
    t_adiabat = theta * (p / 1000.0) ** 0.286 - 273.15
    t_skewed = t_adiabat + skew_factor * lp
    if -50 <= t_skewed <= 40:
        dry_adiabat_points.append((float(t_skewed), float(lp)))
chart.add("Dry Adiabat θ=300K", dry_adiabat_points, show_dots=False, stroke_style={"width": 3, "dasharray": "6,4"})

# Moist adiabat (reddish purple #BD8233 — series 4, proper MALR integration)
moist_pressures = np.linspace(1000, 150, 25)
moist_temps = moist_adiabat(20.0, moist_pressures)
moist_points = []
for T_c, p in zip(moist_temps, moist_pressures, strict=False):
    lp = np.log10(1000.0 / p)
    t_skewed = T_c + skew_factor * lp
    if -50 <= t_skewed <= 40:
        moist_points.append((float(t_skewed), float(lp)))
chart.add("Moist Adiabat", moist_points, show_dots=False, stroke_style={"width": 3, "dasharray": "10,5"})

# Mixing ratio r=10g/kg (orange #AE3030 — series 5)
mr_points = []
mr = 10
for p in np.linspace(1000, 300, 20):
    lp = np.log10(1000.0 / p)
    e = mr * p / (622 + mr)
    if e > 0:
        td = (243.5 * np.log(e / 6.112)) / (17.67 - np.log(e / 6.112))
        td_skewed = td + skew_factor * lp
        if -50 <= td_skewed <= 40:
            mr_points.append((float(td_skewed), float(lp)))
chart.add("Mixing Ratio r=10g/kg", mr_points, show_dots=False, stroke_style={"width": 2, "dasharray": "4,6"})

# 0°C Isotherm (sky blue #2ABCCD — series 6)
iso_0_points = []
for lp in np.linspace(0, 1.0, 20):
    t_skewed = 0 + skew_factor * lp
    if -50 <= t_skewed <= 40:
        iso_0_points.append((float(t_skewed), float(lp)))
chart.add("0°C Isotherm", iso_0_points, show_dots=False, stroke_style={"width": 2, "dasharray": "8,4"})

# -20°C Isotherm (NEUTRAL — series 7, replaces yellow which has insufficient contrast on light bg)
iso_m20_points = []
for lp in np.linspace(0, 1.0, 20):
    t_skewed = -20 + skew_factor * lp
    if -50 <= t_skewed <= 40:
        iso_m20_points.append((float(t_skewed), float(lp)))
chart.add("-20°C Isotherm", iso_m20_points, show_dots=False, stroke_style={"width": 2, "dasharray": "8,4"})

# Save
chart.render_to_png(f"plot-{THEME}.png")
with open(f"plot-{THEME}.html", "wb") as f:
    f.write(chart.render())
Runnable source as JSON, for any HTTP client: https://api.anyplot.ai/specs/skewt-logp-atmospheric/pygal/code. Any spec id and library id listed in llms-full.txt fit the same URL shape; every URL below is complete and callable.
{
  "spec_id": "skewt-logp-atmospheric",
  "language": "python",
  "library": "pygal",
  "page": "https://anyplot.ai/skewt-logp-atmospheric/python/pygal",
  "hub": "https://anyplot.ai/skewt-logp-atmospheric",
  "code_json": "https://api.anyplot.ai/specs/skewt-logp-atmospheric/pygal/code",
  "spec_json": "https://api.anyplot.ai/specs/skewt-logp-atmospheric",
  "render_light_png": "https://storage.googleapis.com/anyplot-images/plots/skewt-logp-atmospheric/python/pygal/plot-light.png",
  "render_dark_png": "https://storage.googleapis.com/anyplot-images/plots/skewt-logp-atmospheric/python/pygal/plot-dark.png",
  "interactive_light_html": "https://storage.googleapis.com/anyplot-images/plots/skewt-logp-atmospheric/python/pygal/plot-light.html",
  "interactive_dark_html": "https://storage.googleapis.com/anyplot-images/plots/skewt-logp-atmospheric/python/pygal/plot-dark.html",
  "quality_score": 80.0,
  "license": "MIT",
  "guide": "https://anyplot.ai/llms.txt"
}
Part of Skew-T Log-P Atmospheric Diagram on anyplot.ai.