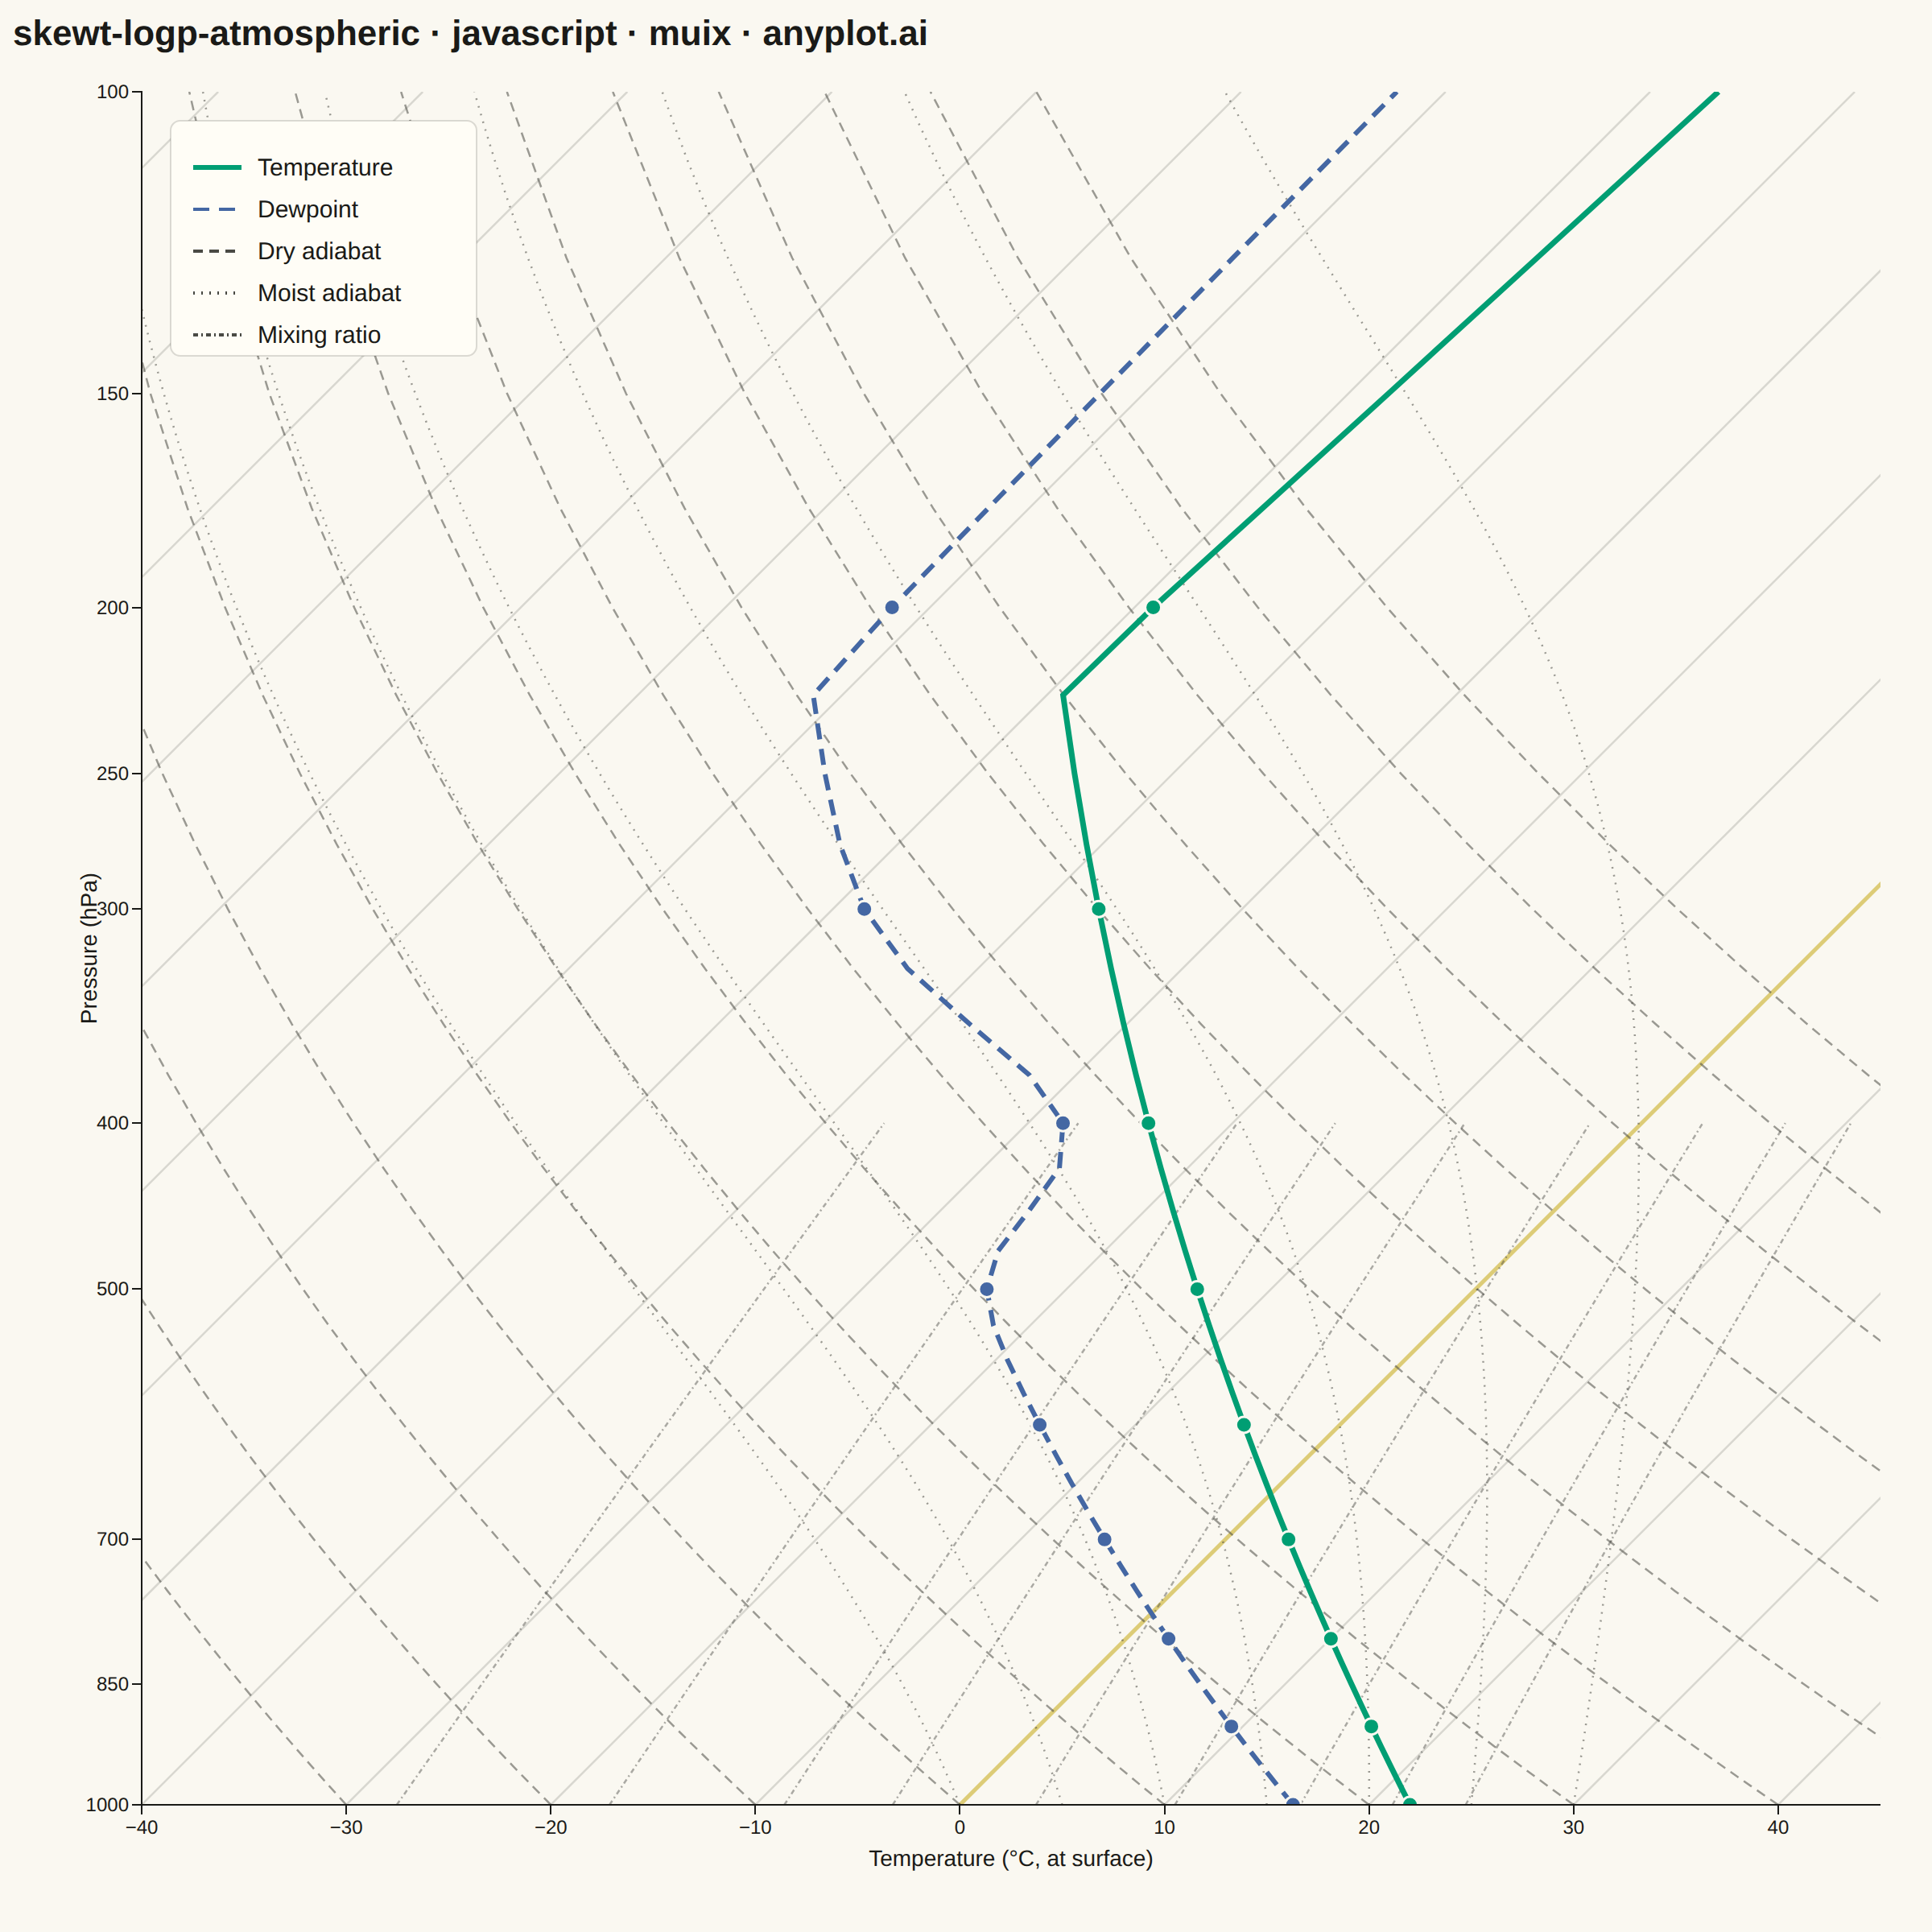
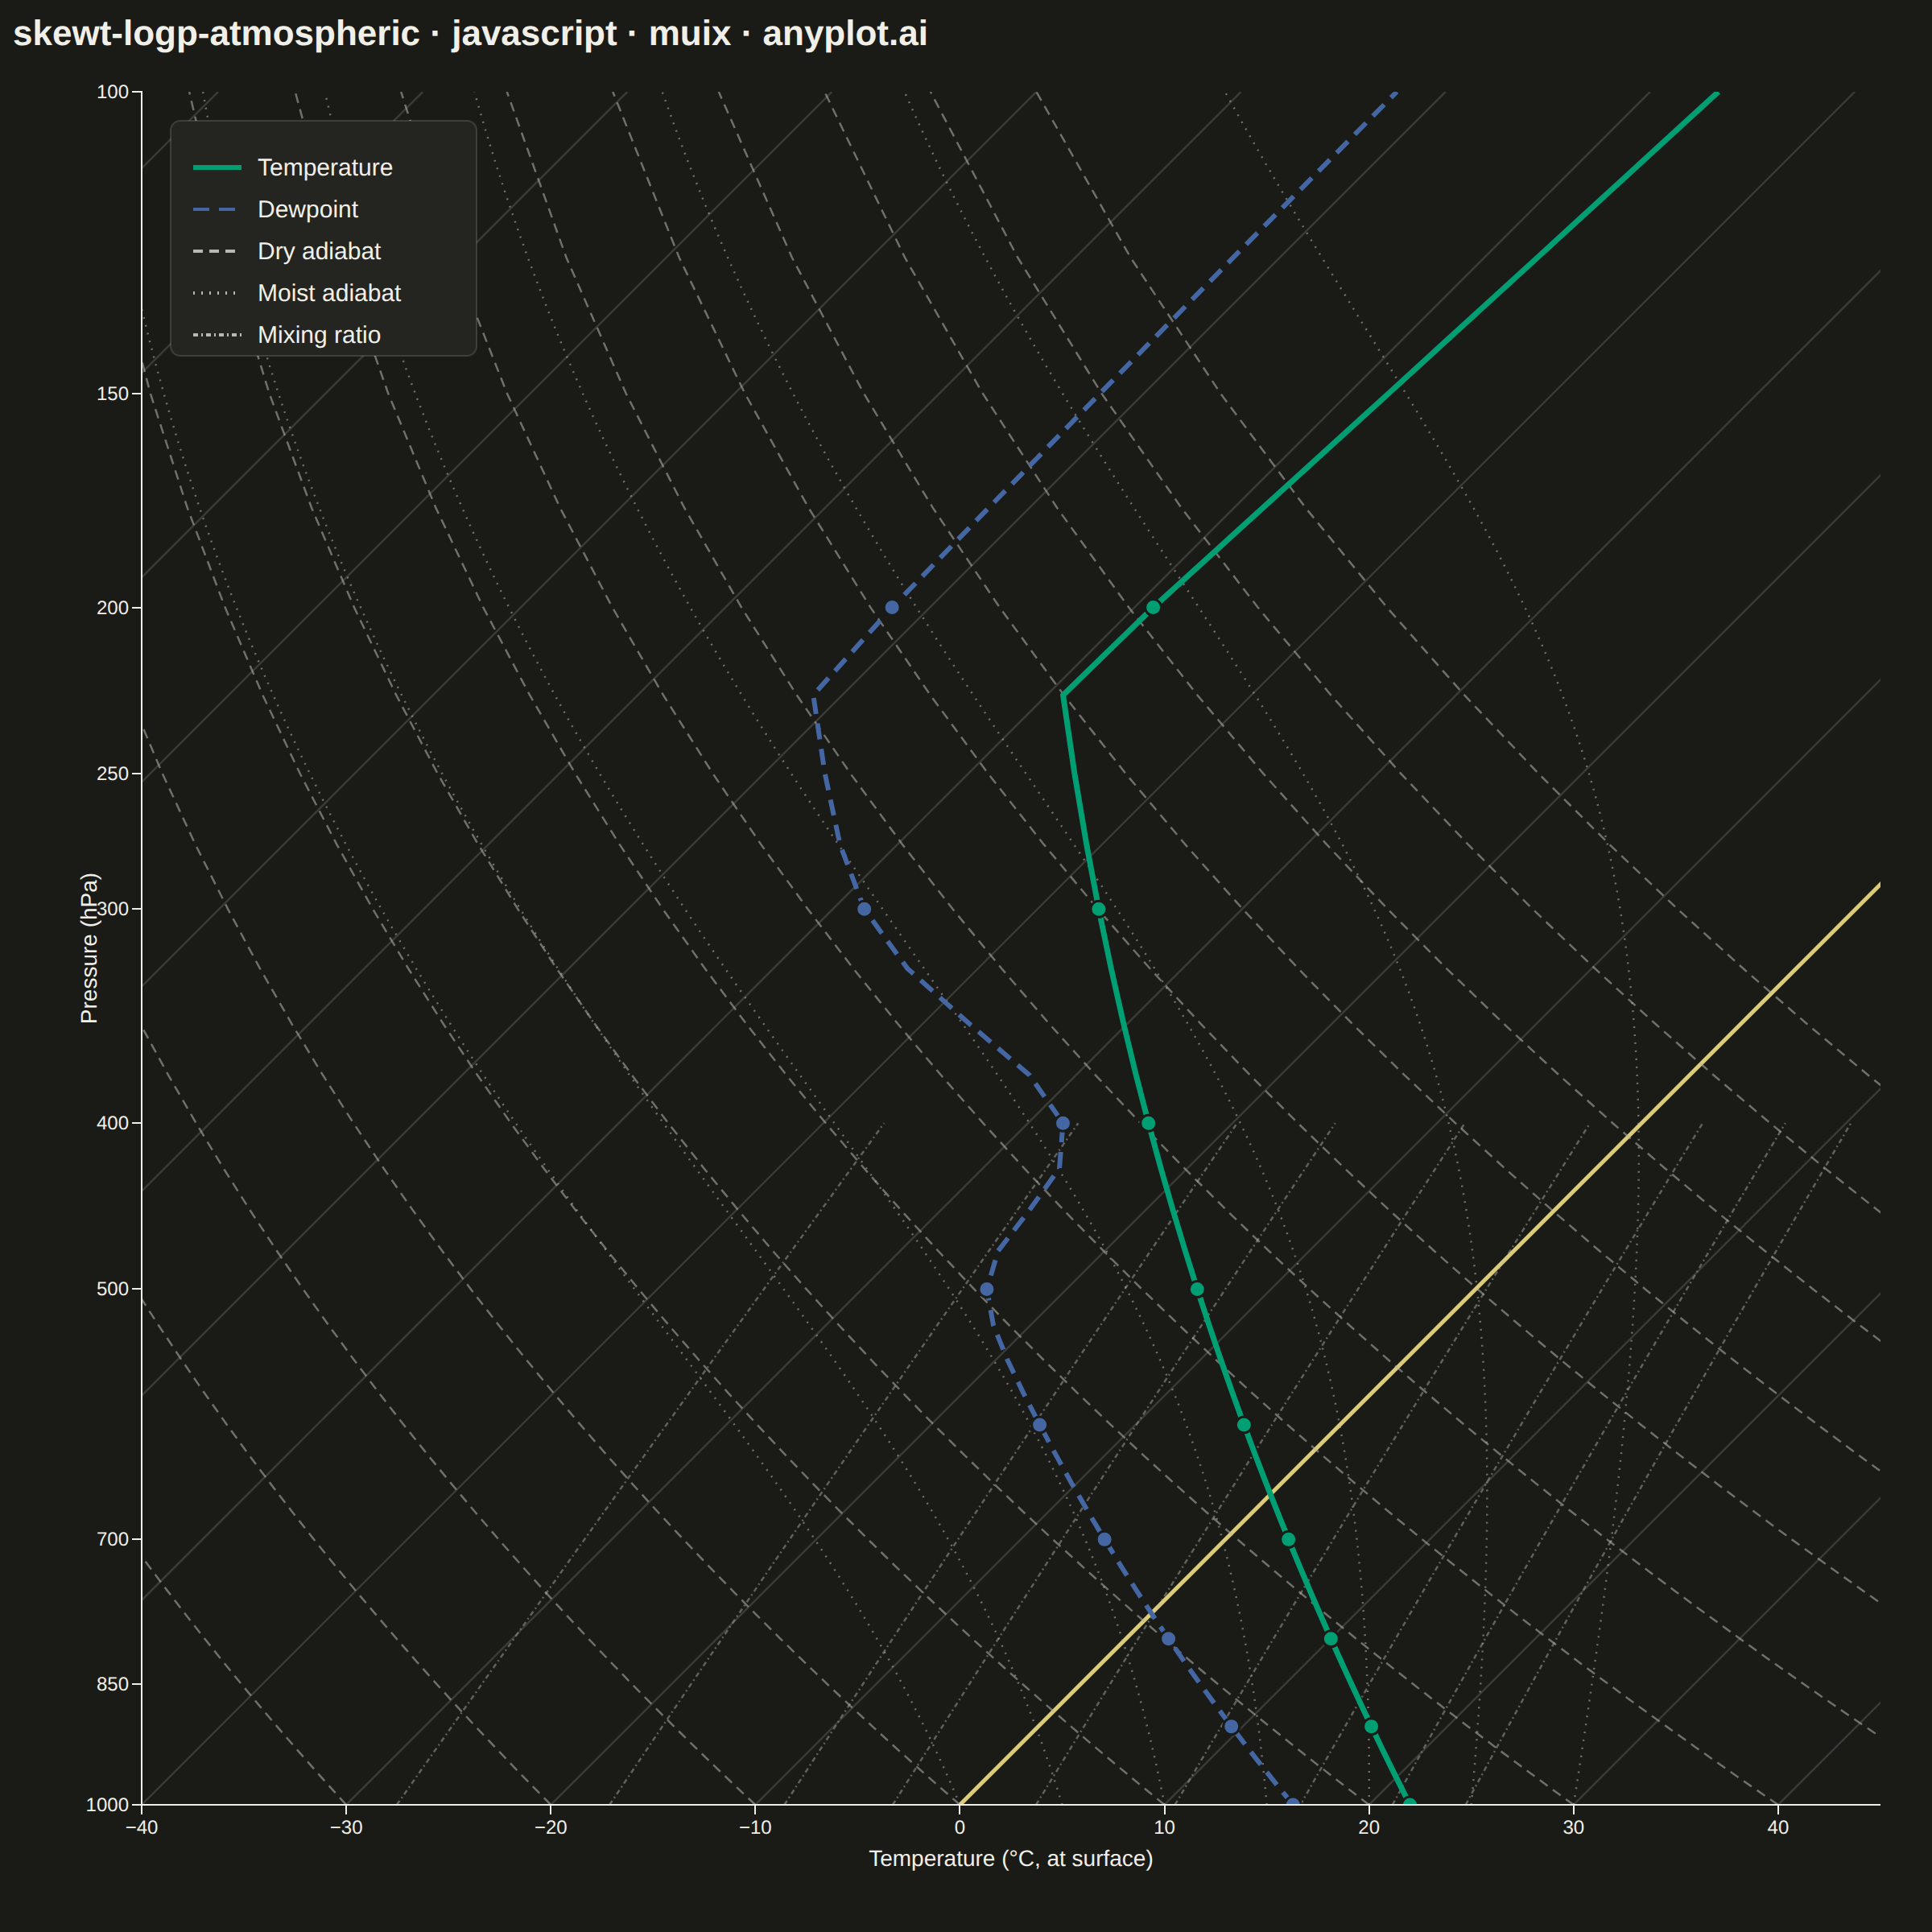
The same plot in 14 other libraries — JavaScript: Chart.js, D3.js, Apache ECharts, Highcharts; Python: Altair, Bokeh, lets-plot, Matplotlib, Plotly, plotnine, Pygal, Seaborn; R: ggplot2; Julia: Makie.jl. Compare all 15 side by side: Skew-T Log-P Atmospheric Diagram in Python, R, Julia and JavaScript.
A Skew-T Log-P diagram is a specialized thermodynamic chart used in meteorology to display vertical atmospheric profiles. It features a logarithmic pressure axis (inverted, with surface at bottom) and temperature isotherms skewed 45 degrees to the right, allowing simultaneous visualization of temperature, dewpoint, and derived stability parameters. This diagram is essential for analyzing atmospheric soundings and assessing weather conditions.
// anyplot.ai
// skewt-logp-atmospheric: Skew-T Log-P Atmospheric Diagram
// Library: muix 7.29.1 | JavaScript 22.23.2
// Quality: 92/100 | Created: 2026-08-26
//# anyplot-orientation: square
// anyplot.ai
// skewt-logp-atmospheric: Skew-T Log-P Atmospheric Diagram
// Library: MUI X Charts | React | Node 22
// License: @mui/x-charts — MIT (community). Pro/Premium are out of scope.
// Quality: pending | Created: 2026-08-26
import { ChartContainer } from "@mui/x-charts/ChartContainer";
import { ChartsXAxis } from "@mui/x-charts/ChartsXAxis";
import { ChartsYAxis } from "@mui/x-charts/ChartsYAxis";
import { ChartsClipPath } from "@mui/x-charts/ChartsClipPath";
import { useXScale, useYScale, useDrawingArea } from "@mui/x-charts/hooks";
import Box from "@mui/material/Box";
import Typography from "@mui/material/Typography";

const t = window.ANYPLOT_TOKENS;

// --- Thermodynamic constants -------------------------------------------------
const P_SURFACE = 1000; // hPa — skew reference level (surface, bottom of chart)
const P_TOP = 100; // hPa — top of chart (lower stratosphere)
const KAPPA = 0.286; // Rd / cp — dry adiabatic exponent
const R_D = 287; // J / (kg K) — gas constant for dry air
const C_P = 1004; // J / (kg K) — specific heat of dry air at constant pressure
const L_V = 2.5e6; // J / kg — latent heat of vaporization
const EPSILON = 0.622; // ratio of gas constants (Rd / Rv)

// --- Pressure grid (deterministic, radiosonde-like resolution) --------------
const PRESSURE_LEVELS = [];
for (let p = P_SURFACE; p >= P_TOP; p -= 25) PRESSURE_LEVELS.push(p);

// --- Atmospheric profile model (deterministic, no RNG needed) ---------------
function heightFromPressure(pressureHpa) {
  return 44330 * (1 - Math.pow(pressureHpa / P_SURFACE, 1 / 5.255));
}

function standardTemperatureC(heightM) {
  const surfaceTempC = 22; // warm-season surface reading
  const lapseRateCPerKm = 6.5;
  const tropopauseHeightM = 11000;
  const tropopauseTempC = surfaceTempC - lapseRateCPerKm * (tropopauseHeightM / 1000);
  if (heightM <= tropopauseHeightM) {
    return surfaceTempC - lapseRateCPerKm * (heightM / 1000);
  }
  return tropopauseTempC + 0.6 * ((heightM - tropopauseHeightM) / 1000);
}

function saturationVaporPressureHpa(tempC) {
  return 6.112 * Math.exp((17.67 * tempC) / (tempC + 243.5));
}

function dewpointFromVaporPressureC(vaporPressureHpa) {
  const logRatio = Math.log(vaporPressureHpa / 6.112);
  return (243.5 * logRatio) / (17.67 - logRatio);
}

function relativeHumidityFraction(pressureHpa) {
  const dryingWithHeight = 0.15 + 0.55 * Math.max(0, (pressureHpa - P_TOP) / (P_SURFACE - P_TOP));
  const embeddedMoistLayer = 0.35 * Math.exp(-Math.pow((pressureHpa - 400) / 60, 2));
  return Math.min(0.95, dryingWithHeight + embeddedMoistLayer);
}

const soundingTempC = PRESSURE_LEVELS.map((p) => standardTemperatureC(heightFromPressure(p)));
const soundingDewpointC = PRESSURE_LEVELS.map((p, i) => {
  const es = saturationVaporPressureHpa(soundingTempC[i]);
  const e = relativeHumidityFraction(p) * es;
  return dewpointFromVaporPressureC(e);
});

// --- Reference-line families --------------------------------------------------
function dryAdiabatTempC(surfaceTempC, pressureHpa) {
  const thetaK = surfaceTempC + 273.15;
  return thetaK * Math.pow(pressureHpa / P_SURFACE, KAPPA) - 273.15;
}
const DRY_ADIABAT_ANCHORS_C = [];
for (let tc = -30; tc <= 100; tc += 10) DRY_ADIABAT_ANCHORS_C.push(tc);

function moistAdiabatCurve(surfaceTempC) {
  const points = [{ p: P_SURFACE, t: surfaceTempC }];
  let temp = surfaceTempC;
  let pressure = P_SURFACE;
  const stepHpa = 5;
  while (pressure > P_TOP) {
    const es = saturationVaporPressureHpa(temp);
    const ws = (EPSILON * es) / (pressure - es);
    const tempK = temp + 273.15;
    const numerator = 1 + (L_V * ws) / (R_D * tempK);
    const denominator = 1 + (L_V * L_V * ws * EPSILON) / (C_P * R_D * tempK * tempK);
    const dTdP = ((tempK / pressure) * (R_D / C_P) * numerator) / denominator;
    temp += dTdP * -stepHpa;
    pressure -= stepHpa;
    points.push({ p: pressure, t: temp });
  }
  return points;
}
const MOIST_ADIABAT_ANCHORS_C = [0, 5, 10, 15, 20, 25, 30];

function mixingRatioTempC(mixingRatioGPerKg, pressureHpa) {
  const w = mixingRatioGPerKg / 1000;
  const vaporPressureHpa = (w * pressureHpa) / (EPSILON + w);
  return dewpointFromVaporPressureC(vaporPressureHpa);
}
const MIXING_RATIOS_G_PER_KG = [0.4, 1, 2, 3, 5, 8, 12, 16, 20];
const MIXING_RATIO_MIN_PRESSURE = 400; // conventionally shown lower/mid troposphere only

// --- Custom overlay: draws the skewed coordinate system as clipped SVG ------
// MUI X community has no built-in skew transform, so the temperature axis is
// pre-skewed per pressure level (skewOffset) using the chart's own pixel
// scales — this keeps the 45-degree isotherms mathematically exact regardless
// of the margins MUI X computes for the axis labels.
function SkewTOverlay() {
  const xScale = useXScale();
  const yScale = useYScale();
  const drawingArea = useDrawingArea();

  const pxPerDegC = xScale(1) - xScale(0);
  const skewOffsetC = (pressureHpa) => (yScale(P_SURFACE) - yScale(pressureHpa)) / pxPerDegC;
  const toPixel = (tempC, pressureHpa) => [
    xScale(tempC + skewOffsetC(pressureHpa)),
    yScale(pressureHpa),
  ];
  const pathFor = (levels, tempAt) =>
    levels
      .map((p, i) => {
        const [x, y] = toPixel(tempAt(p, i), p);
        return `${i === 0 ? "M" : "L"}${x},${y}`;
      })
      .join(" ");

  const isotherms = [];
  for (let tc = -120; tc <= 120; tc += 10) {
    const [x1, y1] = toPixel(tc, P_SURFACE);
    const [x2, y2] = toPixel(tc, P_TOP);
    isotherms.push({ tc, x1, y1, x2, y2 });
  }

  const dryAdiabatPaths = DRY_ADIABAT_ANCHORS_C.map((anchor) =>
    pathFor(PRESSURE_LEVELS, (p) => dryAdiabatTempC(anchor, p)),
  );
  const moistAdiabatPaths = MOIST_ADIABAT_ANCHORS_C.map((anchor) => {
    const curve = moistAdiabatCurve(anchor);
    return curve
      .map((pt, i) => {
        const [x, y] = toPixel(pt.t, pt.p);
        return `${i === 0 ? "M" : "L"}${x},${y}`;
      })
      .join(" ");
  });
  const mixingRatioLevels = PRESSURE_LEVELS.filter((p) => p >= MIXING_RATIO_MIN_PRESSURE);
  const mixingRatioPaths = MIXING_RATIOS_G_PER_KG.map((w) =>
    pathFor(mixingRatioLevels, (p) => mixingRatioTempC(w, p)),
  );

  const tempPath = pathFor(PRESSURE_LEVELS, (_p, i) => soundingTempC[i]);
  const dewpointPath = pathFor(PRESSURE_LEVELS, (_p, i) => soundingDewpointC[i]);
  const markerLevels = PRESSURE_LEVELS.map((p, i) => ({ p, i })).filter(
    (_, i) => i % 4 === 0 && i !== PRESSURE_LEVELS.length - 1,
  );

  const clipId = "skewt-plot-clip";
  const legendX = drawingArea.left + 18;
  const legendY = drawingArea.top + 18;
  const legendRows = [
    { label: "Temperature", color: t.palette[0], dash: "0" },
    { label: "Dewpoint", color: t.palette[2], dash: "10 6" },
    { label: "Dry adiabat", color: t.inkSoft, dash: "6 4" },
    { label: "Moist adiabat", color: t.inkSoft, dash: "1 4" },
    { label: "Mixing ratio", color: t.inkSoft, dash: "3 2 1 2" },
  ];
  const legendRowHeight = 26;
  const legendHeight = legendRows.length * legendRowHeight + 16;
  const legendWidth = 190;

  return (
    <>
      <ChartsClipPath id={clipId} />
      <g clipPath={`url(#${clipId})`}>
        {isotherms.map((l) => (
          <line
            key={`iso-${l.tc}`}
            x1={l.x1}
            y1={l.y1}
            x2={l.x2}
            y2={l.y2}
            stroke={l.tc === 0 ? t.amber : t.grid}
            strokeWidth={l.tc === 0 ? 2.5 : 1.25}
          />
        ))}
        {dryAdiabatPaths.map((d, i) => (
          <path
            key={`dry-${i}`}
            d={d}
            fill="none"
            stroke={t.inkSoft}
            strokeWidth={1.25}
            strokeDasharray="6 4"
            opacity={0.55}
          />
        ))}
        {moistAdiabatPaths.map((d, i) => (
          <path
            key={`moist-${i}`}
            d={d}
            fill="none"
            stroke={t.inkSoft}
            strokeWidth={1.25}
            strokeDasharray="1 4"
            opacity={0.55}
          />
        ))}
        {mixingRatioPaths.map((d, i) => (
          <path
            key={`mix-${i}`}
            d={d}
            fill="none"
            stroke={t.inkSoft}
            strokeWidth={1.25}
            strokeDasharray="3 2 1 2"
            opacity={0.45}
          />
        ))}
        <path d={dewpointPath} fill="none" stroke={t.palette[2]} strokeWidth={3} strokeDasharray="10 6" />
        <path d={tempPath} fill="none" stroke={t.palette[0]} strokeWidth={3.5} />
        {markerLevels.map(({ p, i }) => {
          const [xT, yT] = toPixel(soundingTempC[i], p);
          const [xD, yD] = toPixel(soundingDewpointC[i], p);
          return (
            <g key={`mark-${p}`}>
              <circle cx={xT} cy={yT} r={5} fill={t.palette[0]} stroke={t.pageBg} strokeWidth={1.5} />
              <circle cx={xD} cy={yD} r={5} fill={t.palette[2]} stroke={t.pageBg} strokeWidth={1.5} />
            </g>
          );
        })}
      </g>
      <rect
        x={legendX}
        y={legendY}
        width={legendWidth}
        height={legendHeight}
        rx={6}
        fill={t.elevatedBg}
        stroke={t.grid}
        strokeWidth={1}
      />
      {legendRows.map((row, i) => {
        const rowY = legendY + 16 + i * legendRowHeight + legendRowHeight / 2;
        return (
          <g key={row.label}>
            <line
              x1={legendX + 14}
              y1={rowY}
              x2={legendX + 44}
              y2={rowY}
              stroke={row.color}
              strokeWidth={row.dash === "0" ? 3 : 2}
              strokeDasharray={row.dash === "0" ? undefined : row.dash}
            />
            <text x={legendX + 54} y={rowY} dy="0.32em" fontSize={15} fill={t.ink}>
              {row.label}
            </text>
          </g>
        );
      })}
    </>
  );
}

// --- Chart (default-exported component — the harness mounts it) -------------
export default function Chart() {
  const titleHeight = 52;
  const chartHeight = window.ANYPLOT_SIZE.height - titleHeight;

  return (
    <Box
      sx={{
        width: window.ANYPLOT_SIZE.width,
        height: window.ANYPLOT_SIZE.height,
        display: "flex",
        flexDirection: "column",
      }}
    >
      <Typography sx={{ fontSize: 22, fontWeight: 600, pl: 1, pt: 0.5 }}>
        skewt-logp-atmospheric · javascript · muix · anyplot.ai
      </Typography>
      <ChartContainer
        width={window.ANYPLOT_SIZE.width}
        height={chartHeight}
        margin={{ top: 20, right: 32, bottom: 64, left: 88 }}
        series={[]}
        skipAnimation
        xAxis={[
          {
            id: "temperature",
            scaleType: "linear",
            min: -40,
            max: 45,
            label: "Temperature (°C, at surface)",
            tickNumber: 9,
          },
        ]}
        yAxis={[
          {
            id: "pressure",
            scaleType: "log",
            reverse: true,
            min: P_TOP,
            max: P_SURFACE,
            label: "Pressure (hPa)",
            tickInterval: [1000, 850, 700, 500, 400, 300, 250, 200, 150, 100],
            valueFormatter: (v) => `${v}`,
          },
        ]}
      >
        <SkewTOverlay />
        <ChartsXAxis axisId="temperature" />
        <ChartsYAxis axisId="pressure" />
      </ChartContainer>
    </Box>
  );
}
Runnable source as JSON, for any HTTP client: https://api.anyplot.ai/specs/skewt-logp-atmospheric/muix/code. Any spec id and library id listed in llms-full.txt fit the same URL shape; every URL below is complete and callable.
{
  "spec_id": "skewt-logp-atmospheric",
  "language": "javascript",
  "library": "muix",
  "page": "https://anyplot.ai/skewt-logp-atmospheric/javascript/muix",
  "hub": "https://anyplot.ai/skewt-logp-atmospheric",
  "code_json": "https://api.anyplot.ai/specs/skewt-logp-atmospheric/muix/code",
  "spec_json": "https://api.anyplot.ai/specs/skewt-logp-atmospheric",
  "render_light_png": "https://storage.googleapis.com/anyplot-images/plots/skewt-logp-atmospheric/javascript/muix/plot-light.png",
  "render_dark_png": "https://storage.googleapis.com/anyplot-images/plots/skewt-logp-atmospheric/javascript/muix/plot-dark.png",
  "interactive_light_html": "https://storage.googleapis.com/anyplot-images/plots/skewt-logp-atmospheric/javascript/muix/plot-light.html",
  "interactive_dark_html": "https://storage.googleapis.com/anyplot-images/plots/skewt-logp-atmospheric/javascript/muix/plot-dark.html",
  "quality_score": 92.0,
  "license": "MIT",
  "guide": "https://anyplot.ai/llms.txt"
}
Part of Skew-T Log-P Atmospheric Diagram on anyplot.ai.