The same plot in 14 other libraries — JavaScript: Chart.js, D3.js, Highcharts, MUI X Charts; Python: Altair, Bokeh, lets-plot, Matplotlib, Plotly, plotnine, Pygal, Seaborn; R: ggplot2; Julia: Makie.jl. Compare all 15 side by side: Skew-T Log-P Atmospheric Diagram in Python, R, Julia and JavaScript.
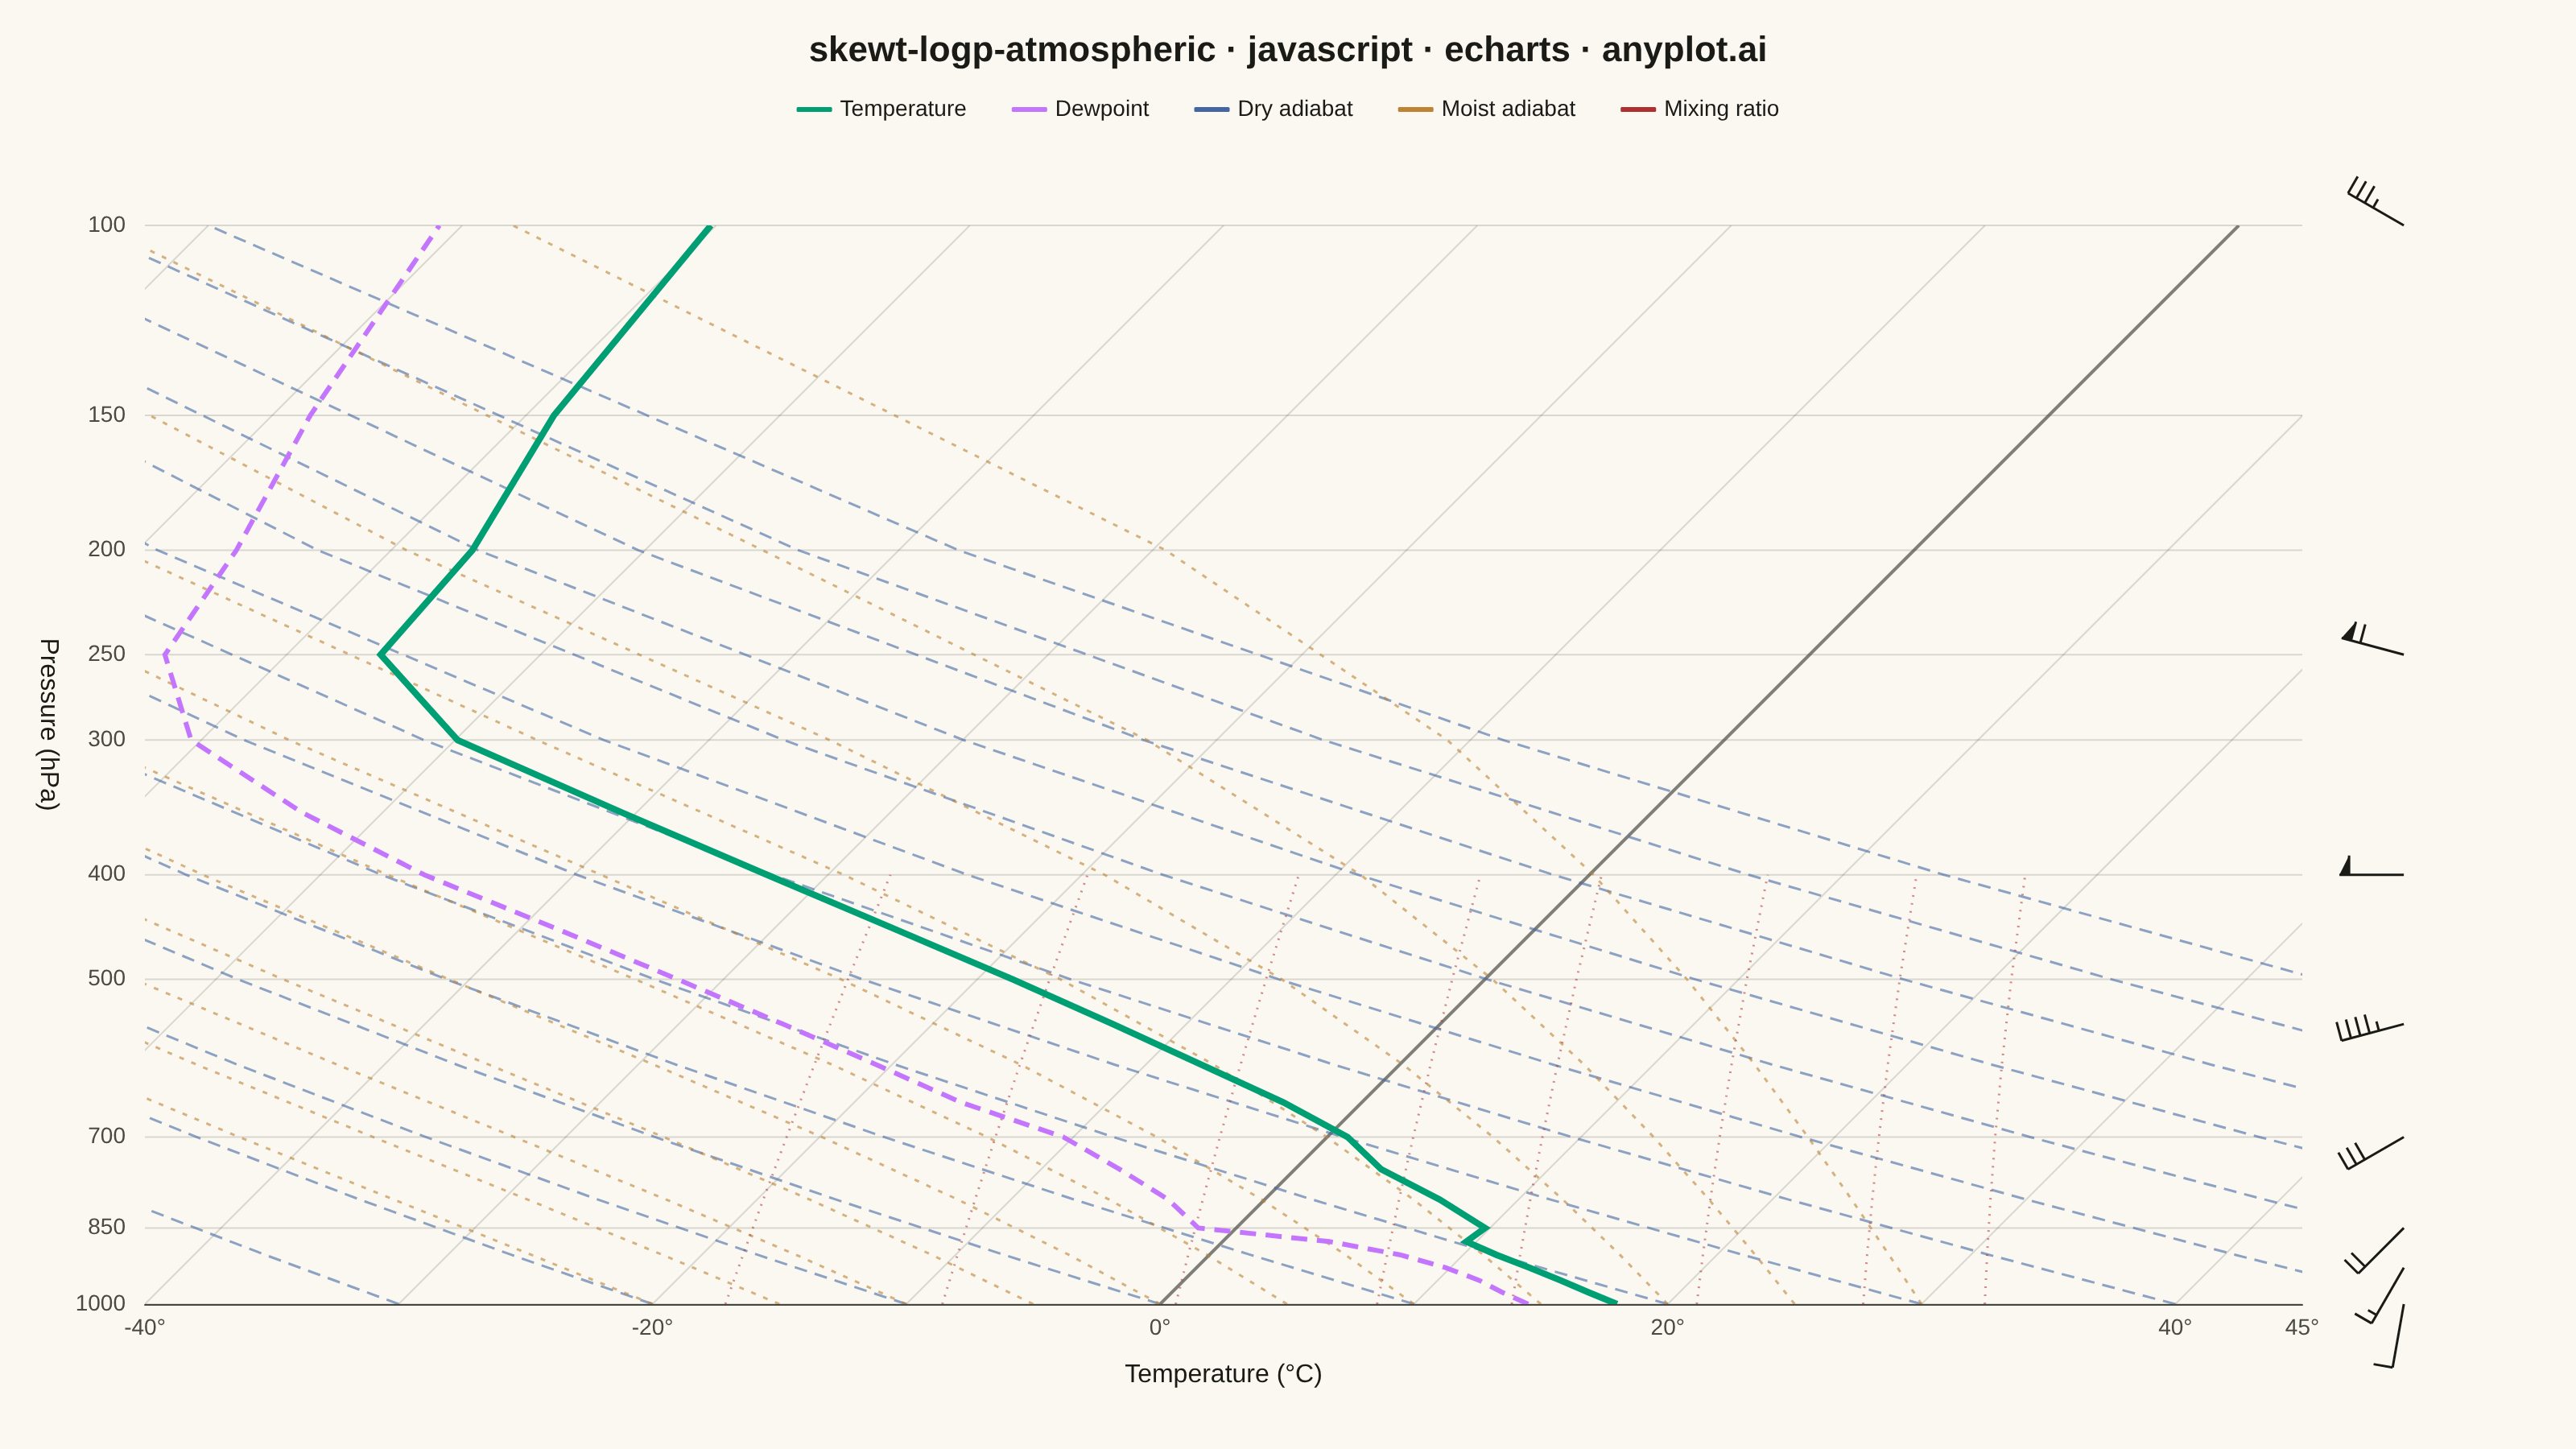
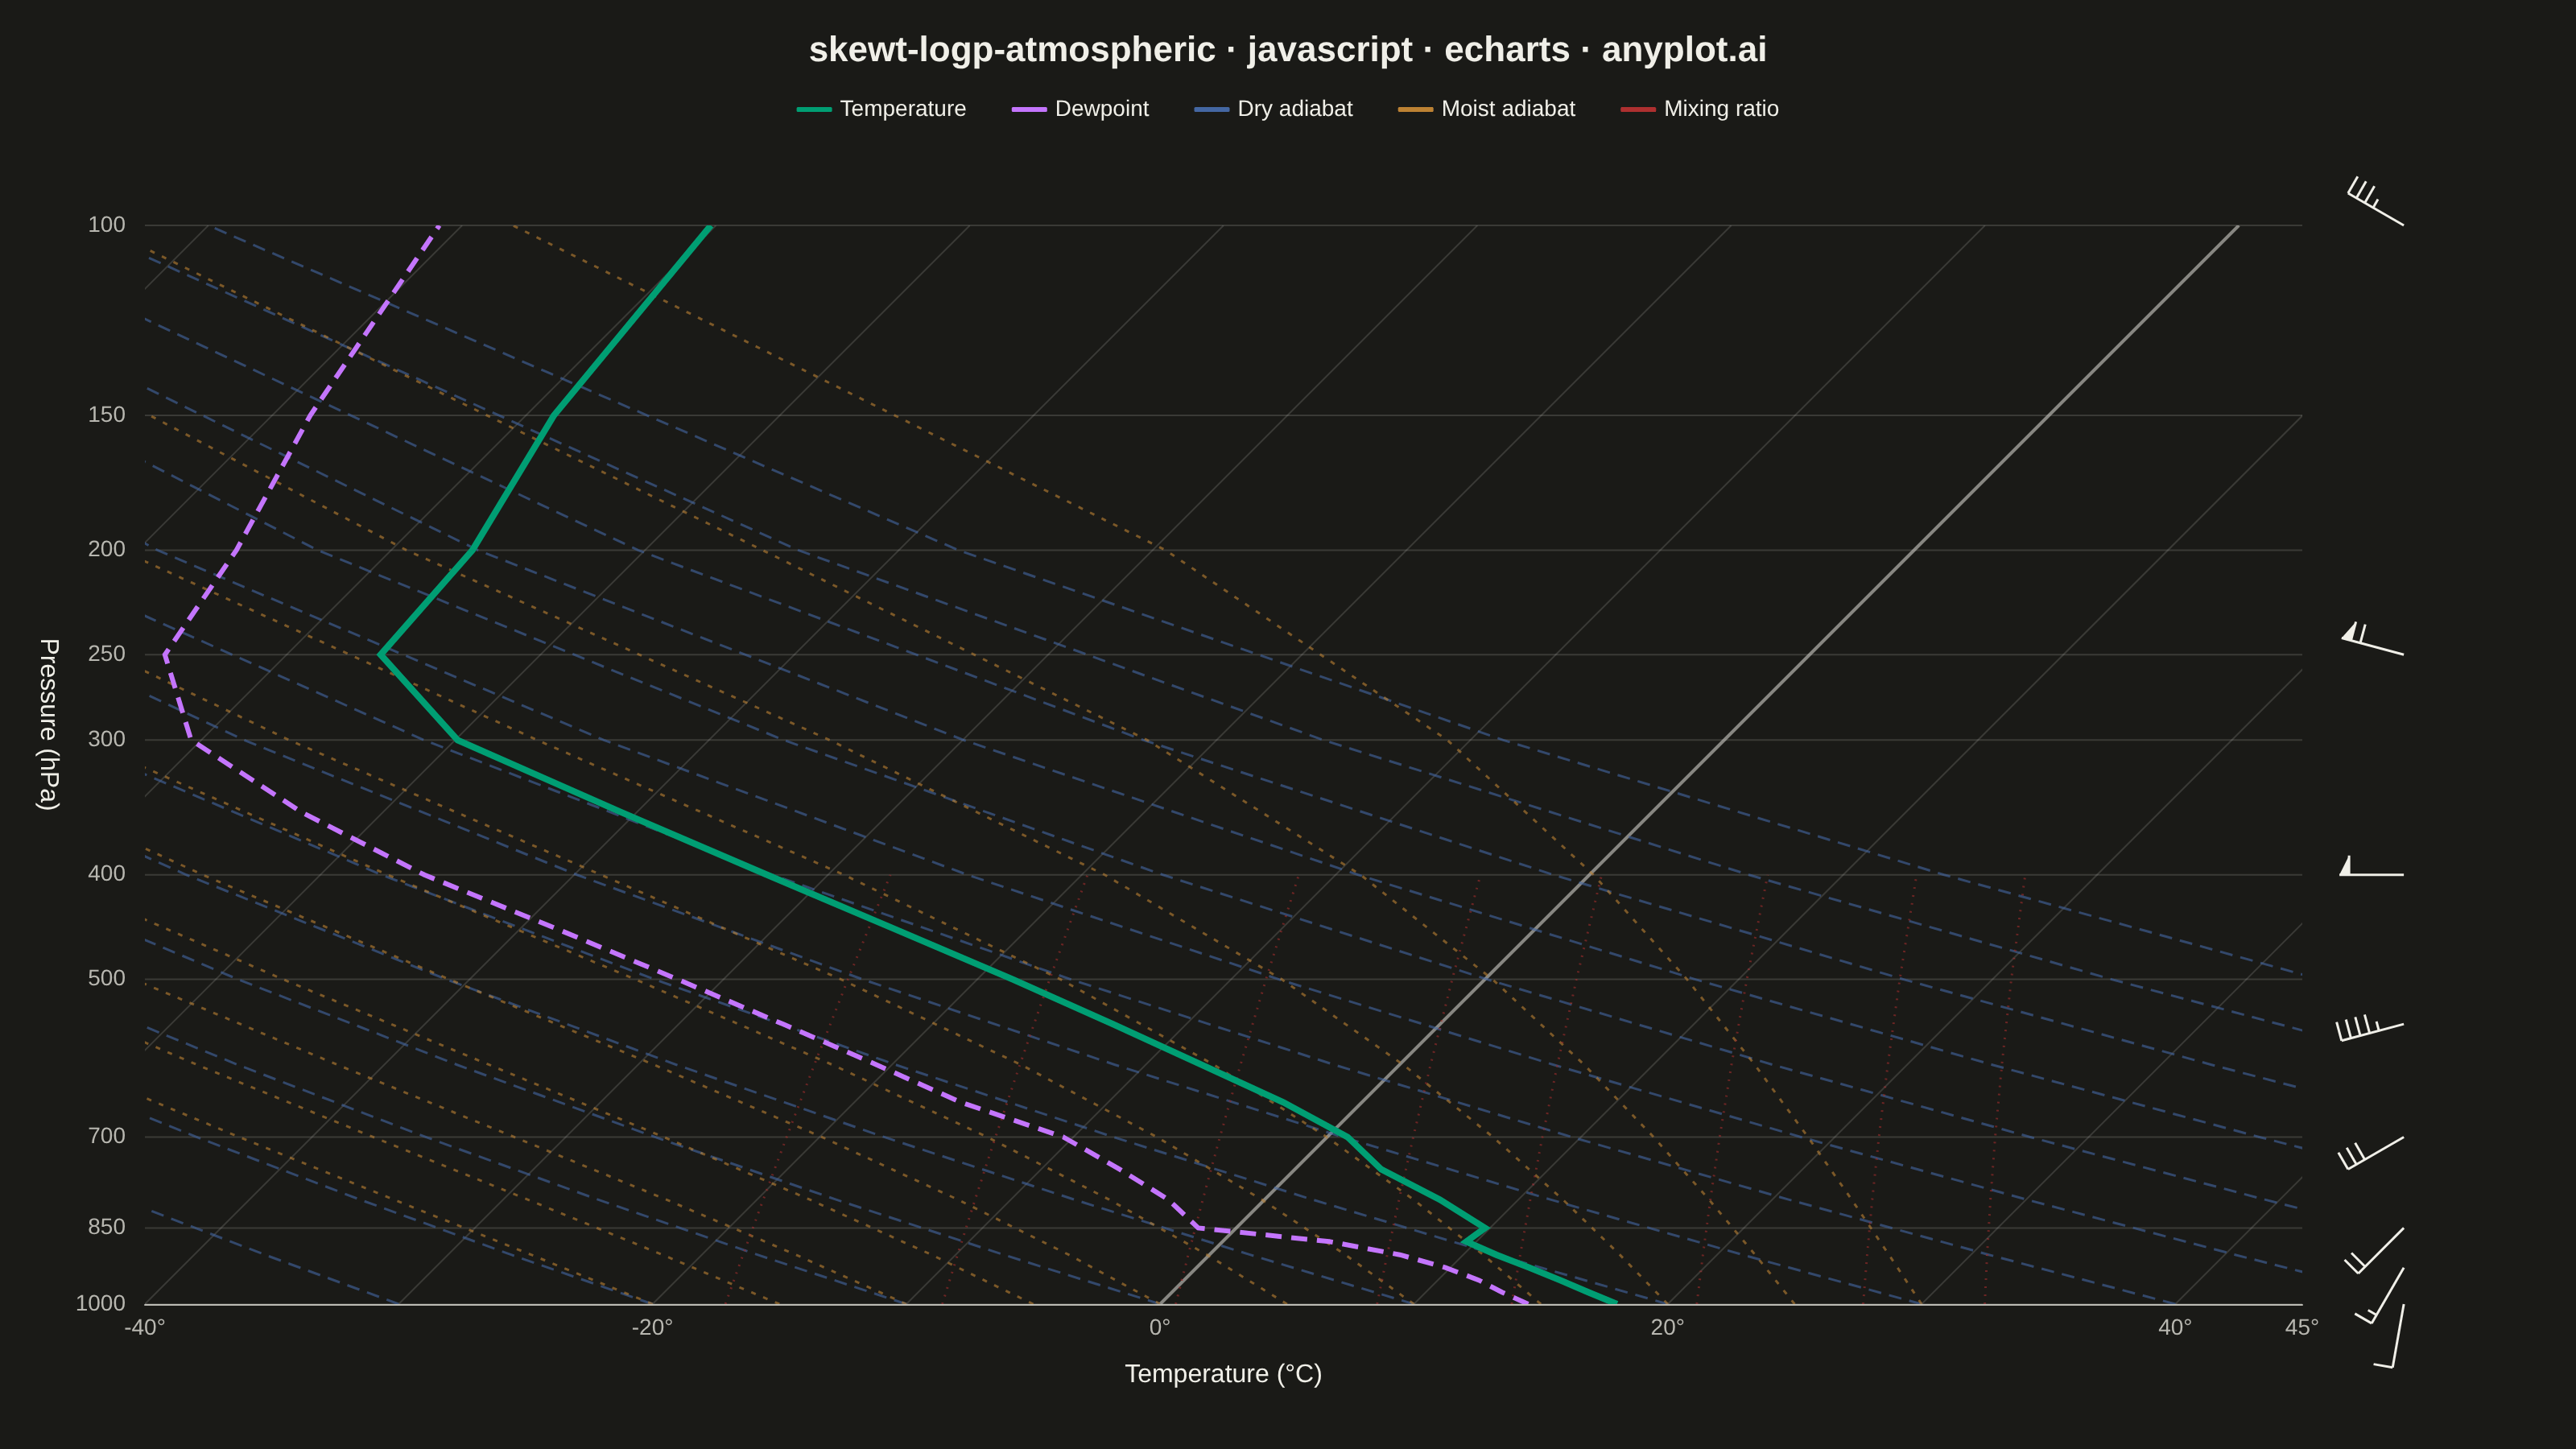
A Skew-T Log-P diagram is a specialized thermodynamic chart used in meteorology to display vertical atmospheric profiles. It features a logarithmic pressure axis (inverted, with surface at bottom) and temperature isotherms skewed 45 degrees to the right, allowing simultaneous visualization of temperature, dewpoint, and derived stability parameters. This diagram is essential for analyzing atmospheric soundings and assessing weather conditions.
// anyplot.ai
// skewt-logp-atmospheric: Skew-T Log-P Atmospheric Diagram
// Library: echarts 6.1.0 | JavaScript 22.23.2
// Quality: 95/100 | Created: 2026-08-26

//# anyplot-orientation: landscape
const t = window.ANYPLOT_TOKENS;

// ECharts has no native skew coordinate system. The pressure axis uses a real
// log/inverse yAxis (correct log-spaced geometry for free); the 45-degree
// temperature skew is applied manually in pixel space inside each custom
// series' renderItem: for a point at pixel height yPix, the x pixel is
// shifted right by SKEW * (bottomPixelY - yPix), so the shift is zero at the
// surface and grows linearly with height (SKEW = 1 gives exactly 45deg).
const SKEW = 1;
const P_BOTTOM = 1000;
const P_TOP = 100;
const X_MIN = -40;
const X_MAX = 45;

// --- Thermodynamics helpers (Bolton 1980 approximations) -------------------
function satVaporPressure(tempC) {
  return 6.112 * Math.exp((17.67 * tempC) / (tempC + 243.5)); // hPa
}
function satMixingRatio(tempC, pressureHpa) {
  const es = satVaporPressure(tempC);
  return (622 * es) / (pressureHpa - es); // g/kg
}
function tempFromVaporPressure(es) {
  const logTerm = Math.log(es / 6.112);
  return (243.5 * logTerm) / (17.67 - logTerm); // Celsius
}
function dryAdiabatTemp(thetaK, pressureHpa) {
  return thetaK * Math.pow(pressureHpa / 1000, 0.286) - 273.15;
}
function moistAdiabatCurve(startTempC, pressures) {
  const Rd = 287.0;
  const Cp = 1004.0;
  const Lv = 2.501e6;
  const eps = 0.622;
  const points = [[startTempC, P_BOTTOM]];
  let tempK = startTempC + 273.15;
  let pressure = P_BOTTOM;
  for (let i = 1; i < pressures.length; i++) {
    const targetPressure = pressures[i];
    const substeps = 8;
    const dP = (targetPressure - pressure) / substeps;
    for (let s = 0; s < substeps; s++) {
      const tempC = tempK - 273.15;
      const ws = satMixingRatio(tempC, pressure) / 1000; // kg/kg
      const numerator = Rd * tempK + Lv * ws;
      const denominator = pressure * (Cp + (Lv * Lv * ws * eps) / (Rd * tempK * tempK));
      tempK += (numerator / denominator) * dP;
      pressure += dP;
    }
    points.push([tempK - 273.15, targetPressure]);
  }
  return points;
}

// --- Sounding data (deterministic synthetic radiosonde profile) ------------
// Surface-based boundary layer, a shallow inversion near 850 hPa, then
// near-moist-adiabatic cooling through the mid-troposphere into a cold,
// dry stratospheric layer above the tropopause.
const pressureLevels = [
  1000, 975, 950, 925, 900, 875, 850, 800, 750, 700, 650, 600, 550, 500, 450,
  400, 350, 300, 250, 200, 150, 100,
];
const temperature = [
  18.0, 16.4, 14.8, 13.1, 11.3, 9.6, 9.8, 6.9, 3.4, 0.8, -3.1, -7.8, -12.9,
  -18.6, -25.1, -32.4, -40.6, -49.9, -56.3, -56.8, -58.9, -60.2,
];
const dewpoint = [
  14.5, 13.0, 11.6, 9.8, 7.5, 4.2, -1.5, -3.8, -6.9, -10.4, -15.8, -20.6,
  -25.9, -31.8, -38.4, -45.9, -53.2, -60.4, -64.8, -66.1, -68.5, -70.9,
];
const windSpeed = [
  8, 10, 12, 15, 17, 19, 22, 25, 28, 32, 36, 40, 45, 50, 55, 62, 68, 74, 70,
  60, 45, 35,
];
const windDirection = [
  190, 200, 205, 210, 215, 220, 225, 230, 235, 240, 245, 250, 255, 260, 265,
  270, 275, 280, 285, 290, 295, 300,
];

// --- Reference-line families -------------------------------------------------
const isotherms = [];
for (let tempC = -100; tempC <= 50; tempC += 10) {
  isotherms.push([
    [tempC, P_BOTTOM],
    [tempC, P_TOP],
  ]);
}

const dryAdiabatPressures = [1000, 900, 800, 700, 600, 500, 400, 300, 200, 100];
const dryAdiabats = [];
for (let thetaC = -30; thetaC <= 100; thetaC += 10) {
  const thetaK = thetaC + 273.15;
  dryAdiabats.push(dryAdiabatPressures.map((p) => [dryAdiabatTemp(thetaK, p), p]));
}

const moistAdiabatPressures = [1000, 900, 800, 700, 600, 500, 400, 300, 200, 100];
const moistAdiabats = [];
for (let startTempC = -20; startTempC <= 30; startTempC += 5) {
  moistAdiabats.push(moistAdiabatCurve(startTempC, moistAdiabatPressures));
}

const mixingRatioPressures = [1000, 900, 800, 700, 600, 500, 400];
const mixingRatios = [];
for (const w of [1, 2, 4, 7, 10, 16, 24, 32]) {
  mixingRatios.push(
    mixingRatioPressures.map((p) => {
      const es = (w * p) / (622 + w);
      return [tempFromVaporPressure(es), p];
    })
  );
}

const temperaturePoints = pressureLevels.map((p, i) => [temperature[i], p]);
const dewpointPoints = pressureLevels.map((p, i) => [dewpoint[i], p]);

const pressureGridLevels = [1000, 850, 700, 500, 400, 300, 250, 200, 150, 100];
const barbIndices = [0, 3, 6, 9, 12, 15, 18, 21];
const WIND_LANE_T = X_MAX + 4;
const BARB_SHAFT_LEN = 40;
const BARB_TICK_LEN = 12;
const BARB_TICK_GAP = 6;

// --- Skew transform + shape builders -----------------------------------------
function skewPoint(api, tempC, pressureHpa, bottomPixelY) {
  const coord = api.coord([tempC, pressureHpa]);
  const shift = SKEW * (bottomPixelY - coord[1]);
  return [coord[0] + shift, coord[1]];
}
function makeLineFamilyRenderer(lines, style) {
  return function renderItem(params, api) {
    const bottomPixelY = api.coord([0, P_BOTTOM])[1];
    const points = lines[params.dataIndex].map((pt) => skewPoint(api, pt[0], pt[1], bottomPixelY));
    const isFreezing = lines[params.dataIndex][0][0] === 0 && lines[params.dataIndex][1][0] === 0;
    return {
      type: "polyline",
      shape: { points },
      style: isFreezing ? { ...style, stroke: t.inkSoft, lineWidth: 2, opacity: 0.7 } : style,
    };
  };
}
function windBarbShapes(anchorX, anchorY, speedKt, directionDeg) {
  const dirRad = (directionDeg * Math.PI) / 180;
  const ux = Math.sin(dirRad);
  const uy = -Math.cos(dirRad);
  const px = -uy;
  const py = ux;
  const tipX = anchorX + ux * BARB_SHAFT_LEN;
  const tipY = anchorY + uy * BARB_SHAFT_LEN;
  const stepFrac = BARB_TICK_GAP / BARB_SHAFT_LEN;
  const tickBase = (step) => {
    const frac = 1 - step * stepFrac;
    return [anchorX + ux * BARB_SHAFT_LEN * frac, anchorY + uy * BARB_SHAFT_LEN * frac];
  };

  const children = [
    {
      type: "line",
      shape: { x1: anchorX, y1: anchorY, x2: tipX, y2: tipY },
      style: { stroke: t.ink, lineWidth: 1.5 },
    },
  ];

  let speed = Math.round(speedKt / 5) * 5;
  const pennants = Math.floor(speed / 50);
  speed -= pennants * 50;
  const fullBarbs = Math.floor(speed / 10);
  speed -= fullBarbs * 10;
  const halfBarb = speed >= 5 ? 1 : 0;

  let step = 0;
  for (let i = 0; i < pennants; i++) {
    const [bx, by] = tickBase(step);
    const [ix, iy] = tickBase(step + 1);
    children.push({
      type: "polygon",
      shape: {
        points: [
          [bx, by],
          [ix, iy],
          [ix + px * BARB_TICK_LEN, iy + py * BARB_TICK_LEN],
        ],
      },
      style: { fill: t.ink, stroke: "none" },
    });
    step += 1;
  }
  for (let i = 0; i < fullBarbs; i++) {
    const [bx, by] = tickBase(step);
    children.push({
      type: "line",
      shape: { x1: bx, y1: by, x2: bx + px * BARB_TICK_LEN, y2: by + py * BARB_TICK_LEN },
      style: { stroke: t.ink, lineWidth: 1.5 },
    });
    step += 1;
  }
  if (halfBarb) {
    const [bx, by] = tickBase(step);
    children.push({
      type: "line",
      shape: {
        x1: bx,
        y1: by,
        x2: bx + (px * BARB_TICK_LEN) / 2,
        y2: by + (py * BARB_TICK_LEN) / 2,
      },
      style: { stroke: t.ink, lineWidth: 1.5 },
    });
  }
  return children;
}

// --- Chart ---------------------------------------------------------------
const chart = echarts.init(document.getElementById("container"));

chart.setOption({
  animation: false,
  backgroundColor: "transparent",
  title: {
    text: "skewt-logp-atmospheric · javascript · echarts · anyplot.ai",
    left: "center",
    top: 16,
    textStyle: { color: t.ink, fontSize: 22 },
  },
  legend: {
    top: 56,
    left: "center",
    orient: "horizontal",
    itemGap: 28,
    itemWidth: 22,
    itemHeight: 3,
    selectedMode: false,
    textStyle: { color: t.ink, fontSize: 14 },
    data: [
      { name: "Temperature", itemStyle: { color: t.palette[0] } },
      { name: "Dewpoint", itemStyle: { color: t.palette[1] } },
      { name: "Dry adiabat", itemStyle: { color: t.palette[2] } },
      { name: "Moist adiabat", itemStyle: { color: t.palette[3] } },
      { name: "Mixing ratio", itemStyle: { color: t.palette[4] } },
    ],
  },
  grid: { left: 90, right: 170, top: 140, bottom: 90 },
  xAxis: {
    type: "value",
    min: X_MIN,
    max: X_MAX,
    name: "Temperature (°C)",
    nameLocation: "middle",
    nameGap: 36,
    nameTextStyle: { color: t.ink, fontSize: 16 },
    axisLabel: { color: t.inkSoft, fontSize: 14, formatter: "{value}°" },
    axisLine: { lineStyle: { color: t.inkSoft } },
    axisTick: { show: false },
    splitLine: { show: false },
  },
  yAxis: {
    type: "log",
    logBase: 10,
    inverse: true,
    min: P_TOP,
    max: P_BOTTOM,
    axisLine: { show: false },
    axisLabel: { show: false },
    axisTick: { show: false },
    minorTick: { show: false },
    splitLine: { show: false },
    minorSplitLine: { show: false },
  },
  graphic: [
    {
      type: "text",
      left: 22,
      top: "middle",
      rotation: -Math.PI / 2,
      style: { text: "Pressure (hPa)", fill: t.ink, fontSize: 16, align: "center" },
    },
  ],
  series: [
    {
      name: "Pressure grid",
      type: "custom",
      coordinateSystem: "cartesian2d",
      xAxisIndex: 0,
      yAxisIndex: 0,
      data: pressureGridLevels,
      renderItem: (params, api) => {
        const level = pressureGridLevels[params.dataIndex];
        const left = api.coord([X_MIN, level]);
        const right = api.coord([X_MAX, level]);
        return {
          type: "group",
          silent: true,
          children: [
            {
              type: "line",
              shape: { x1: left[0], y1: left[1], x2: right[0], y2: right[1] },
              style: { stroke: t.grid, lineWidth: 1 },
            },
            {
              type: "text",
              style: {
                text: String(level),
                x: left[0] - 12,
                y: left[1],
                fill: t.inkSoft,
                fontSize: 14,
                align: "right",
                verticalAlign: "middle",
              },
            },
          ],
        };
      },
    },
    {
      name: "Isotherms",
      type: "custom",
      coordinateSystem: "cartesian2d",
      clip: true,
      data: isotherms.map((_, i) => i),
      renderItem: makeLineFamilyRenderer(isotherms, { stroke: t.grid, lineWidth: 1, fill: "none" }),
    },
    {
      name: "Dry adiabat",
      type: "custom",
      coordinateSystem: "cartesian2d",
      clip: true,
      data: dryAdiabats.map((_, i) => i),
      renderItem: makeLineFamilyRenderer(dryAdiabats, {
        stroke: t.palette[2],
        lineWidth: 1.5,
        lineDash: [8, 5],
        opacity: 0.6,
        fill: "none",
      }),
    },
    {
      name: "Moist adiabat",
      type: "custom",
      coordinateSystem: "cartesian2d",
      clip: true,
      data: moistAdiabats.map((_, i) => i),
      renderItem: makeLineFamilyRenderer(moistAdiabats, {
        stroke: t.palette[3],
        lineWidth: 1.5,
        lineDash: [3, 5],
        opacity: 0.6,
        fill: "none",
      }),
    },
    {
      name: "Mixing ratio",
      type: "custom",
      coordinateSystem: "cartesian2d",
      clip: true,
      data: mixingRatios.map((_, i) => i),
      renderItem: makeLineFamilyRenderer(mixingRatios, {
        stroke: t.palette[4],
        lineWidth: 1.5,
        lineDash: [1, 4],
        opacity: 0.55,
        fill: "none",
      }),
    },
    {
      name: "Dewpoint",
      type: "custom",
      coordinateSystem: "cartesian2d",
      clip: true,
      data: [0],
      renderItem: (params, api) => {
        const bottomPixelY = api.coord([0, P_BOTTOM])[1];
        const points = dewpointPoints.map((pt) => skewPoint(api, pt[0], pt[1], bottomPixelY));
        return {
          type: "polyline",
          shape: { points },
          style: { stroke: t.palette[1], lineWidth: 3, lineDash: [10, 6], fill: "none" },
        };
      },
    },
    {
      name: "Temperature",
      type: "custom",
      coordinateSystem: "cartesian2d",
      clip: true,
      data: [0],
      renderItem: (params, api) => {
        const bottomPixelY = api.coord([0, P_BOTTOM])[1];
        const points = temperaturePoints.map((pt) => skewPoint(api, pt[0], pt[1], bottomPixelY));
        return {
          type: "polyline",
          shape: { points },
          style: { stroke: t.palette[0], lineWidth: 4, fill: "none" },
        };
      },
    },
    {
      name: "Wind barbs",
      type: "custom",
      coordinateSystem: "cartesian2d",
      data: barbIndices,
      renderItem: (params, api) => {
        const index = barbIndices[params.dataIndex];
        const anchor = api.coord([WIND_LANE_T, pressureLevels[index]]);
        return {
          type: "group",
          silent: true,
          children: windBarbShapes(anchor[0], anchor[1], windSpeed[index], windDirection[index]),
        };
      },
    },
  ],
});
Runnable source as JSON, for any HTTP client: https://api.anyplot.ai/specs/skewt-logp-atmospheric/echarts/code. Any spec id and library id listed in llms-full.txt fit the same URL shape; every URL below is complete and callable.
{
  "spec_id": "skewt-logp-atmospheric",
  "language": "javascript",
  "library": "echarts",
  "page": "https://anyplot.ai/skewt-logp-atmospheric/javascript/echarts",
  "hub": "https://anyplot.ai/skewt-logp-atmospheric",
  "code_json": "https://api.anyplot.ai/specs/skewt-logp-atmospheric/echarts/code",
  "spec_json": "https://api.anyplot.ai/specs/skewt-logp-atmospheric",
  "render_light_png": "https://storage.googleapis.com/anyplot-images/plots/skewt-logp-atmospheric/javascript/echarts/plot-light.png",
  "render_dark_png": "https://storage.googleapis.com/anyplot-images/plots/skewt-logp-atmospheric/javascript/echarts/plot-dark.png",
  "interactive_light_html": "https://storage.googleapis.com/anyplot-images/plots/skewt-logp-atmospheric/javascript/echarts/plot-light.html",
  "interactive_dark_html": "https://storage.googleapis.com/anyplot-images/plots/skewt-logp-atmospheric/javascript/echarts/plot-dark.html",
  "quality_score": 95.0,
  "license": "MIT",
  "guide": "https://anyplot.ai/llms.txt"
}
Part of Skew-T Log-P Atmospheric Diagram on anyplot.ai.