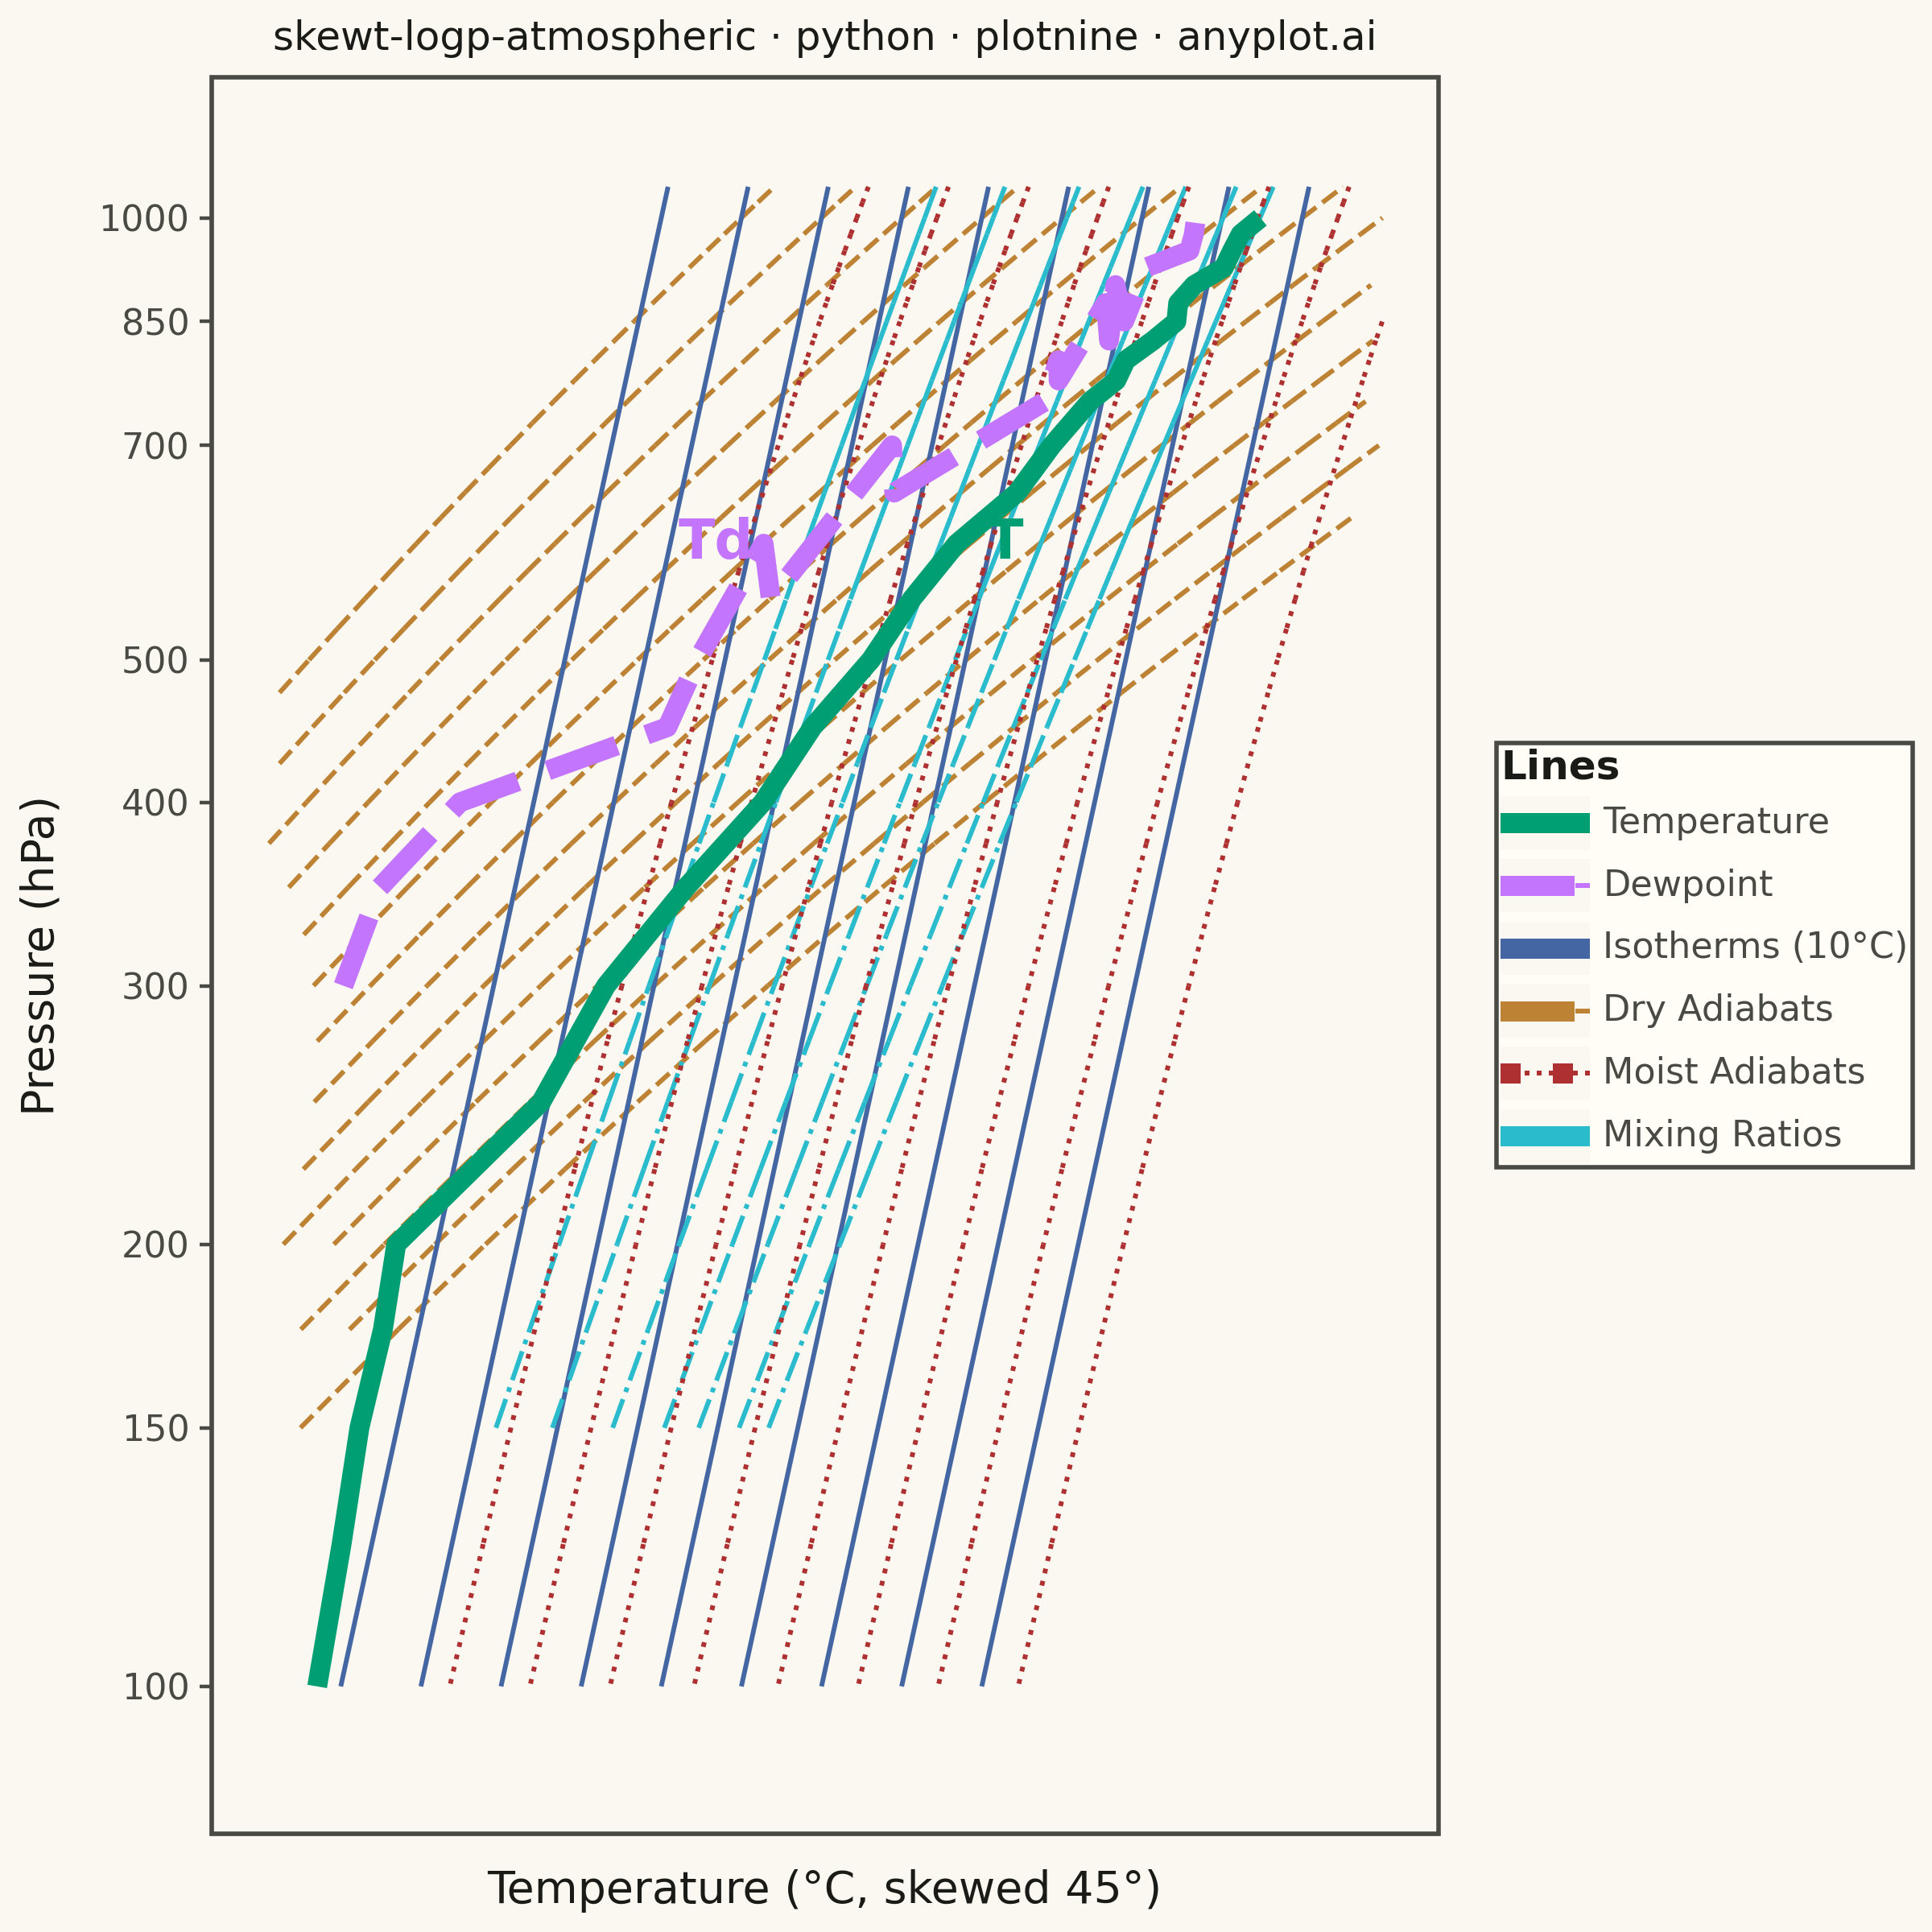
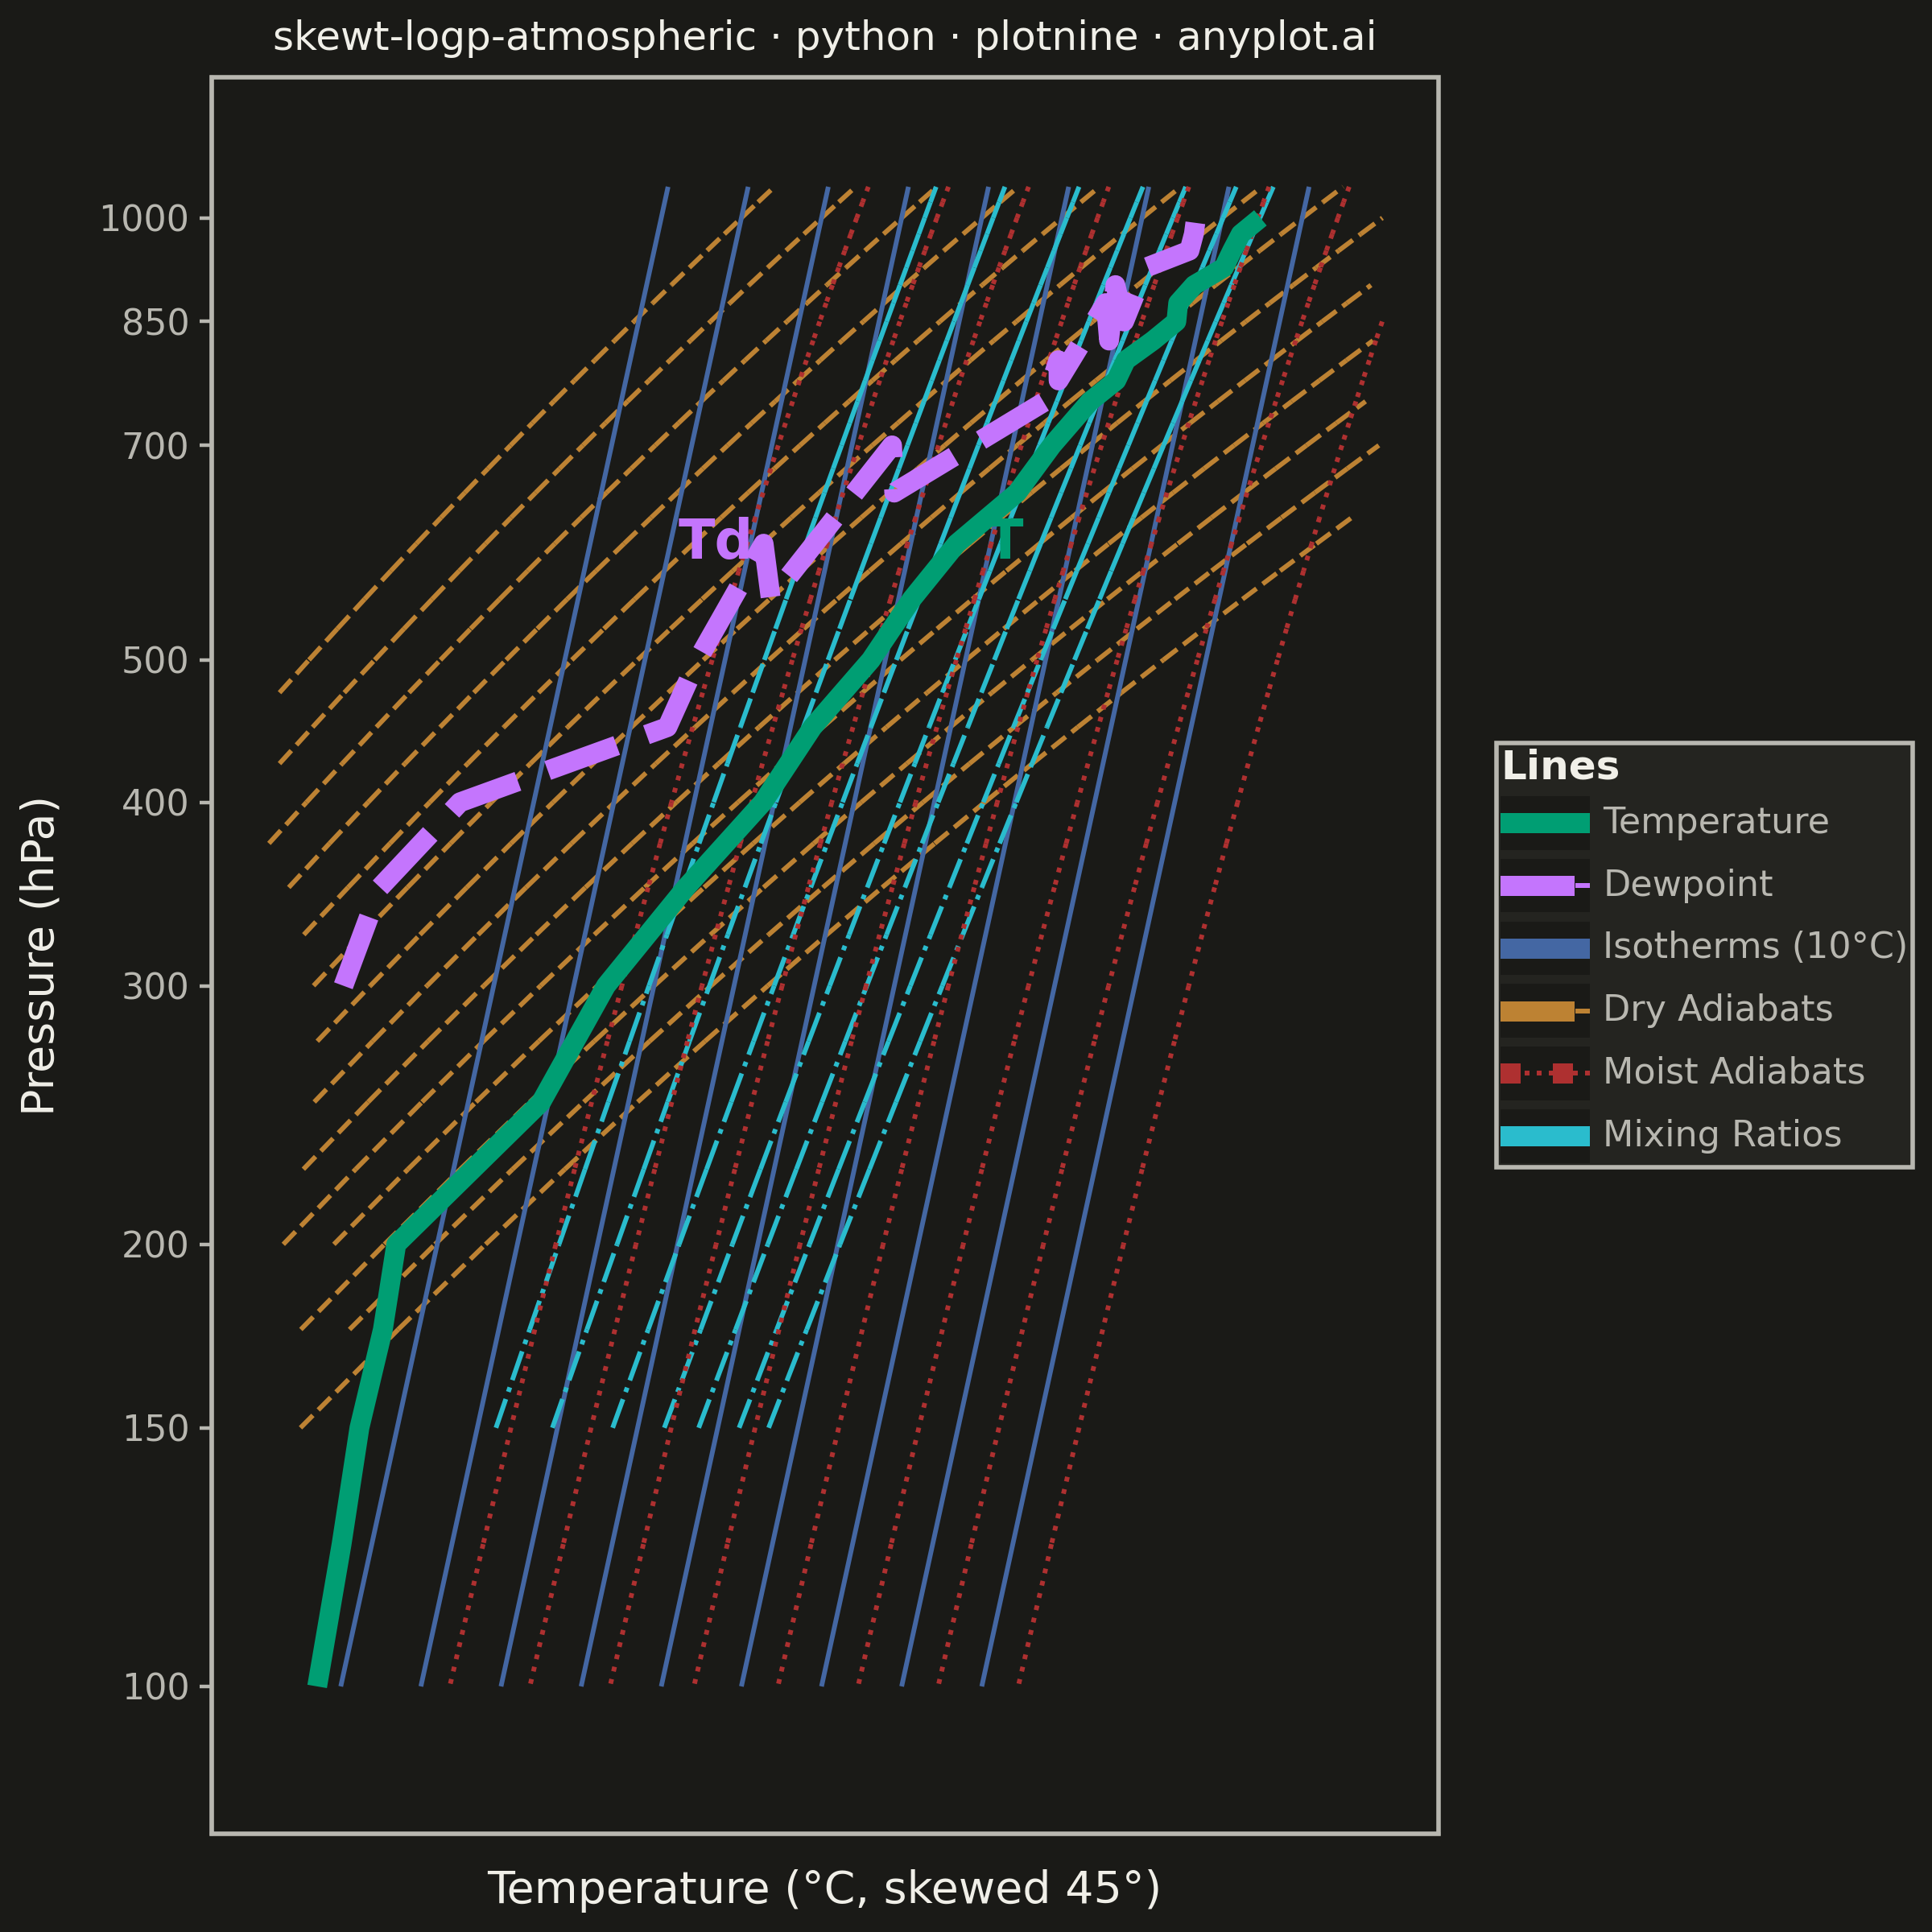
A Skew-T Log-P diagram is a specialized thermodynamic chart used in meteorology to display vertical atmospheric profiles. It features a logarithmic pressure axis (inverted, with surface at bottom) and temperature isotherms skewed 45 degrees to the right, allowing simultaneous visualization of temperature, dewpoint, and derived stability parameters. This diagram is essential for analyzing atmospheric soundings and assessing weather conditions.
""" anyplot.ai
skewt-logp-atmospheric: Skew-T Log-P Atmospheric Diagram
Library: plotnine 0.15.4 | Python 3.13.13
Quality: 84/100 | Updated: 2026-05-21
"""

import os

import numpy as np
import pandas as pd
from plotnine import (
    aes,
    annotate,
    element_blank,
    element_line,
    element_rect,
    element_text,
    geom_line,
    geom_segment,
    ggplot,
    labs,
    scale_color_manual,
    scale_linetype_manual,
    scale_x_continuous,
    scale_y_continuous,
    theme,
)


# Theme tokens
THEME = os.getenv("ANYPLOT_THEME", "light")
PAGE_BG = "#FAF8F1" if THEME == "light" else "#1A1A17"
ELEVATED_BG = "#FFFDF6" if THEME == "light" else "#242420"
INK = "#1A1A17" if THEME == "light" else "#F0EFE8"
INK_SOFT = "#4A4A44" if THEME == "light" else "#B8B7B0"

# Skew-T transformation parameters
SKEW_FACTOR = np.tan(np.radians(45))  # ~1.0 for 45-degree isotherms
P_SURFACE = 1000  # Reference pressure (hPa)
P_MIN = 100
P_MAX = 1050
T_MIN = -80
T_MAX = 50


def skew_transform(temp, pressure):
    log_p = np.log10(pressure / P_SURFACE)
    return temp + SKEW_FACTOR * log_p * 40


# Generate synthetic atmospheric sounding data
np.random.seed(42)

pressure_levels = np.array(
    [
        1000,
        975,
        950,
        925,
        900,
        875,
        850,
        825,
        800,
        775,
        750,
        700,
        650,
        600,
        550,
        500,
        450,
        400,
        350,
        300,
        250,
        200,
        175,
        150,
        125,
        100,
    ]
)

# Temperature profile (realistic lapse rate with tropopause)
base_temp = 25
temp_profile = []
for p in pressure_levels:
    altitude_km = 44.3308 * (1 - (p / 1013.25) ** 0.190284)
    if p > 200:  # Troposphere
        t = base_temp - 6.5 * altitude_km + np.random.normal(0, 1)
    else:  # Stratosphere (isothermal/slight warming)
        t = -55 + (200 - p) * 0.02 + np.random.normal(0, 0.5)
    temp_profile.append(t)
temp_profile = np.array(temp_profile)

# Dewpoint profile (moisture decreases with altitude)
dewpoint_profile = []
for p, t in zip(pressure_levels, temp_profile, strict=True):
    if p > 700:
        depression = 5 + np.random.uniform(0, 5)
    elif p > 400:
        depression = 15 + np.random.uniform(0, 10)
    else:
        depression = 30 + np.random.uniform(0, 15)
    dewpoint_profile.append(min(t - depression, t))
dewpoint_profile = np.array(dewpoint_profile)

# Reference lines

# Isotherms (skewed 45°)
isotherm_data = []
for t_ref in np.arange(-100, 60, 10):
    p_range = np.array([P_MIN, P_MAX])
    xs = skew_transform(np.array([t_ref, t_ref]), p_range)
    isotherm_data.append({"x": xs[0], "xend": xs[1], "y": P_MIN, "yend": P_MAX, "line_type": "Isotherms (10°C)"})
isotherm_df = pd.DataFrame(isotherm_data)

# Isobars (horizontal reference lines — structural, no legend entry)
isobar_data = []
for p in [1000, 850, 700, 500, 300, 200, 100]:
    isobar_data.append({"x": skew_transform(T_MIN - 20, p), "xend": skew_transform(T_MAX + 20, p), "y": p, "yend": p})
isobar_df = pd.DataFrame(isobar_data)

# Dry adiabats (constant potential temperature)
dry_adiabat_data = []
for theta in np.arange(-40, 100, 10):
    pts_x, pts_y = [], []
    for p in np.arange(P_MIN, P_MAX + 1, 25):
        t = (theta + 273.15) * (p / 1000) ** 0.286 - 273.15
        pts_x.append(skew_transform(t, p))
        pts_y.append(p)
    for i in range(len(pts_x) - 1):
        dry_adiabat_data.append(
            {"x": pts_x[i], "xend": pts_x[i + 1], "y": pts_y[i], "yend": pts_y[i + 1], "line_type": "Dry Adiabats"}
        )
dry_adiabat_df = pd.DataFrame(dry_adiabat_data)

# Moist adiabats (saturated adiabatic lapse rate)
moist_adiabat_data = []
for theta_e in np.arange(-30, 50, 10):
    pts_x, pts_y = [], []
    t_cur = theta_e + 5
    for p in np.arange(P_MAX, P_MIN - 1, -25):
        pts_x.append(skew_transform(t_cur, p))
        pts_y.append(p)
        t_cur -= (5.5 if t_cur > 0 else 6.0) * 0.05
    for i in range(len(pts_x) - 1):
        moist_adiabat_data.append(
            {"x": pts_x[i], "xend": pts_x[i + 1], "y": pts_y[i], "yend": pts_y[i + 1], "line_type": "Moist Adiabats"}
        )
moist_adiabat_df = pd.DataFrame(moist_adiabat_data)

# Mixing ratio lines (constant saturation mixing ratio)
mixing_ratio_data = []
for w in [1, 2, 4, 7, 10, 15, 20]:
    pts_x, pts_y = [], []
    for p in np.arange(P_MIN + 50, P_MAX + 1, 25):
        e = w * p / (622 + w)
        if e > 0:
            td = (243.5 * np.log(e / 6.112)) / (17.67 - np.log(e / 6.112))
            if T_MIN - 20 < td < T_MAX + 20:
                pts_x.append(skew_transform(td, p))
                pts_y.append(p)
    if len(pts_x) > 1:
        for i in range(len(pts_x) - 1):
            mixing_ratio_data.append(
                {"x": pts_x[i], "xend": pts_x[i + 1], "y": pts_y[i], "yend": pts_y[i + 1], "line_type": "Mixing Ratios"}
            )
mixing_ratio_df = pd.DataFrame(mixing_ratio_data)

all_ref_lines = pd.concat([isotherm_df, dry_adiabat_df, moist_adiabat_df, mixing_ratio_df])

# Profile data — use "line_type" column (matches ref lines, enables unified legend)
temp_skewed = skew_transform(temp_profile, pressure_levels)
dewpoint_skewed = skew_transform(dewpoint_profile, pressure_levels)
profile_df = pd.DataFrame(
    {
        "pressure": np.concatenate([pressure_levels, pressure_levels]),
        "x": np.concatenate([temp_skewed, dewpoint_skewed]),
        "line_type": ["Temperature"] * len(pressure_levels) + ["Dewpoint"] * len(pressure_levels),
    }
)

x_min = skew_transform(T_MIN - 10, P_MAX)
x_max = skew_transform(T_MAX + 10, P_MIN)

pressure_breaks = [1000, 850, 700, 500, 400, 300, 200, 150, 100]
pressure_labels = [str(p) for p in pressure_breaks]

LEGEND_ORDER = ["Temperature", "Dewpoint", "Isotherms (10°C)", "Dry Adiabats", "Moist Adiabats", "Mixing Ratios"]
LINE_COLORS = {
    "Temperature": "#009E73",
    "Dewpoint": "#C475FD",
    "Isotherms (10°C)": "#4467A3",
    "Dry Adiabats": "#BD8233",
    "Moist Adiabats": "#AE3030",
    "Mixing Ratios": "#2ABCCD",
}
LINE_STYLES = {
    "Temperature": "solid",
    "Dewpoint": "dashed",
    "Isotherms (10°C)": "solid",
    "Dry Adiabats": "dashed",
    "Moist Adiabats": "dotted",
    "Mixing Ratios": "dashdot",
}

plot = (
    ggplot(profile_df, aes(x="x", y="pressure"))
    # Isobars first (background structural lines, no legend entry)
    + geom_segment(
        aes(x="x", xend="xend", y="y", yend="yend"),
        data=isobar_df,
        color=INK_SOFT,
        size=0.7,
        linetype="solid",
        inherit_aes=False,
    )
    # Reference lines with color/linetype aesthetic for legend
    + geom_segment(
        aes(x="x", xend="xend", y="y", yend="yend", color="line_type", linetype="line_type"),
        data=all_ref_lines,
        size=0.6,
        inherit_aes=False,
    )
    # Temperature and dewpoint profiles (drawn on top)
    + geom_line(
        aes(x="x", y="pressure", color="line_type", linetype="line_type", group="line_type"),
        data=profile_df,
        size=2.5,
        inherit_aes=False,
    )
    + scale_color_manual(values=LINE_COLORS, name="Lines", breaks=LEGEND_ORDER)
    + scale_linetype_manual(values=LINE_STYLES, name="Lines", breaks=LEGEND_ORDER)
    + scale_y_continuous(trans="log10", limits=(1100, 90), breaks=pressure_breaks, labels=pressure_labels)
    + scale_x_continuous(breaks=[], labels=[], limits=(x_min - 10, x_max + 20))
    + annotate(
        "text",
        x=skew_transform(temp_profile[np.argmin(np.abs(pressure_levels - 600))], 600) + 6,
        y=600,
        label="T",
        color="#009E73",
        size=12,
        fontweight="bold",
    )
    + annotate(
        "text",
        x=skew_transform(dewpoint_profile[np.argmin(np.abs(pressure_levels - 600))], 600) - 6,
        y=600,
        label="Td",
        color="#C475FD",
        size=12,
        fontweight="bold",
    )
    + labs(
        x="Temperature (°C, skewed 45°)",
        y="Pressure (hPa)",
        title="skewt-logp-atmospheric · python · plotnine · anyplot.ai",
    )
    + theme(
        figure_size=(6, 6),
        plot_background=element_rect(fill=PAGE_BG, color=PAGE_BG),
        panel_background=element_rect(fill=PAGE_BG),
        panel_grid_major=element_blank(),
        panel_grid_minor=element_blank(),
        panel_border=element_rect(color=INK_SOFT, fill=None),
        axis_line=element_line(color=INK_SOFT, size=0.8),
        text=element_text(size=7),
        axis_title=element_text(size=10, color=INK),
        axis_title_x=element_text(margin={"t": 8}),
        axis_title_y=element_text(margin={"r": 8}),
        axis_text_x=element_blank(),
        axis_ticks_major_x=element_blank(),
        axis_text_y=element_text(size=8, color=INK_SOFT),
        plot_title=element_text(size=9, ha="center", color=INK),
        legend_position="right",
        legend_title=element_text(size=9, fontweight="bold", color=INK),
        legend_text=element_text(size=8, color=INK_SOFT),
        legend_background=element_rect(fill=ELEVATED_BG, color=INK_SOFT),
        legend_key_width=20,
        legend_key_height=12,
        axis_ticks_major_y=element_line(color=INK_SOFT, size=0.8),
    )
)

plot.save(f"plot-{THEME}.png", dpi=400, width=6, height=6, units="in", verbose=False)
Runnable source as JSON, for any HTTP client: https://api.anyplot.ai/specs/skewt-logp-atmospheric/plotnine/code. Any spec id and library id listed in llms-full.txt fit the same URL shape; every URL below is complete and callable.
{
  "spec_id": "skewt-logp-atmospheric",
  "language": "python",
  "library": "plotnine",
  "page": "https://anyplot.ai/skewt-logp-atmospheric/python/plotnine",
  "hub": "https://anyplot.ai/skewt-logp-atmospheric",
  "code_json": "https://api.anyplot.ai/specs/skewt-logp-atmospheric/plotnine/code",
  "spec_json": "https://api.anyplot.ai/specs/skewt-logp-atmospheric",
  "render_light_png": "https://storage.googleapis.com/anyplot-images/plots/skewt-logp-atmospheric/python/plotnine/plot-light.png",
  "render_dark_png": "https://storage.googleapis.com/anyplot-images/plots/skewt-logp-atmospheric/python/plotnine/plot-dark.png",
  "quality_score": 84.0,
  "license": "MIT",
  "guide": "https://anyplot.ai/llms.txt"
}
Part of Skew-T Log-P Atmospheric Diagram on anyplot.ai.