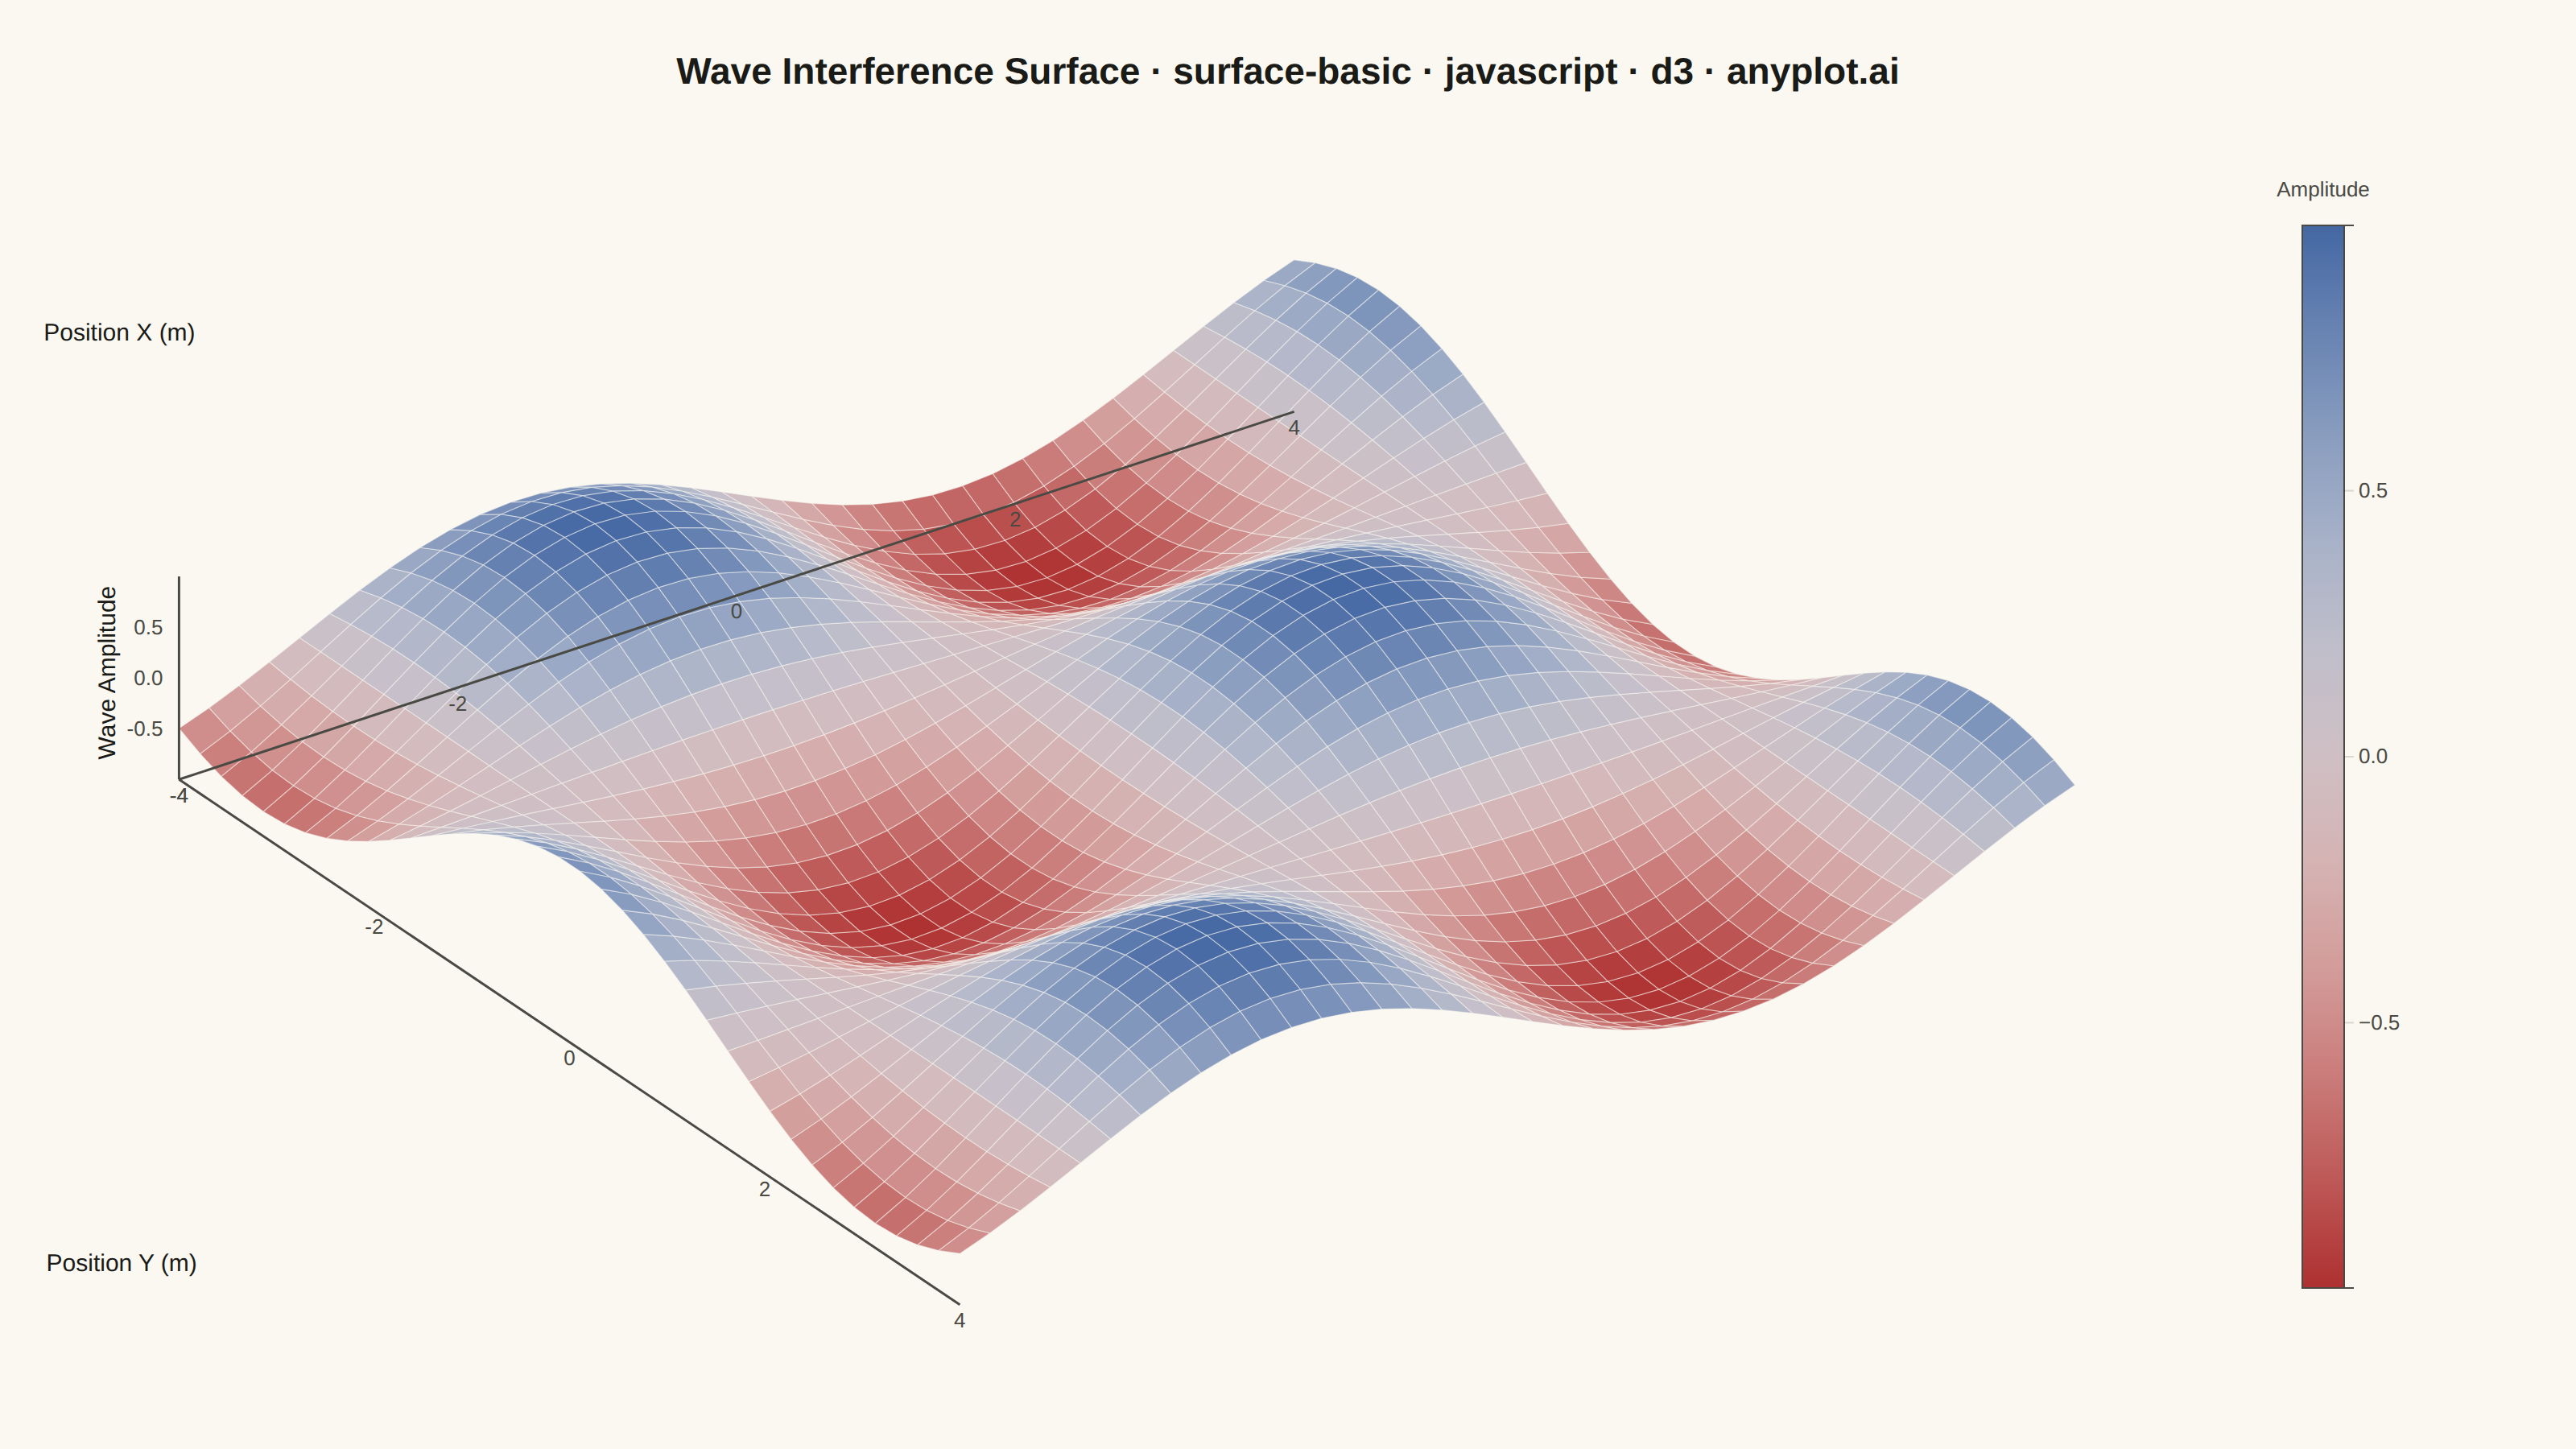
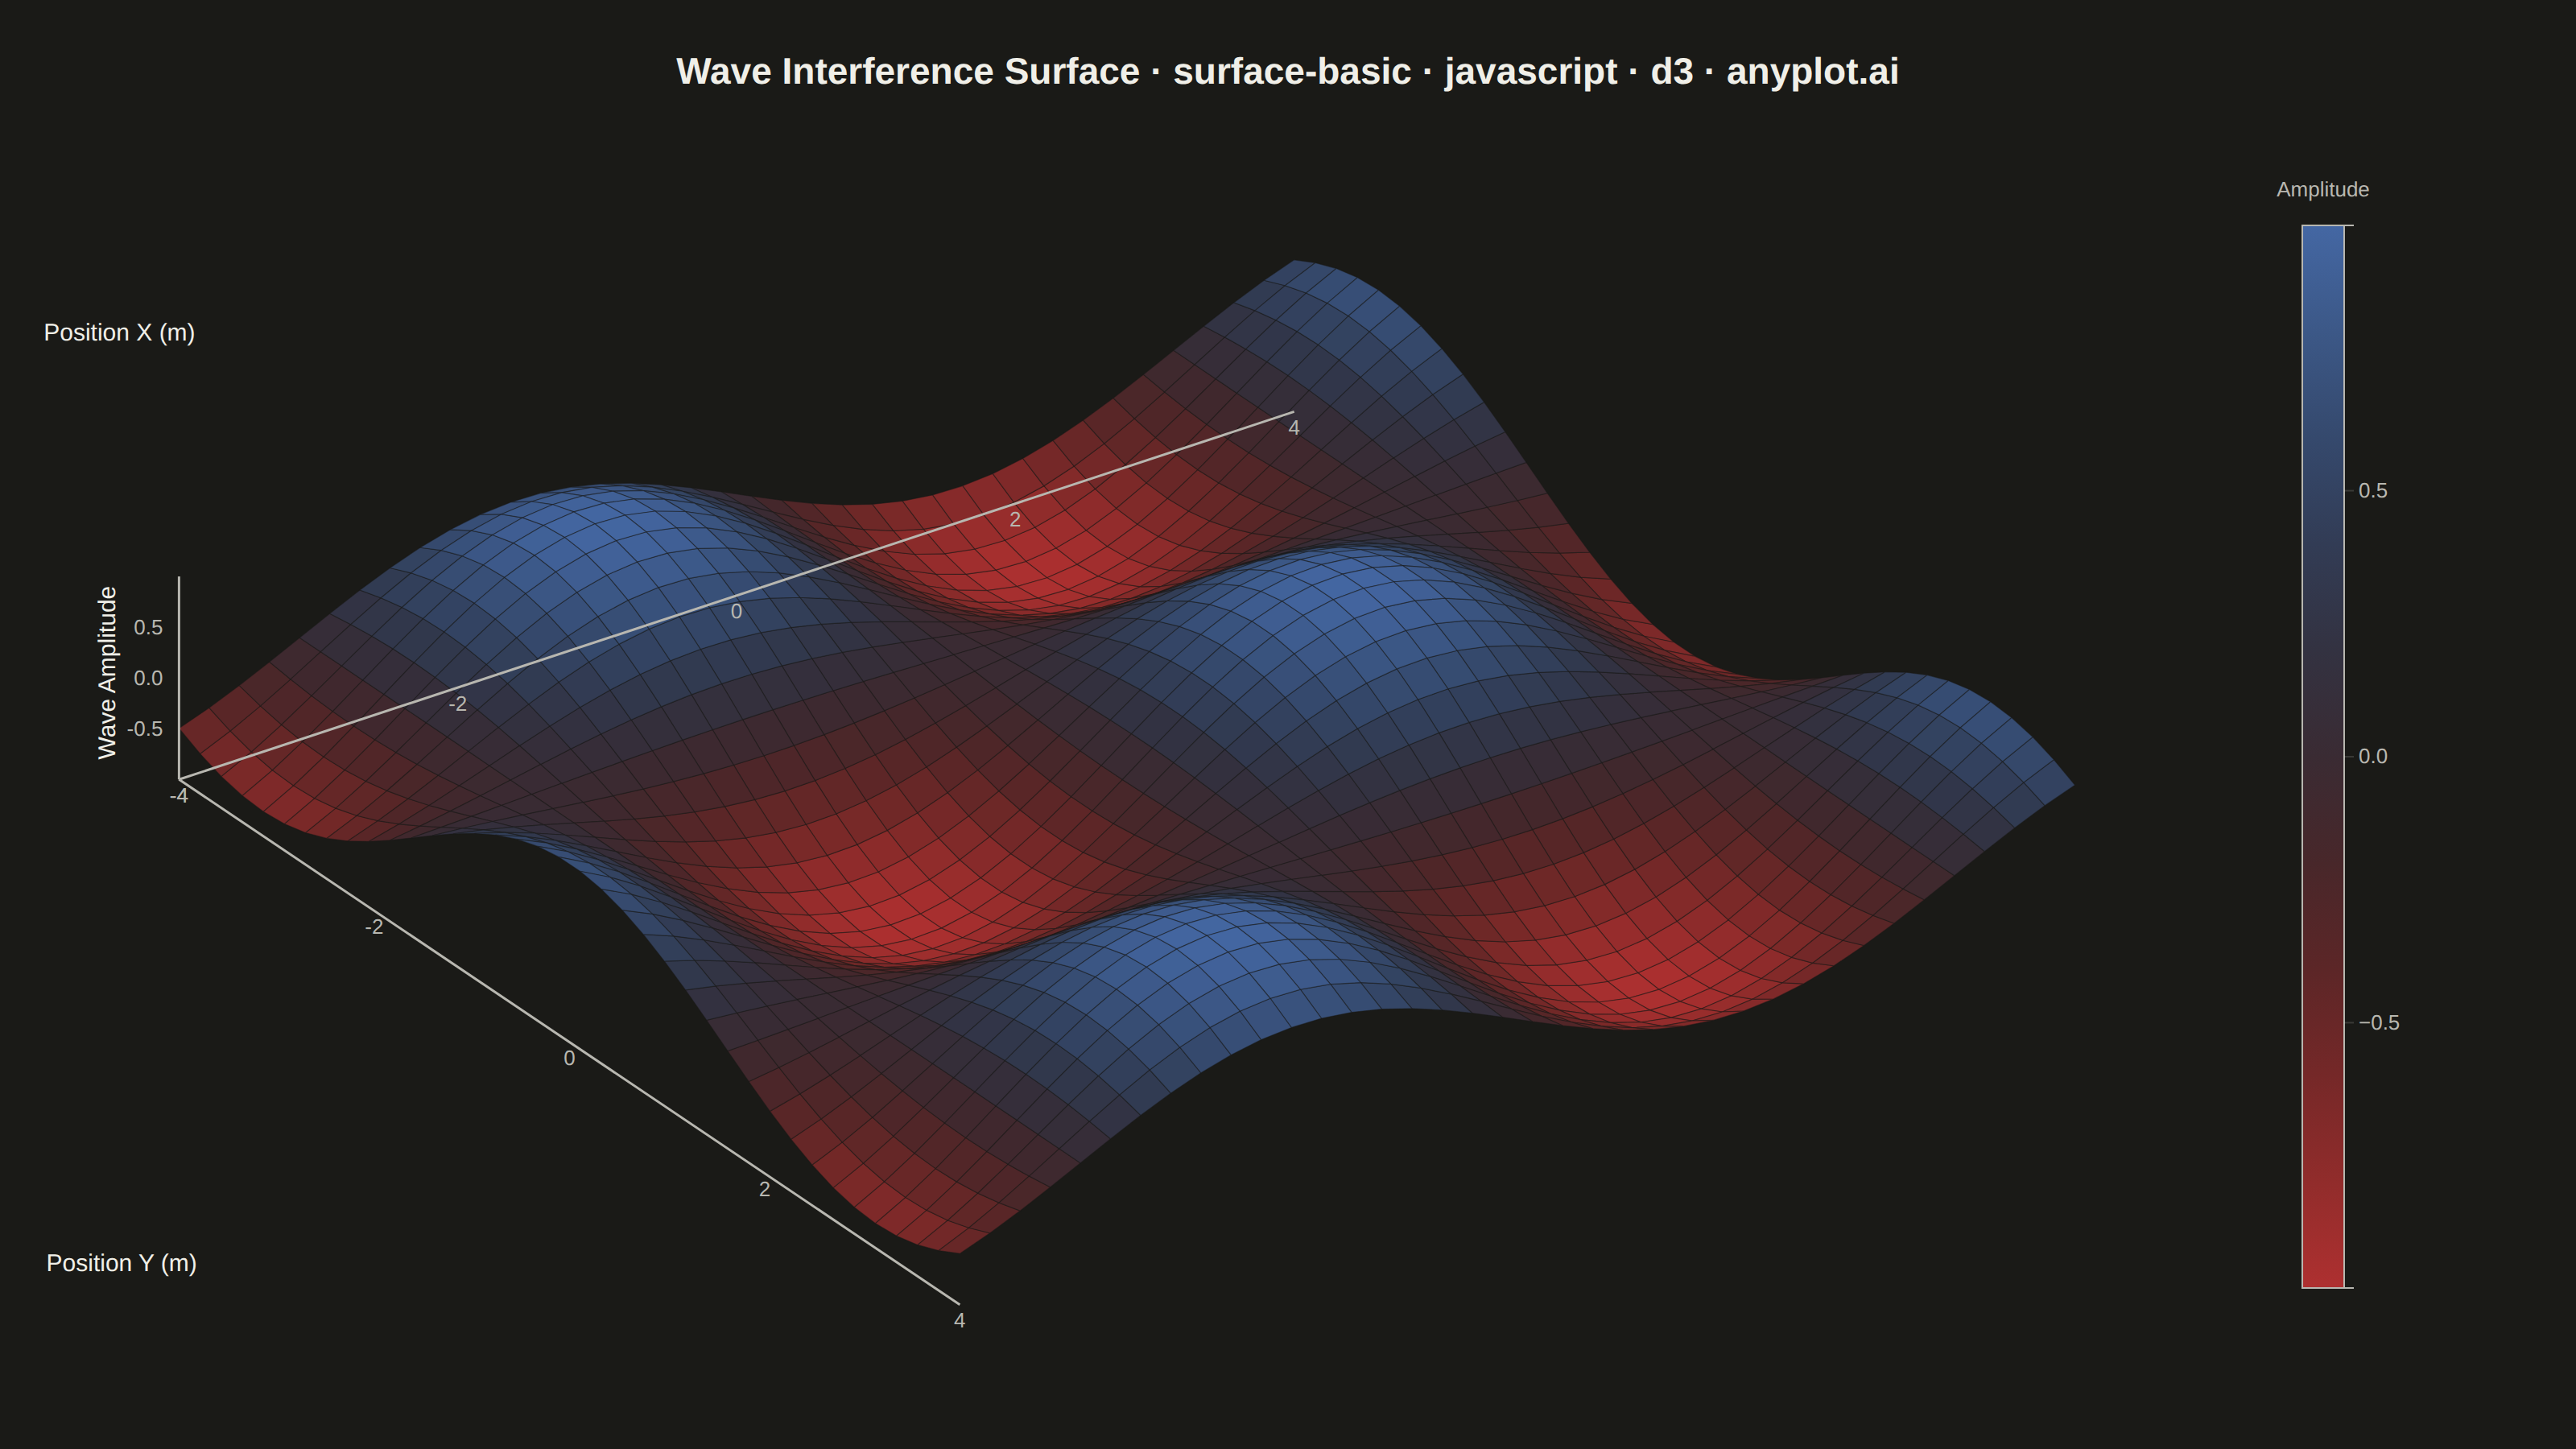
The same plot in 12 other libraries — JavaScript: Apache ECharts, Highcharts, MUI X Charts; Python: Altair, Bokeh, lets-plot, Matplotlib, Plotly, Pygal, Seaborn; R: ggplot2; Julia: Makie.jl. Compare all 13 side by side: Basic 3D Surface Plot in Python, R, Julia and JavaScript.
A 3D surface plot visualizes a function of two variables as a continuous surface in three-dimensional space. The height (z-axis) represents the function value at each (x, y) point, with color encoding the same information to enhance depth perception. This visualization is ideal for understanding mathematical functions, terrain data, and response surfaces where the relationship between two inputs and one output needs to be explored.
// anyplot.ai
// surface-basic: Basic 3D Surface Plot
// Library: d3 7.9.0 | JavaScript 22.23.2
// Quality: 86/100 | Created: 2026-09-10

const t = window.ANYPLOT_TOKENS;
const { width, height } = window.ANYPLOT_SIZE;
const margin = { top: 100, right: 260, bottom: 60, left: 60 };
const iw = width - margin.left - margin.right;
const ih = height - margin.top - margin.bottom;

// --- Data: standing-wave interference amplitude over a 2D membrane ---------
const GRID_N = 38;
const EXTENT = 4; // x, y span [-EXTENT, EXTENT]
const xs = d3.range(GRID_N).map((i) => -EXTENT + (2 * EXTENT * i) / (GRID_N - 1));
const ys = d3.range(GRID_N).map((j) => -EXTENT + (2 * EXTENT * j) / (GRID_N - 1));
const zGrid = xs.map((x) => ys.map((y) => Math.sin(x) * Math.cos(y)));
const zFlat = zGrid.flat();
const zMin = d3.min(zFlat);
const zMax = d3.max(zFlat);

// Vertical exaggeration so height variation reads clearly against the x/y span
const Z_SCALE = EXTENT * 0.65;
const zWorld = (z) => z * Z_SCALE;

// --- 3D projection: azimuth spin around Z, then elevation tilt around X ----
// Mutable so drag-to-rotate (below) can update the view and re-project.
let azimuth = (-35 * Math.PI) / 180;
let elevation = (26 * Math.PI) / 180;
const MIN_ELEVATION = (6 * Math.PI) / 180;
const MAX_ELEVATION = (80 * Math.PI) / 180;

function project(x, y, z, az, el) {
  const cosAz = Math.cos(az);
  const sinAz = Math.sin(az);
  const cosEl = Math.cos(el);
  const sinEl = Math.sin(el);
  // spin around the vertical (z) axis
  const x1 = x * cosAz - y * sinAz;
  const y1 = x * sinAz + y * cosAz;
  // tilt the spun frame around the (screen-horizontal) x axis
  const y2 = y1 * cosEl - z * sinEl;
  const depth = y1 * sinEl + z * cosEl;
  // A larger z (taller surface) must land at a smaller screen-y (render higher up).
  return { sx: x1, sy: y2, depth };
}

const originX = margin.left + iw / 2;
const originY = margin.top + ih / 2;

const axisCorner = [-EXTENT, -EXTENT, zWorld(zMin)];
const axisEnds = {
  x: [EXTENT, -EXTENT, zWorld(zMin)],
  y: [-EXTENT, EXTENT, zWorld(zMin)],
  z: [-EXTENT, -EXTENT, zWorld(zMax)],
};

// --- SVG mount ---------------------------------------------------------------
const svg = d3.select("#container").append("svg").attr("width", width).attr("height", height);
const surfaceG = svg.append("g").attr("class", "surface");
const axisG = svg.append("g").attr("class", "axes");

// --- Color scale (diverging: amplitude has a meaningful zero midpoint) ------
const absMax = Math.max(Math.abs(zMin), Math.abs(zMax));
const color = d3.scaleSequential(d3.interpolateRgbBasis(t.div)).domain([-absMax, absMax]);

const lineGen = d3.line();
const tickCounts = 5;
const xTicks = d3.scaleLinear().domain([-EXTENT, EXTENT]).ticks(tickCounts);
const yTicks = d3.scaleLinear().domain([-EXTENT, EXTENT]).ticks(tickCounts);
const zTicks = d3.scaleLinear().domain([zMin, zMax]).ticks(tickCounts);

// Re-projects and redraws the surface + axis triad for the current
// azimuth/elevation — called once up front and again on every drag step.
function render() {
  const proj = (x, y, z) => project(x, y, z, azimuth, elevation);

  // Bounding box in projected model space, used to fit the surface into iw x
  // ih. x/y use independent scale factors (a stylized isometric-like
  // projection, not a physical camera) so the surface fills the canvas.
  const corners = [];
  for (const x of [-EXTENT, EXTENT]) {
    for (const y of [-EXTENT, EXTENT]) {
      for (const z of [zWorld(zMin), zWorld(zMax)]) corners.push(proj(x, y, z));
    }
  }
  const sxExtent = d3.extent(corners, (d) => d.sx);
  const syExtent = d3.extent(corners, (d) => d.sy);
  const fitScaleX = 0.92 * (iw / (sxExtent[1] - sxExtent[0]));
  const fitScaleY = 0.92 * (ih / (syExtent[1] - syExtent[0]));
  const sxCenter = (sxExtent[0] + sxExtent[1]) / 2;
  const syCenter = (syExtent[0] + syExtent[1]) / 2;
  const toScreen = (p) => [originX + (p.sx - sxCenter) * fitScaleX, originY + (p.sy - syCenter) * fitScaleY];

  // --- Surface mesh: one quad per grid cell, painter's algorithm back-to-front
  const quads = [];
  for (let i = 0; i < GRID_N - 1; i++) {
    for (let j = 0; j < GRID_N - 1; j++) {
      const cellCorners = [
        [xs[i], ys[j], zGrid[i][j]],
        [xs[i + 1], ys[j], zGrid[i + 1][j]],
        [xs[i + 1], ys[j + 1], zGrid[i + 1][j + 1]],
        [xs[i], ys[j + 1], zGrid[i][j + 1]],
      ];
      const projected = cellCorners.map(([x, y, z]) => proj(x, y, zWorld(z)));
      const avgZ = (zGrid[i][j] + zGrid[i + 1][j] + zGrid[i + 1][j + 1] + zGrid[i][j + 1]) / 4;
      const avgDepth = d3.mean(projected, (p) => p.depth);
      quads.push({ points: projected.map(toScreen), value: avgZ, depth: avgDepth });
    }
  }
  quads.sort((a, b) => a.depth - b.depth);

  surfaceG
    .selectAll("path")
    .data(quads)
    .join("path")
    .attr("d", (d) => lineGen(d.points) + "Z")
    .attr("fill", (d) => color(d.value))
    .attr("stroke", t.pageBg)
    .attr("stroke-width", 0.6)
    .attr("stroke-opacity", 0.5);

  // --- Axis triad (drawn from the bounding-box corner nearest the viewer) ---
  axisG.selectAll("*").remove();
  const originScreen = toScreen(proj(...axisCorner));
  const axisEndScreen = {};
  for (const key of ["x", "y", "z"]) {
    axisEndScreen[key] = toScreen(proj(...axisEnds[key]));
    axisG
      .append("line")
      .attr("x1", originScreen[0])
      .attr("y1", originScreen[1])
      .attr("x2", axisEndScreen[key][0])
      .attr("y2", axisEndScreen[key][1])
      .attr("stroke", t.inkSoft)
      .attr("stroke-width", 1.5);
  }

  // Ticks + labels for x and y (world-plane ticks, below the axis) and z
  // (height ticks, offset sideways since the z-axis renders near-vertical)
  function drawTicks(worldToPoint, domainValues, labelFn, { dx = 0, dy = "1.1em", anchor = "middle" } = {}) {
    for (const v of domainValues) {
      const p = toScreen(proj(...worldToPoint(v)));
      axisG
        .append("text")
        .attr("x", p[0])
        .attr("y", p[1])
        .attr("dx", dx)
        .attr("dy", dy)
        .attr("text-anchor", anchor)
        .attr("fill", t.inkSoft)
        .style("font-size", "13px")
        .text(labelFn(v));
    }
  }
  drawTicks((v) => [v, -EXTENT, zWorld(zMin)], xTicks, (v) => v.toFixed(0));
  drawTicks((v) => [-EXTENT, v, zWorld(zMin)], yTicks, (v) => v.toFixed(0));
  drawTicks((v) => [-EXTENT, -EXTENT, zWorld(v)], zTicks, (v) => v.toFixed(1), {
    dx: -10,
    dy: "0.35em",
    anchor: "end",
  });

  // Axis titles — placed just outside the surface's screen-space bounding
  // box (the projection is linear in x/y/z, so every surface point provably
  // projects inside the convex hull of the 8 corner projections, i.e. inside
  // this box). Each label is pushed along the ray from the box center
  // through its axis's screen midpoint until it exits the box, then a fixed
  // padding further — guaranteed to land in empty background space no
  // matter how the view has been rotated.
  const screenCorners = corners.map(toScreen);
  const boxMinX = d3.min(screenCorners, (p) => p[0]);
  const boxMaxX = d3.max(screenCorners, (p) => p[0]);
  const boxMinY = d3.min(screenCorners, (p) => p[1]);
  const boxMaxY = d3.max(screenCorners, (p) => p[1]);
  const boxCenter = [(boxMinX + boxMaxX) / 2, (boxMinY + boxMaxY) / 2];
  const midpoint = (a, b) => [(a[0] + b[0]) / 2, (a[1] + b[1]) / 2];
  function edgeLabel(mid, padding) {
    const dx = mid[0] - boxCenter[0];
    const dy = mid[1] - boxCenter[1];
    const tx = dx !== 0 ? ((dx > 0 ? boxMaxX : boxMinX) - boxCenter[0]) / dx : Infinity;
    const ty = dy !== 0 ? ((dy > 0 ? boxMaxY : boxMinY) - boxCenter[1]) / dy : Infinity;
    const t = Math.min(tx, ty);
    const len = Math.hypot(dx, dy) || 1;
    return [boxCenter[0] + t * dx + (dx / len) * padding, boxCenter[1] + t * dy + (dy / len) * padding];
  }
  const xLabelScreen = edgeLabel(midpoint(originScreen, axisEndScreen.x), 40);
  const yLabelScreen = edgeLabel(midpoint(originScreen, axisEndScreen.y), 40);
  const zLabelScreen = edgeLabel(midpoint(originScreen, axisEndScreen.z), 40);
  axisG
    .append("text")
    .attr("x", xLabelScreen[0])
    .attr("y", xLabelScreen[1])
    .attr("text-anchor", "middle")
    .attr("fill", t.ink)
    .style("font-size", "15px")
    .text("Position X (m)");
  axisG
    .append("text")
    .attr("x", yLabelScreen[0])
    .attr("y", yLabelScreen[1])
    .attr("text-anchor", "middle")
    .attr("fill", t.ink)
    .style("font-size", "15px")
    .text("Position Y (m)");
  axisG
    .append("text")
    .attr("x", zLabelScreen[0])
    .attr("y", zLabelScreen[1])
    .attr("text-anchor", "middle")
    .attr("fill", t.ink)
    .style("font-size", "15px")
    .attr("transform", `rotate(-90 ${zLabelScreen[0]} ${zLabelScreen[1]})`)
    .text("Wave Amplitude");
}
render();

// --- Drag-to-rotate: classic D3 technique for exploring a 3D surface from
// different angles (the spec explicitly asks interactive libraries for this).
// The static PNG capture happens before any pointer event fires, so the
// screenshot is unaffected; only the interactive HTML output responds.
svg.style("cursor", "grab").call(
  d3
    .drag()
    .on("start", () => svg.style("cursor", "grabbing"))
    .on("drag", (event) => {
      azimuth += event.dx * 0.008;
      elevation = Math.max(MIN_ELEVATION, Math.min(MAX_ELEVATION, elevation - event.dy * 0.008));
      render();
    })
    .on("end", () => svg.style("cursor", "grab")),
);

// --- Colorbar (2D legend for the height/color mapping) ----------------------
const barX = width - margin.right + 90;
const barTop = margin.top + 40;
const barHeight = ih - 80;
const barWidth = 26;
const legendScale = d3.scaleLinear().domain([absMax, -absMax]).range([0, barHeight]);
const gradientId = "surface-basic-colorbar";
const defs = svg.append("defs");
const gradient = defs
  .append("linearGradient")
  .attr("id", gradientId)
  .attr("x1", "0")
  .attr("x2", "0")
  .attr("y1", "0")
  .attr("y2", "1");
d3.range(0, 1.001, 0.1).forEach((stop) => {
  gradient
    .append("stop")
    .attr("offset", `${stop * 100}%`)
    .attr("stop-color", color(absMax - stop * 2 * absMax));
});
svg
  .append("rect")
  .attr("x", barX)
  .attr("y", barTop)
  .attr("width", barWidth)
  .attr("height", barHeight)
  .attr("fill", `url(#${gradientId})`)
  .attr("stroke", t.inkSoft)
  .attr("stroke-width", 1);
const legendAxis = d3.axisRight(legendScale).ticks(5).tickFormat(d3.format(".1f"));
const legendG = svg
  .append("g")
  .attr("transform", `translate(${barX + barWidth},${barTop})`)
  .call(legendAxis);
legendG.selectAll("text").attr("fill", t.inkSoft).style("font-size", "13px");
legendG.selectAll("line").attr("stroke", t.grid);
legendG.select(".domain").attr("stroke", t.inkSoft);
svg
  .append("text")
  .attr("x", barX + barWidth / 2)
  .attr("y", barTop - 18)
  .attr("text-anchor", "middle")
  .attr("fill", t.inkSoft)
  .style("font-size", "13px")
  .text("Amplitude");

// --- Title -------------------------------------------------------------------
const title = "Wave Interference Surface · surface-basic · javascript · d3 · anyplot.ai";
const baselineFontSize = 25;
const titleFontSize = title.length > 67 ? Math.round(baselineFontSize * (67 / title.length)) : baselineFontSize;
svg
  .append("text")
  .attr("x", width / 2)
  .attr("y", 52)
  .attr("text-anchor", "middle")
  .attr("fill", t.ink)
  .style("font-size", `${titleFontSize}px`)
  .style("font-weight", "600")
  .text(title);
Runnable source as JSON, for any HTTP client: https://api.anyplot.ai/specs/surface-basic/d3/code. Any spec id and library id listed in llms-full.txt fit the same URL shape; every URL below is complete and callable.
{
  "spec_id": "surface-basic",
  "language": "javascript",
  "library": "d3",
  "page": "https://anyplot.ai/surface-basic/javascript/d3",
  "hub": "https://anyplot.ai/surface-basic",
  "code_json": "https://api.anyplot.ai/specs/surface-basic/d3/code",
  "spec_json": "https://api.anyplot.ai/specs/surface-basic",
  "render_light_png": "https://storage.googleapis.com/anyplot-images/plots/surface-basic/javascript/d3/plot-light.png",
  "render_dark_png": "https://storage.googleapis.com/anyplot-images/plots/surface-basic/javascript/d3/plot-dark.png",
  "interactive_light_html": "https://storage.googleapis.com/anyplot-images/plots/surface-basic/javascript/d3/plot-light.html",
  "interactive_dark_html": "https://storage.googleapis.com/anyplot-images/plots/surface-basic/javascript/d3/plot-dark.html",
  "quality_score": 86.0,
  "license": "MIT",
  "guide": "https://anyplot.ai/llms.txt"
}
Part of Basic 3D Surface Plot on anyplot.ai.