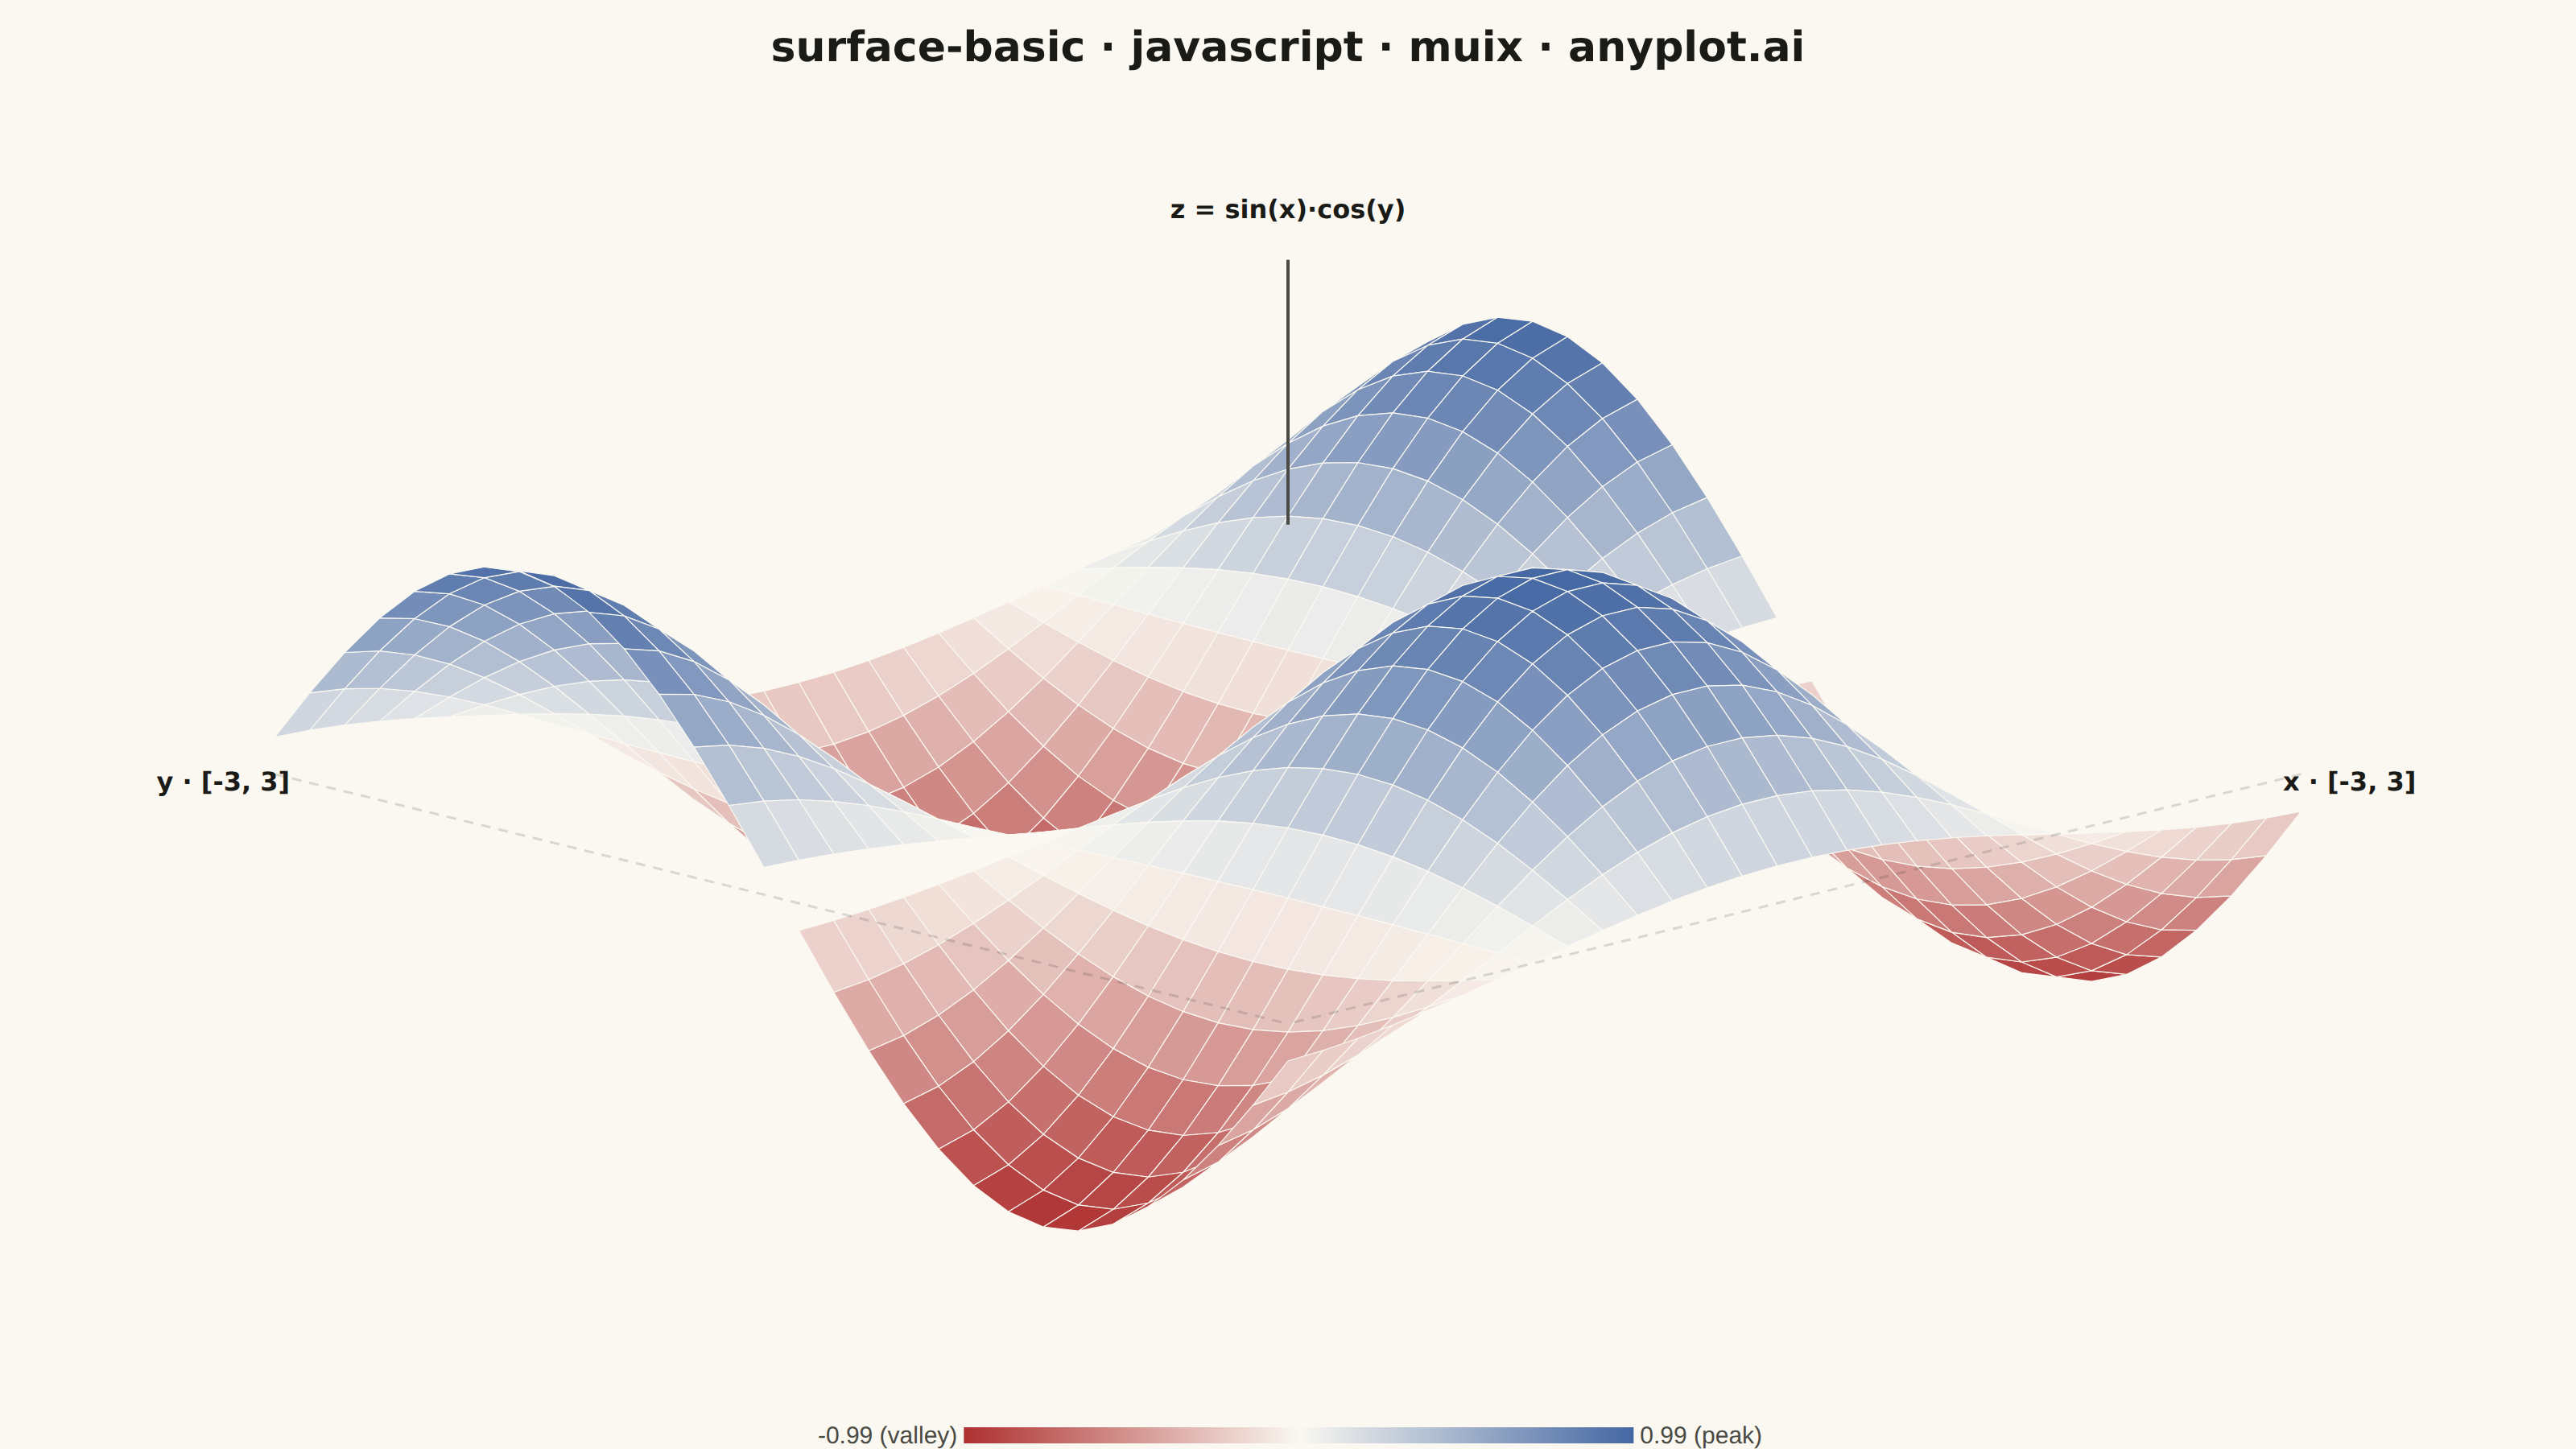
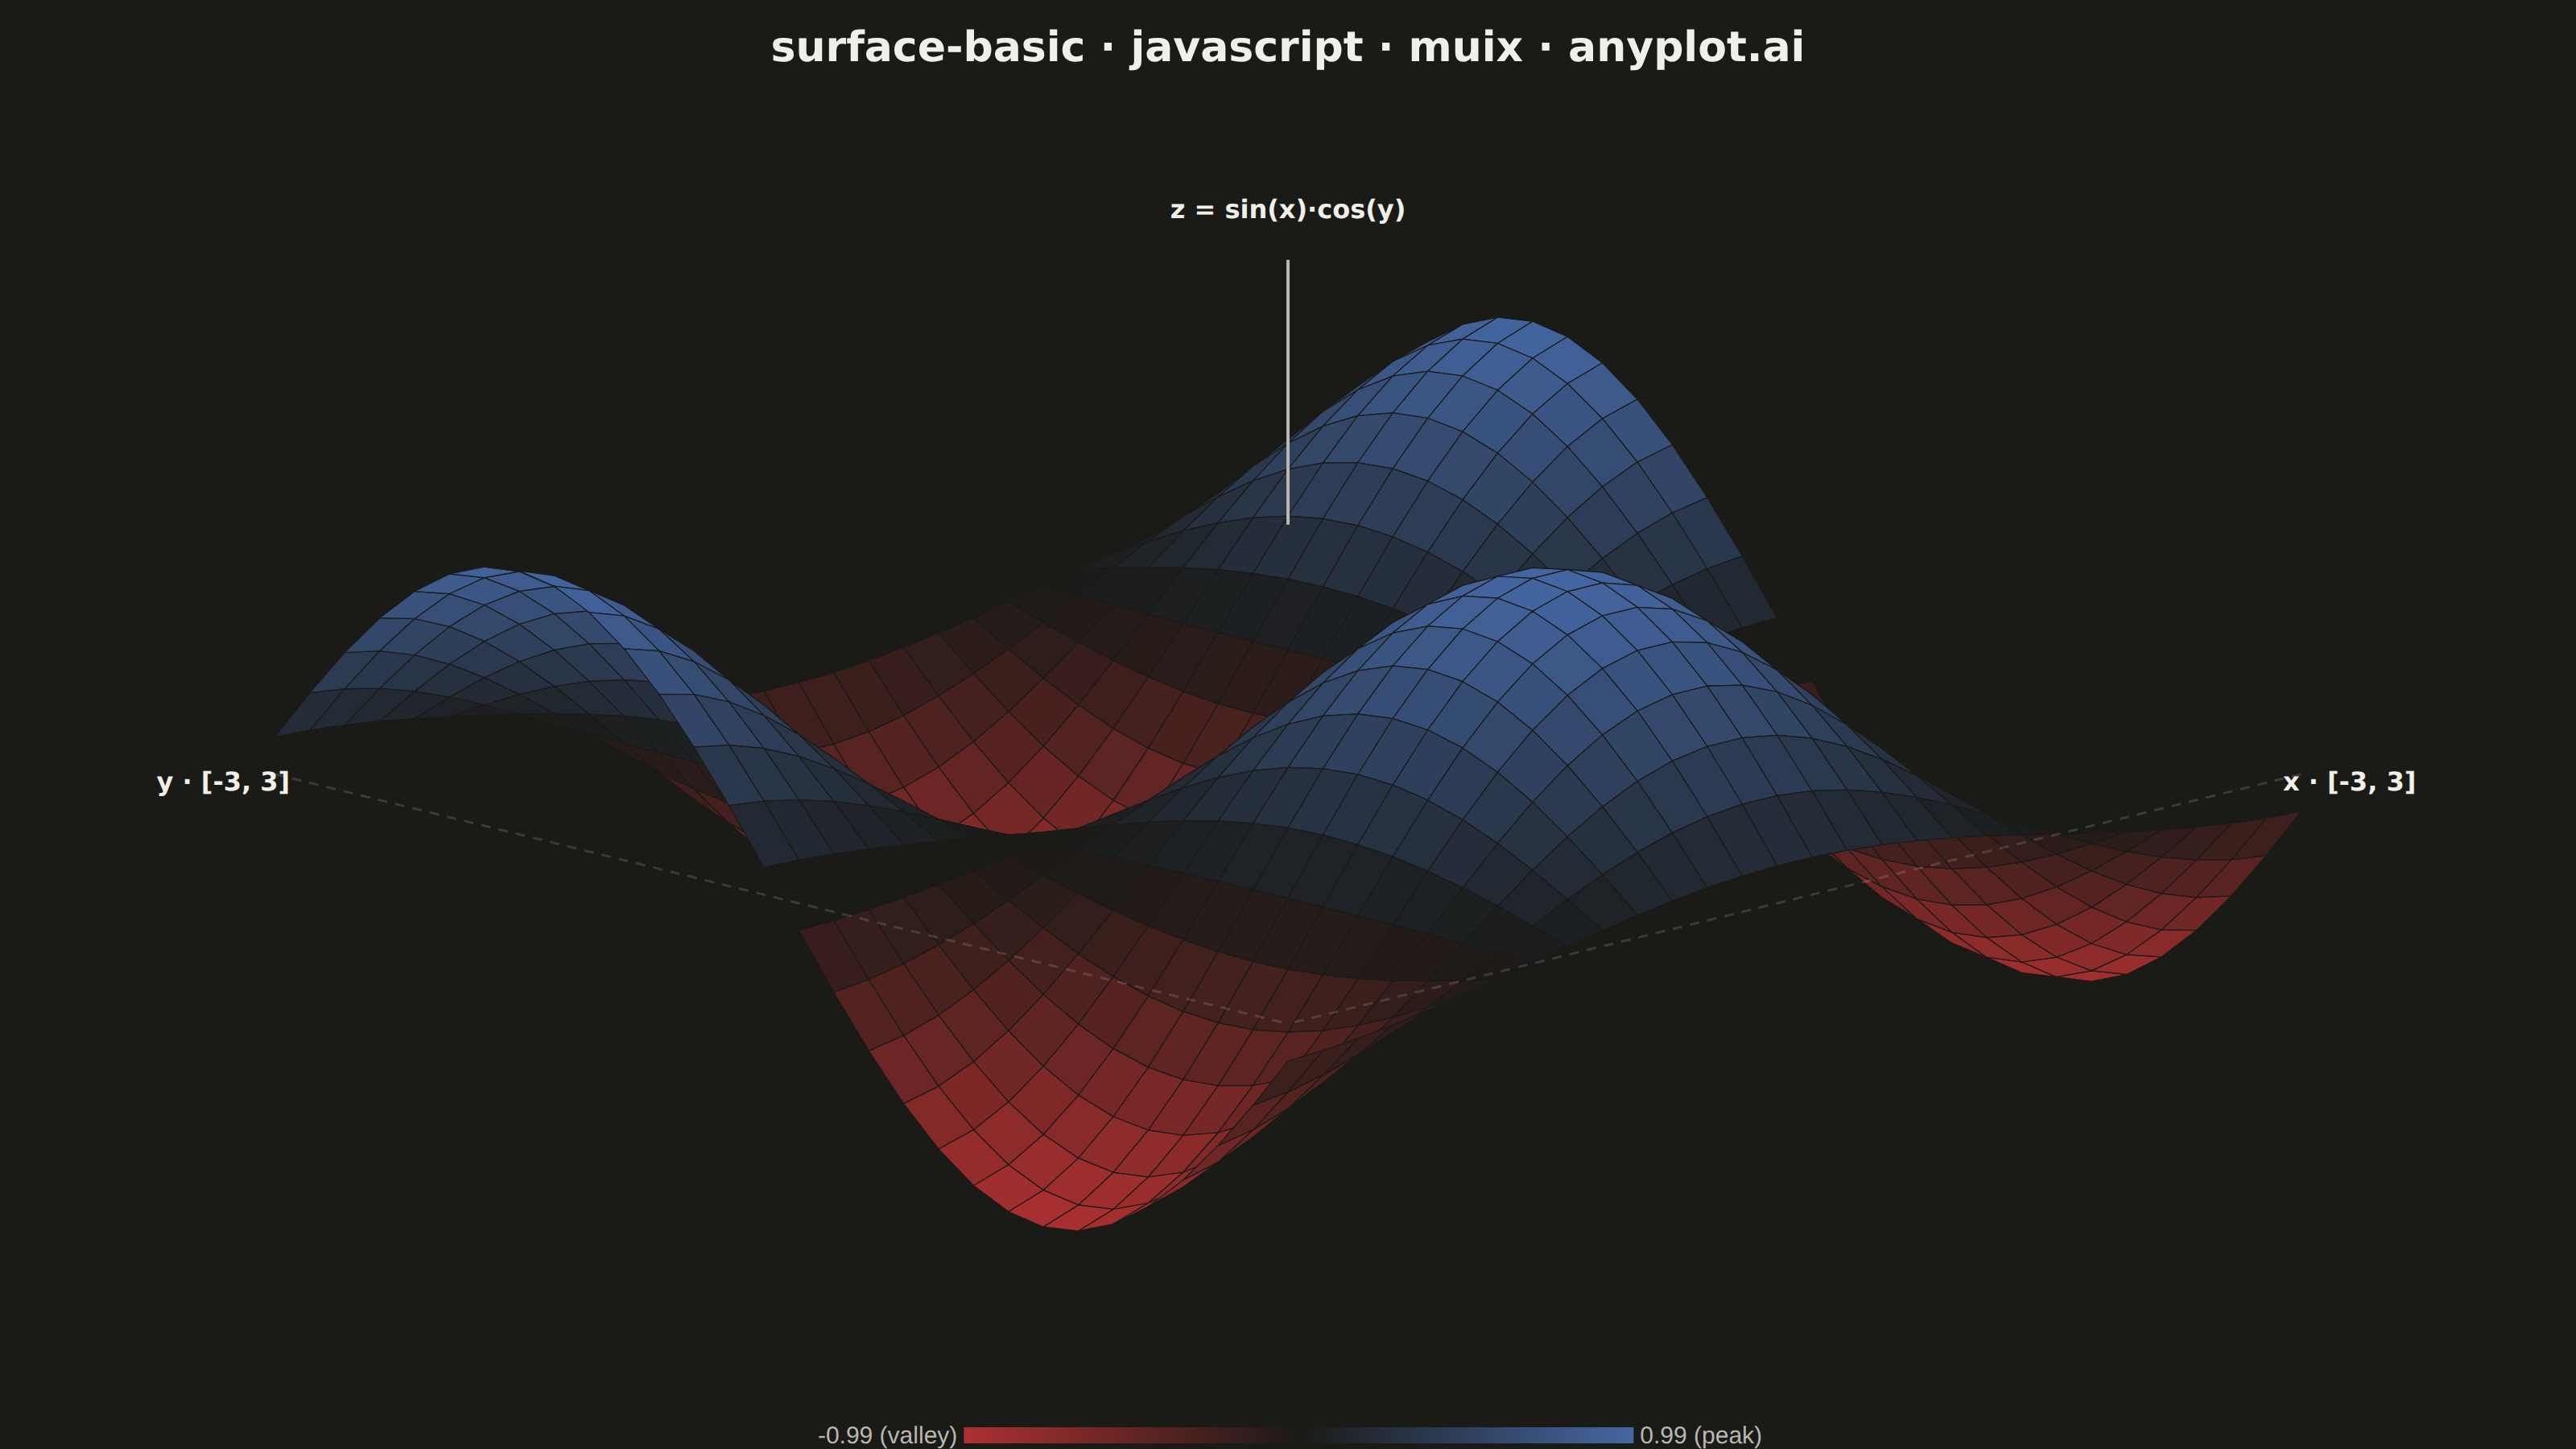
The same plot in 12 other libraries — JavaScript: D3.js, Apache ECharts, Highcharts; Python: Altair, Bokeh, lets-plot, Matplotlib, Plotly, Pygal, Seaborn; R: ggplot2; Julia: Makie.jl. Compare all 13 side by side: Basic 3D Surface Plot in Python, R, Julia and JavaScript.
A 3D surface plot visualizes a function of two variables as a continuous surface in three-dimensional space. The height (z-axis) represents the function value at each (x, y) point, with color encoding the same information to enhance depth perception. This visualization is ideal for understanding mathematical functions, terrain data, and response surfaces where the relationship between two inputs and one output needs to be explored.
// anyplot.ai
// surface-basic: Basic 3D Surface Plot
// Library: muix 7.29.1 | JavaScript 22.23.2
// Quality: 84/100 | Created: 2026-09-10
//# anyplot-orientation: landscape
import { ChartContainer } from "@mui/x-charts/ChartContainer";
import { ContinuousColorLegend } from "@mui/x-charts/ChartsLegend";
import { useXScale, useYScale } from "@mui/x-charts/hooks";

const t = window.ANYPLOT_TOKENS;
const size = window.ANYPLOT_SIZE;

// --- Data: a smooth response surface z = sin(x) * cos(y) over a 30x30 grid --
// @mui/x-charts has no native 3D surface component (community or Pro), so the
// surface is hand-projected: an isometric transform turns each (x, y, z) grid
// vertex into a 2D (px, py) point, then adjacent vertices are joined into
// filled quads and painted back-to-front, the same technique used for the
// hand-rolled axis frame in scatter-3d — here driving the fill itself.
const GRID_N = 30;
const X_MIN = -3;
const X_MAX = 3;
const Y_MIN = -3;
const Y_MAX = 3;
const HEIGHT_SCALE = 3.2; // visually exaggerates the [-1, 1] function range

const grid = [];
for (let row = 0; row < GRID_N; row += 1) {
  const y = Y_MIN + (row / (GRID_N - 1)) * (Y_MAX - Y_MIN);
  const line = [];
  for (let col = 0; col < GRID_N; col += 1) {
    const x = X_MIN + (col / (GRID_N - 1)) * (X_MAX - X_MIN);
    const z = Math.sin(x) * Math.cos(y);
    line.push({ x, y, z });
  }
  grid.push(line);
}

// --- Isometric projection: (x, y, z) -> 2D (px, py) data-space coordinates -
// x/y form the ground plane (down-right / down-left), z (the function value)
// is height, scaled up so the relief reads clearly at isometric angle.
const ISO_ANGLE = Math.PI / 6; // 30 degrees
function project(x, y, z) {
  return {
    px: (x - y) * Math.cos(ISO_ANGLE),
    py: z * HEIGHT_SCALE - (x + y) * Math.sin(ISO_ANGLE),
  };
}

grid.forEach((line) =>
  line.forEach((node) => {
    const projected = project(node.x, node.y, node.z);
    node.px = projected.px;
    node.py = projected.py;
  })
);

// --- Quads: one filled polygon per grid cell, colored by average height ----
const heightValues = grid.flat().map((node) => node.z);
const heightMin = Math.min(...heightValues);
const heightMax = Math.max(...heightValues);

// Diverging Imprint scale (matte red -> theme midpoint -> blue): the surface
// has a genuine zero baseline (a flat plane), so low/high are signed
// deviations around it — the textbook case for imprint_div.
const midpointHex = t.div[1];
const lowHex = t.div[0];
const highHex = t.div[2];
const hexToRgb = (hex) => {
  const n = parseInt(hex.slice(1), 16);
  return [(n >> 16) & 255, (n >> 8) & 255, n & 255];
};
const lerpHex = (a, b, ratio) => {
  const [ar, ag, ab] = hexToRgb(a);
  const [br, bg, bb] = hexToRgb(b);
  const r = Math.round(ar + (br - ar) * ratio);
  const g = Math.round(ag + (bg - ag) * ratio);
  const bch = Math.round(ab + (bb - ab) * ratio);
  return `rgb(${r}, ${g}, ${bch})`;
};
const colorForUnit = (unitT) =>
  unitT <= 0.5
    ? lerpHex(lowHex, midpointHex, unitT / 0.5)
    : lerpHex(midpointHex, highHex, (unitT - 0.5) / 0.5);
const colorForHeight = (value) =>
  colorForUnit((value - heightMin) / (heightMax - heightMin));

const quads = [];
for (let row = 0; row < GRID_N - 1; row += 1) {
  for (let col = 0; col < GRID_N - 1; col += 1) {
    const p00 = grid[row][col];
    const p10 = grid[row][col + 1];
    const p11 = grid[row + 1][col + 1];
    const p01 = grid[row + 1][col];
    const avgHeight = (p00.z + p10.z + p11.z + p01.z) / 4;
    quads.push({
      points: [p00, p10, p11, p01],
      depthKey: row + col, // painter's algorithm: far (low row+col) first
      fill: colorForHeight(avgHeight),
    });
  }
}
quads.sort((a, b) => a.depthKey - b.depthKey);

// --- Domain bounds for the linear x/y scales, padded for axis labels -------
// Padding is a fraction of the projected data range (not a fixed data-unit
// constant) — the isometric domain here is ~O(20) units, an order of
// magnitude smaller than scatter-3d's ~O(100)-unit spatial domain, so a fixed
// pad borrowed from that scale would swallow most of the plot area.
const allProjected = grid.flat();
const rawPxMin = Math.min(...allProjected.map((n) => n.px));
const rawPxMax = Math.max(...allProjected.map((n) => n.px));
const rawPyMin = Math.min(...allProjected.map((n) => n.py));
const rawPyMax = Math.max(...allProjected.map((n) => n.py));
const padX = (rawPxMax - rawPxMin) * 0.08;
const padY = (rawPyMax - rawPyMin) * 0.08;
const pxMin = rawPxMin - padX;
const pxMax = rawPxMax + padX;
const pyMin = rawPyMin - padY;
const pyMax = rawPyMax + padY * 2.8; // extra headroom for the z-axis label

// --- Reference frame: ground corners + a height axis, drawn in data space
// via the chart's own scale hooks (same pattern as scatter-3d's Iso3DFrame) -
const originPoint = project(X_MIN, Y_MIN, 0);
const xEndPoint = project(X_MAX, Y_MIN, 0);
const yEndPoint = project(X_MIN, Y_MAX, 0);
const heightEndPoint = project(X_MIN, Y_MIN, heightMax);
const farCorner = project(X_MAX, Y_MAX, 0);

function IsoFrame() {
  const xScale = useXScale();
  const yScale = useYScale();
  const toPixels = (p) => ({ x: xScale(p.px), y: yScale(p.py) });

  const origin = toPixels(originPoint);
  const xEnd = toPixels(xEndPoint);
  const yEnd = toPixels(yEndPoint);
  const heightEnd = toPixels(heightEndPoint);
  const far = toPixels(farCorner);

  const groundEdge = (from, to) => (
    <line
      x1={from.x}
      y1={from.y}
      x2={to.x}
      y2={to.y}
      stroke={t.grid}
      strokeWidth={1.5}
      strokeDasharray="6 5"
    />
  );
  const axisLabel = (point, text, dx, dy) => (
    <text
      x={point.x + dx}
      y={point.y + dy}
      fill={t.ink}
      fontSize={16}
      fontWeight={600}
      fontFamily="system-ui, sans-serif"
      textAnchor="middle"
    >
      {text}
    </text>
  );

  return (
    <g>
      {groundEdge(xEnd, far)}
      {groundEdge(yEnd, far)}
      <line
        x1={origin.x}
        y1={origin.y}
        x2={heightEnd.x}
        y2={heightEnd.y}
        stroke={t.inkSoft}
        strokeWidth={2}
      />
      {axisLabel(xEnd, `x · [${X_MIN}, ${X_MAX}]`, 30, 10)}
      {axisLabel(yEnd, `y · [${Y_MIN}, ${Y_MAX}]`, -32, 10)}
      {axisLabel(heightEnd, "z = sin(x)·cos(y)", 0, -26)}
    </g>
  );
}

const chartTitle = "surface-basic · javascript · muix · anyplot.ai";

// --- Chart (default-exported component — the harness mounts it) ------------
export default function Chart() {
  return (
    <ChartContainer
      width={size.width}
      height={size.height}
      series={[]}
      zAxis={[
        {
          id: "heightColor",
          min: heightMin,
          max: heightMax,
          colorMap: { type: "continuous", min: heightMin, max: heightMax, color: colorForUnit },
        },
      ]}
      xAxis={[{ id: "iso-x", scaleType: "linear", min: pxMin, max: pxMax }]}
      yAxis={[{ id: "iso-y", scaleType: "linear", min: pyMin, max: pyMax }]}
      margin={{ top: 70, right: 70, bottom: 90, left: 70 }}
      disableAxisListener
      skipAnimation
    >
      <text
        x={size.width / 2}
        y={38}
        textAnchor="middle"
        fontSize={26}
        fontWeight={600}
        fill={t.ink}
        fontFamily="system-ui, sans-serif"
      >
        {chartTitle}
      </text>
      <SurfaceMesh />
      <IsoFrame />
      <ContinuousColorLegend
        axisDirection="z"
        axisId="heightColor"
        direction="row"
        position={{ horizontal: "middle", vertical: "bottom" }}
        length="26%"
        thickness={10}
        minLabel={() => `${heightMin.toFixed(2)} (valley)`}
        maxLabel={() => `${heightMax.toFixed(2)} (peak)`}
        labelStyle={{ fontSize: 15, fill: t.inkSoft }}
      />
    </ChartContainer>
  );
}

// --- The surface itself: painter's-algorithm-sorted filled quads -----------
function SurfaceMesh() {
  const xScale = useXScale();
  const yScale = useYScale();
  const toPixels = (p) => `${xScale(p.px)},${yScale(p.py)}`;

  return (
    <g>
      {quads.map((quad, i) => (
        <polygon
          key={`quad-${quad.depthKey}-${i}`}
          points={quad.points.map(toPixels).join(" ")}
          fill={quad.fill}
          stroke={t.pageBg}
          strokeWidth={0.6}
        />
      ))}
    </g>
  );
}
Runnable source as JSON, for any HTTP client: https://api.anyplot.ai/specs/surface-basic/muix/code. Any spec id and library id listed in llms-full.txt fit the same URL shape; every URL below is complete and callable.
{
  "spec_id": "surface-basic",
  "language": "javascript",
  "library": "muix",
  "page": "https://anyplot.ai/surface-basic/javascript/muix",
  "hub": "https://anyplot.ai/surface-basic",
  "code_json": "https://api.anyplot.ai/specs/surface-basic/muix/code",
  "spec_json": "https://api.anyplot.ai/specs/surface-basic",
  "render_light_png": "https://storage.googleapis.com/anyplot-images/plots/surface-basic/javascript/muix/plot-light.png",
  "render_dark_png": "https://storage.googleapis.com/anyplot-images/plots/surface-basic/javascript/muix/plot-dark.png",
  "interactive_light_html": "https://storage.googleapis.com/anyplot-images/plots/surface-basic/javascript/muix/plot-light.html",
  "interactive_dark_html": "https://storage.googleapis.com/anyplot-images/plots/surface-basic/javascript/muix/plot-dark.html",
  "quality_score": 84.0,
  "license": "MIT",
  "guide": "https://anyplot.ai/llms.txt"
}
Part of Basic 3D Surface Plot on anyplot.ai.