The same plot in 12 other libraries — JavaScript: D3.js, Highcharts, MUI X Charts; Python: Altair, Bokeh, lets-plot, Matplotlib, Plotly, Pygal, Seaborn; R: ggplot2; Julia: Makie.jl. Compare all 13 side by side: Basic 3D Surface Plot in Python, R, Julia and JavaScript.
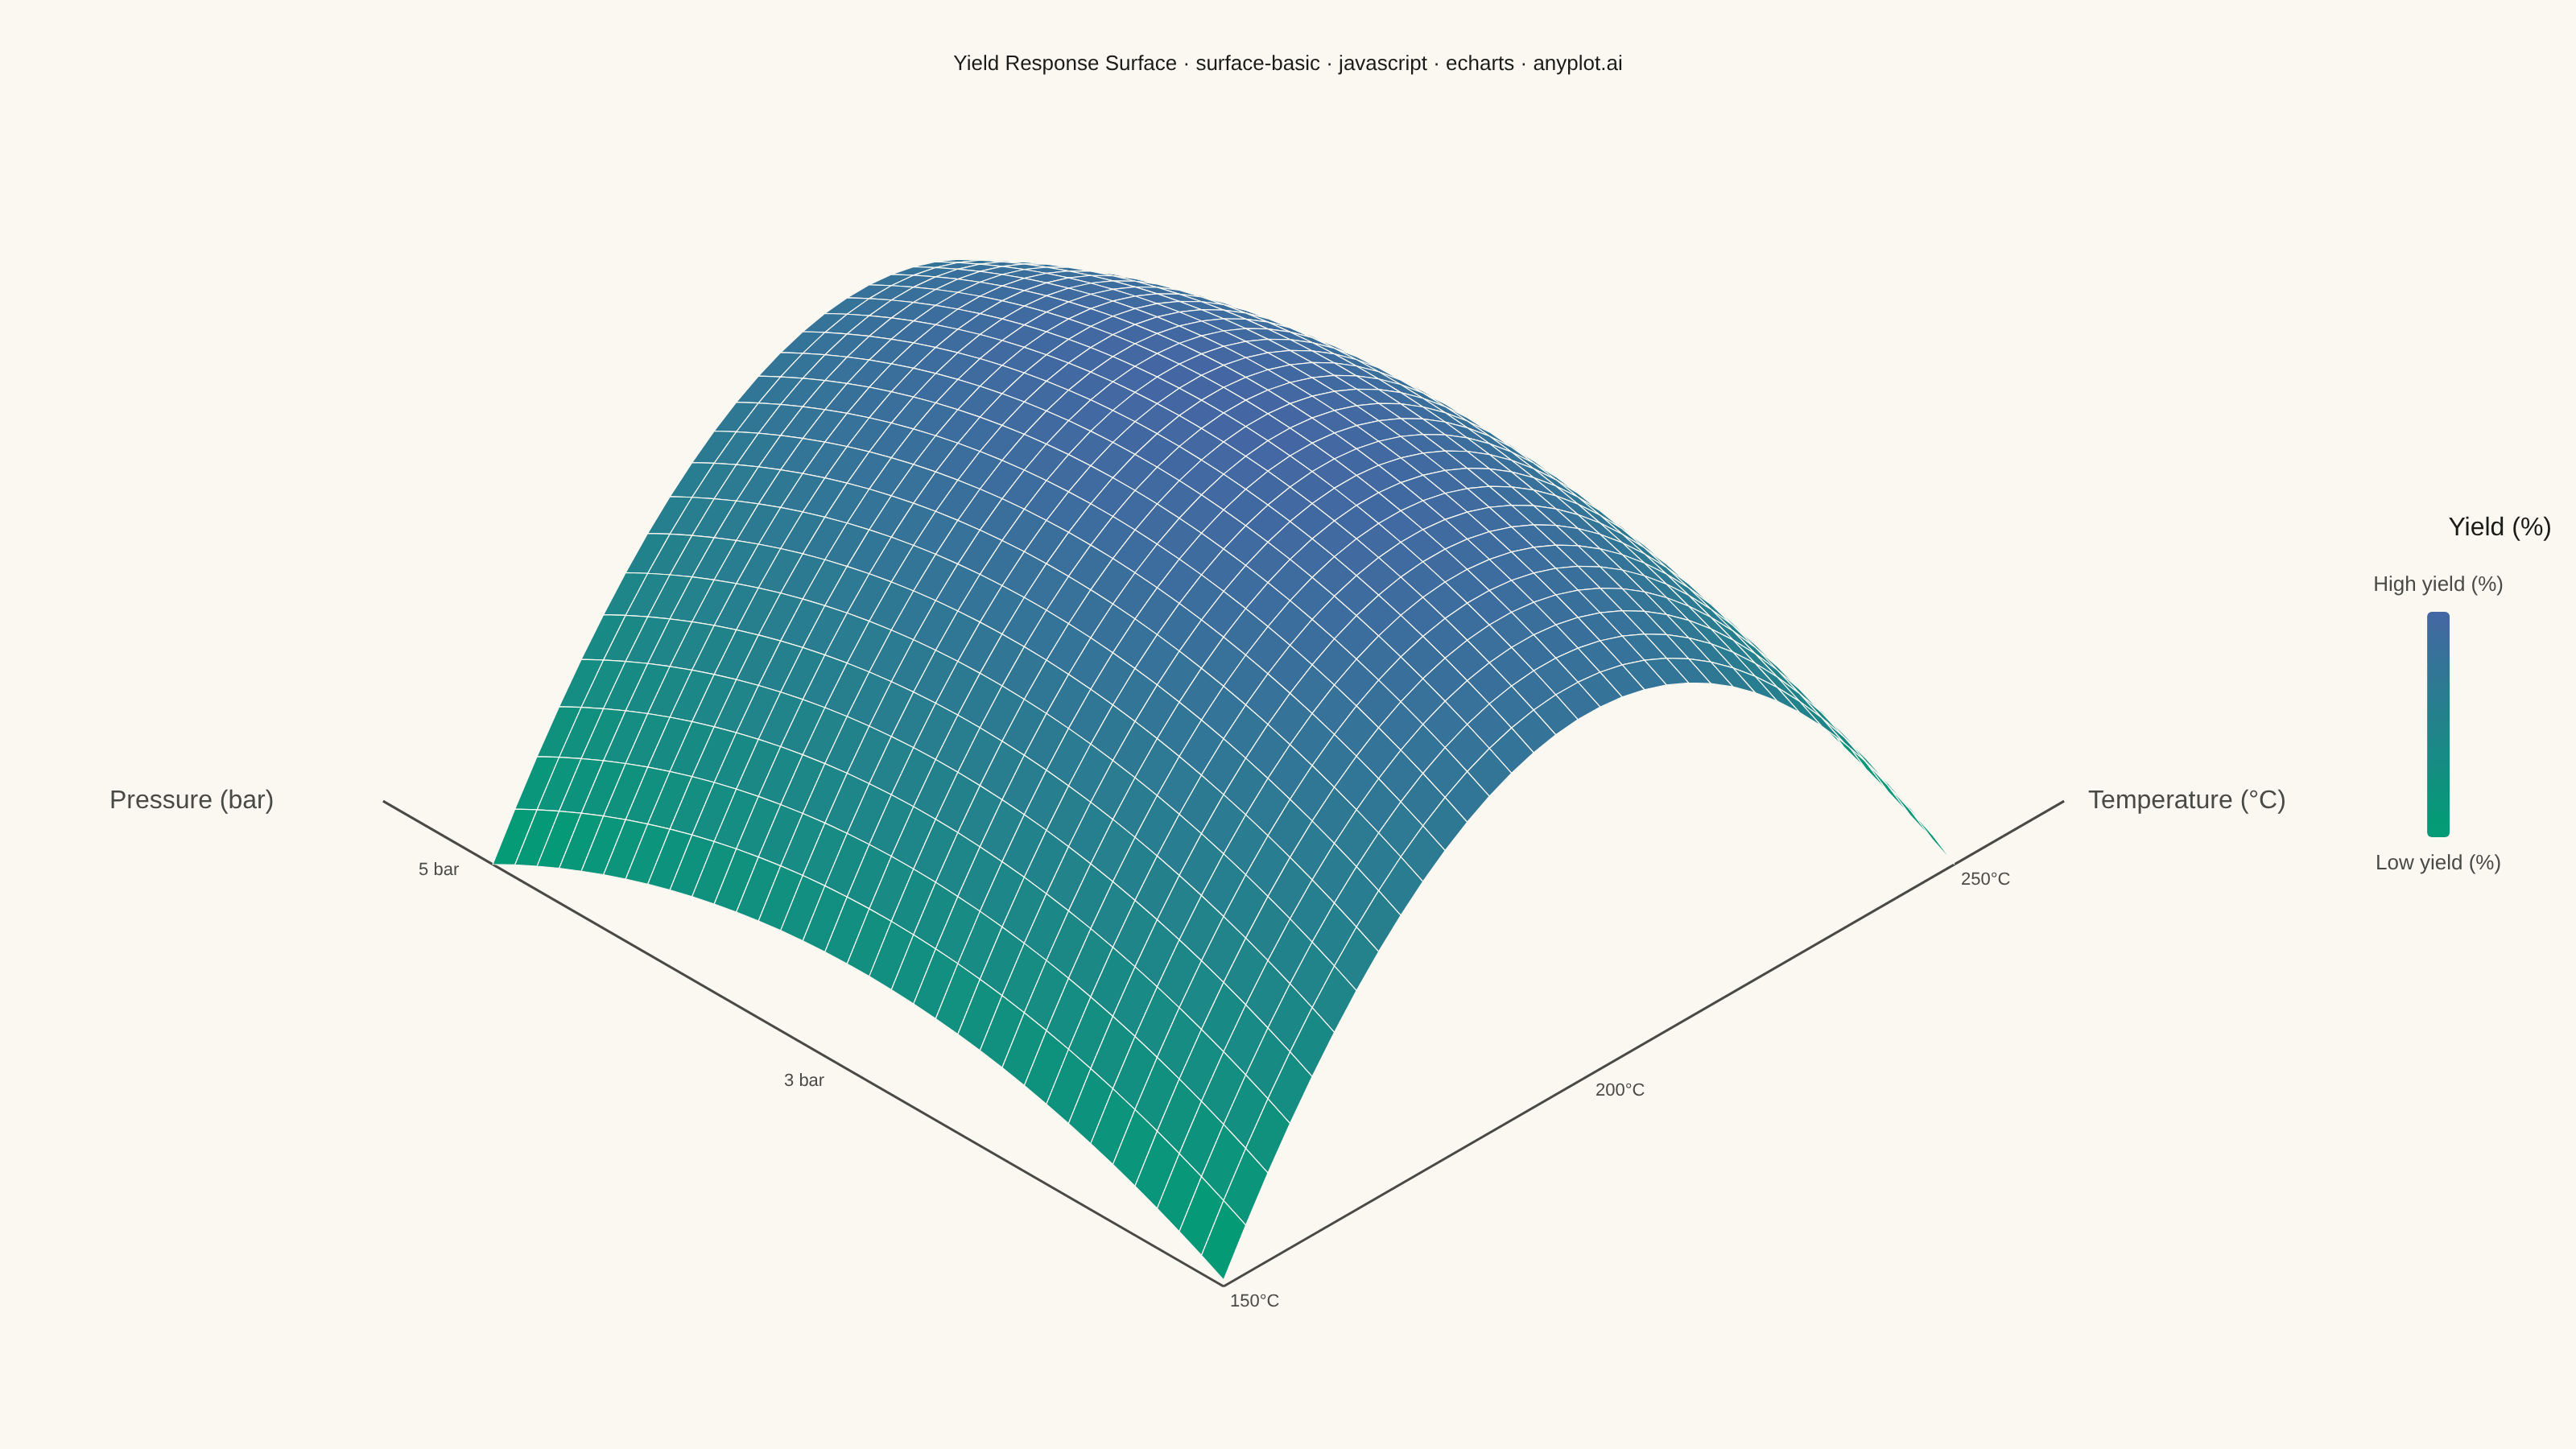
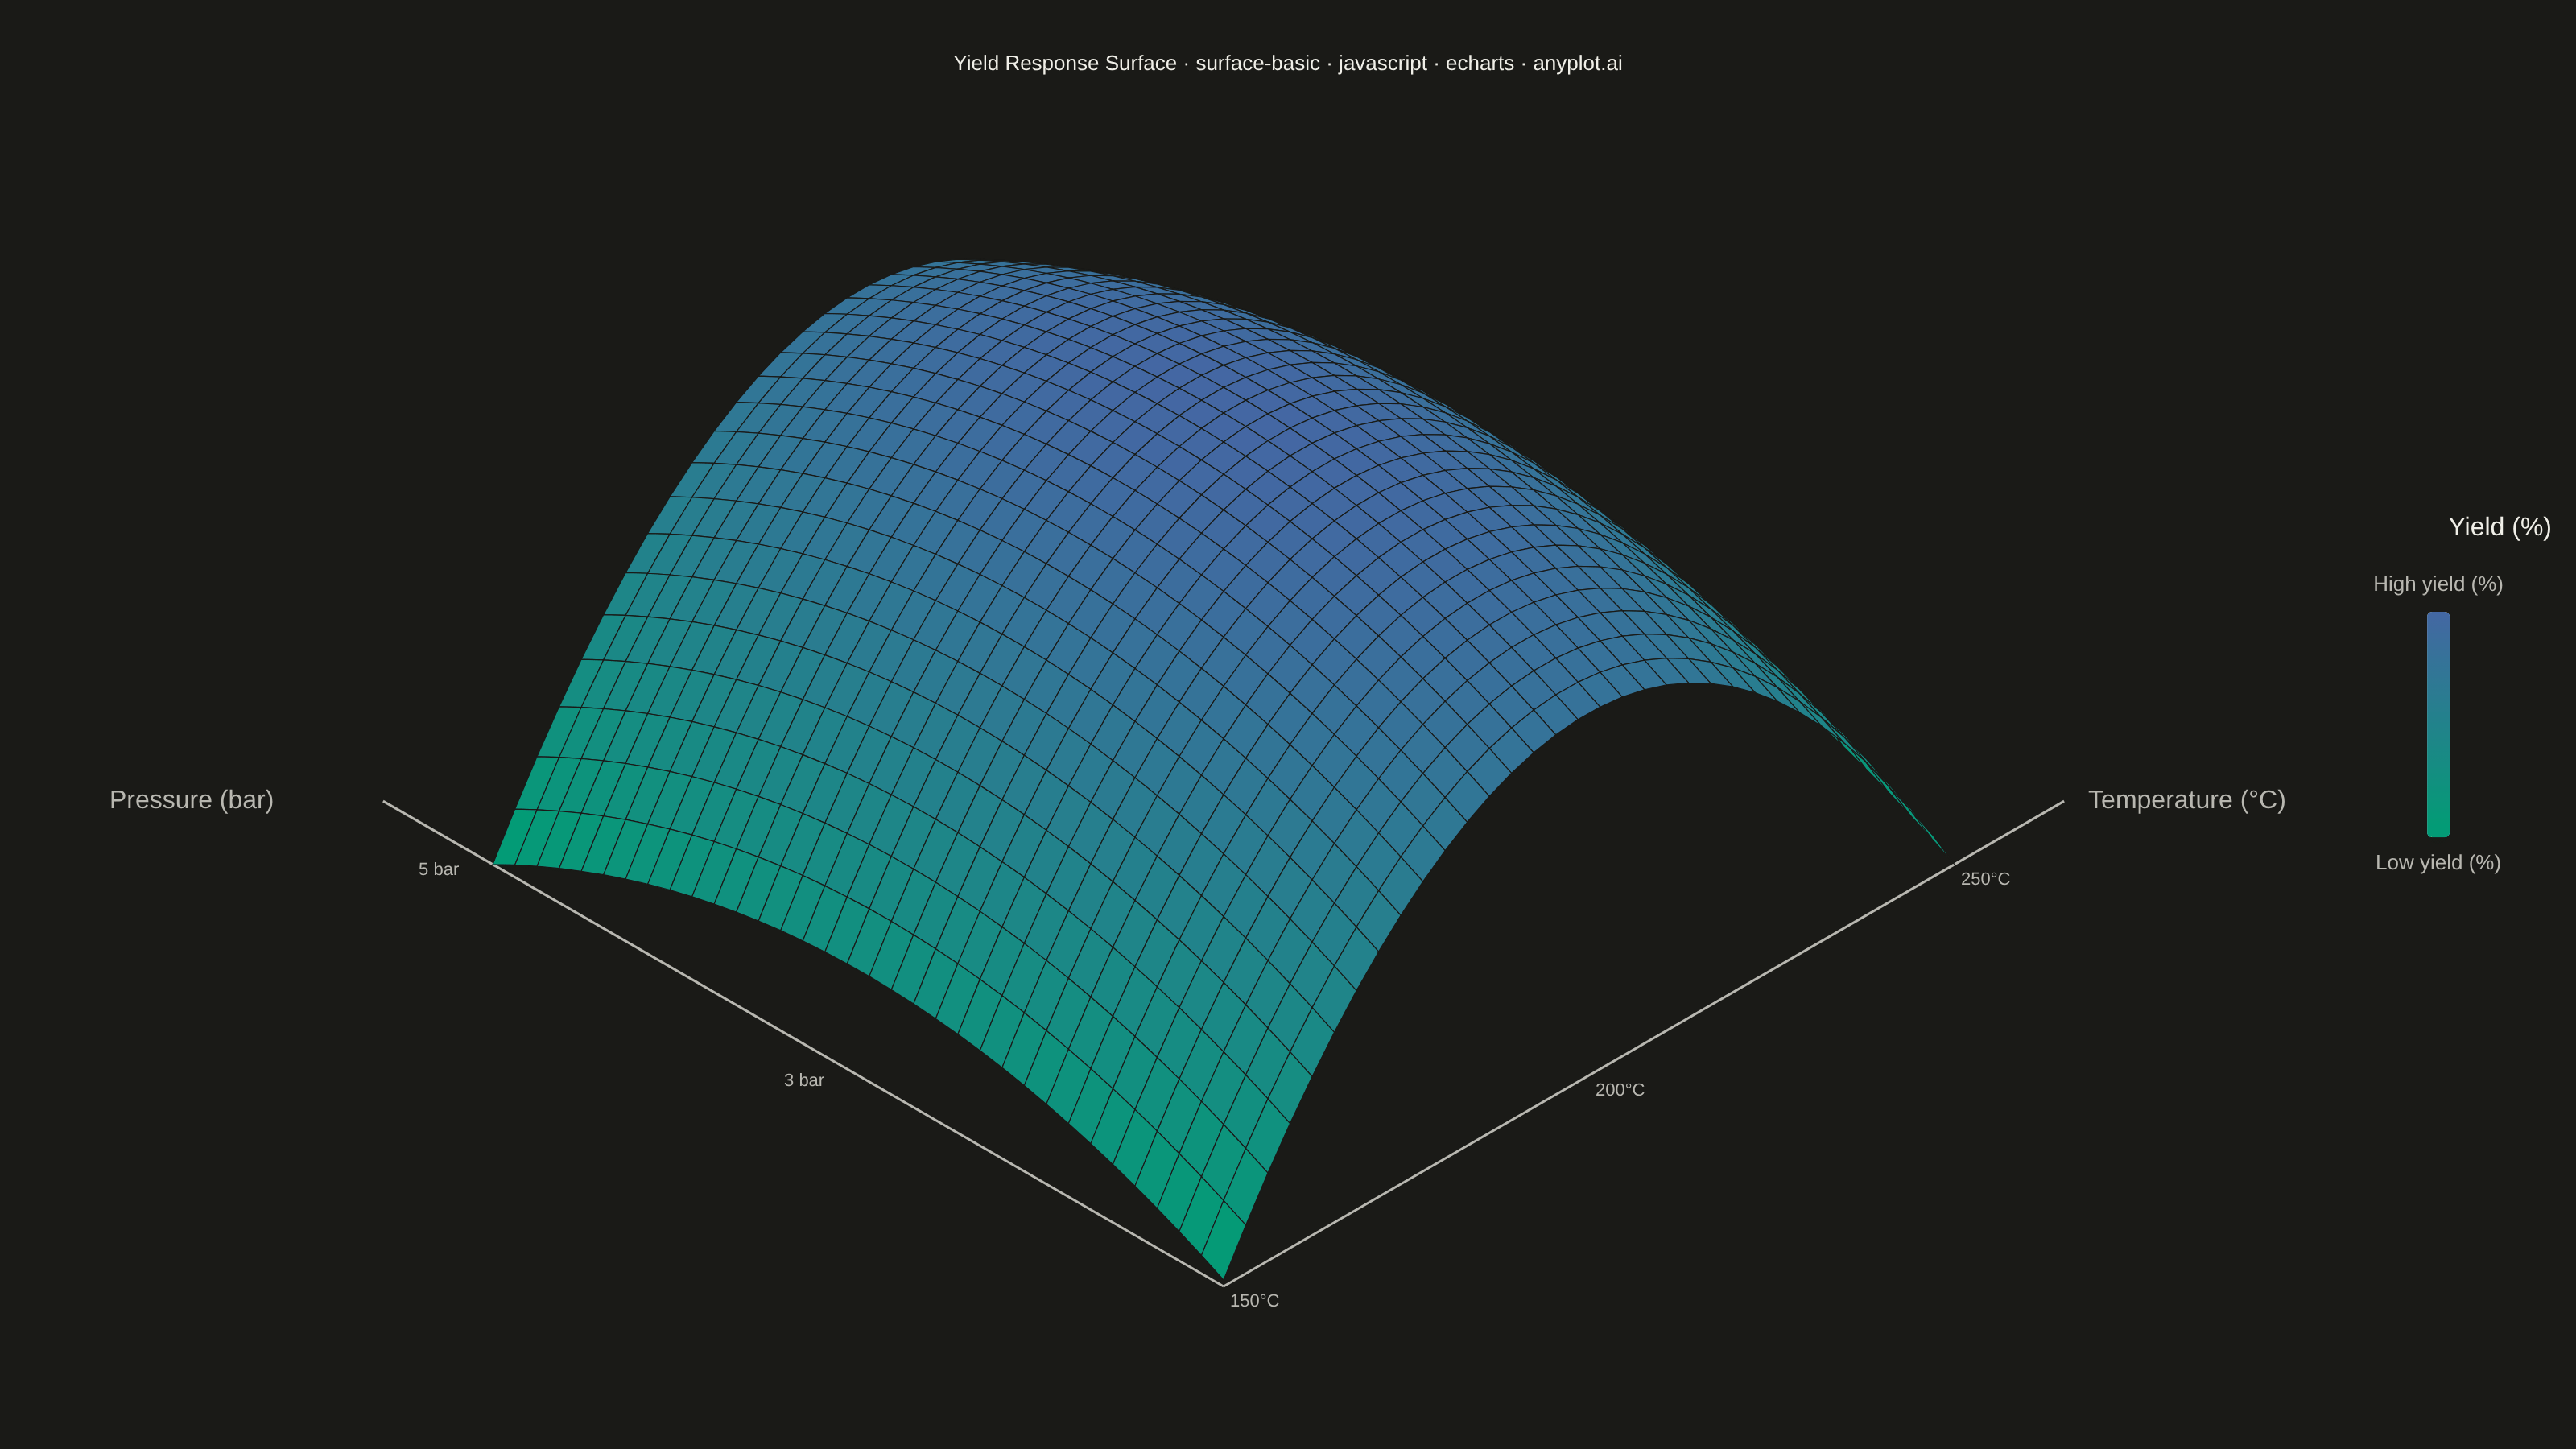
A 3D surface plot visualizes a function of two variables as a continuous surface in three-dimensional space. The height (z-axis) represents the function value at each (x, y) point, with color encoding the same information to enhance depth perception. This visualization is ideal for understanding mathematical functions, terrain data, and response surfaces where the relationship between two inputs and one output needs to be explored.
// anyplot.ai
// surface-basic: Basic 3D Surface Plot
// Library: echarts 6.1.0 | JavaScript 22.23.2
// Quality: 90/100 | Created: 2026-09-10

//# anyplot-orientation: landscape
const t = window.ANYPLOT_TOKENS;
const size = window.ANYPLOT_SIZE;

// --- Data: chemical process yield as a function of temperature and pressure -
// A response-surface-methodology scenario: reaction yield peaks near
// 200 degC / 3 bar and falls off away from that optimum, with a small
// interaction term so the surface isn't a perfectly symmetric bowl.
const N = 34;
const T_MIN = 150,
  T_MAX = 250; // degrees C
const P_MIN = 1,
  P_MAX = 5; // bar
function yieldAt(temp, pressure) {
  const dt = temp - 200;
  const dp = pressure - 3;
  return 92 - 0.018 * dt * dt - 3.2 * dp * dp + 0.004 * dt * dp;
}

const temps = Array.from({ length: N }, (_, i) => T_MIN + (i * (T_MAX - T_MIN)) / (N - 1));
const pressures = Array.from({ length: N }, (_, j) => P_MIN + (j * (P_MAX - P_MIN)) / (N - 1));
const zGrid = temps.map((temp) => pressures.map((pressure) => yieldAt(temp, pressure)));
const zFlat = zGrid.flat();
const zMin = Math.min(...zFlat);
const zMax = Math.max(...zFlat);

// --- Isometric projection: normalize each axis to a shared unit scale, then
// apply the classic 30-degree axonometric transform (ground-A to the lower
// right, height straight up, ground-B to the lower left).
const GROUND_SPAN = 10;
const HEIGHT_SPAN = 5.5;
const normTemp = (v) => ((v - T_MIN) / (T_MAX - T_MIN)) * GROUND_SPAN;
const normPressure = (v) => ((v - P_MIN) / (P_MAX - P_MIN)) * GROUND_SPAN;
const normHeight = (v) => ((v - zMin) / (zMax - zMin)) * HEIGHT_SPAN;

const COS30 = Math.cos(Math.PI / 6);
const SIN30 = Math.sin(Math.PI / 6);
function project(groundA, height, groundB) {
  return [(groundA - groundB) * COS30, (groundA + groundB) * SIN30 + height];
}

// Iso-projected position of every grid vertex, indexed [i][j].
const isoGrid = temps.map((temp, i) =>
  pressures.map((pressure, j) => project(normTemp(temp), normHeight(zGrid[i][j]), normPressure(pressure)))
);

// One facet per grid cell: [avgYield, x0,y0, x1,y1, x2,y2, x3,y3, depth].
// Depth (sum of ground indices) drives back-to-front painter's-algorithm order.
const facets = [];
for (let i = 0; i < N - 1; i++) {
  for (let j = 0; j < N - 1; j++) {
    const c00 = isoGrid[i][j];
    const c10 = isoGrid[i + 1][j];
    const c11 = isoGrid[i + 1][j + 1];
    const c01 = isoGrid[i][j + 1];
    const avgYield = (zGrid[i][j] + zGrid[i + 1][j] + zGrid[i + 1][j + 1] + zGrid[i][j + 1]) / 4;
    facets.push({
      depth: i + j,
      value: [avgYield, c00[0], c00[1], c10[0], c10[1], c11[0], c11[1], c01[0], c01[1]],
    });
  }
}
facets.sort((a, b) => b.depth - a.depth); // farthest cells first, nearest painted last (on top)
const facetData = facets.map((f) => f.value);

// Axis guides run past the data extent so they read as open axes, not a box.
const originP = project(0, 0, 0);
const tempTipP = project(GROUND_SPAN * 1.15, 0, 0);
const pressureTipP = project(0, 0, GROUND_SPAN * 1.15);
const yieldTipP = project(0, HEIGHT_SPAN * 1.15, 0);

// --- Frame geometry: lock x/y to one pixels-per-unit scale so the isometric
// angles survive echarts' cartesian grid (which has no built-in aspect lock).
const allX = isoGrid.flat().map((p) => p[0]).concat([originP[0], tempTipP[0], pressureTipP[0], yieldTipP[0]]);
const allY = isoGrid.flat().map((p) => p[1]).concat([originP[1], tempTipP[1], pressureTipP[1], yieldTipP[1]]);
const padX = (Math.max(...allX) - Math.min(...allX)) * 0.1;
const padY = (Math.max(...allY) - Math.min(...allY)) * 0.08;
const xAxisMin = Math.min(...allX) - padX;
const xAxisMax = Math.max(...allX) + padX;
const yAxisMin = Math.min(...allY) - padY;
const yAxisMax = Math.max(...allY) + padY;

const marginTop = 110;
const marginBottom = 50;
const marginLeft = 130;
const marginRight = 210;
const availW = size.width - marginLeft - marginRight;
const availH = size.height - marginTop - marginBottom;
const dataW = xAxisMax - xAxisMin;
const dataH = yAxisMax - yAxisMin;
const gridScale = Math.min(availW / dataW, availH / dataH);
const gridWidth = dataW * gridScale;
const gridHeight = dataH * gridScale;
const gridLeft = marginLeft + (availW - gridWidth) / 2;
const gridTop = marginTop + (availH - gridHeight) / 2;

// --- Title (fontsize scaled to the 67-char baseline) -------------------------
const titleText = "Yield Response Surface · surface-basic · javascript · echarts · anyplot.ai";
const titleFontSize = Math.max(15, Math.round(22 * Math.min(1, 67 / titleText.length)));

// --- Init ---------------------------------------------------------------------
const chart = echarts.init(document.getElementById("container"));

// --- Option -------------------------------------------------------------------
const option = {
  animation: false,
  backgroundColor: "transparent",
  color: t.palette,
  title: {
    text: titleText,
    left: "center",
    top: 30,
    textStyle: { color: t.ink, fontSize: titleFontSize, fontWeight: "medium" },
  },
  visualMap: {
    seriesIndex: 2,
    dimension: 0,
    min: zMin,
    max: zMax,
    inRange: { color: t.seq },
    orient: "vertical",
    right: 30,
    top: "middle",
    text: ["High yield (%)", "Low yield (%)"],
    textStyle: { color: t.inkSoft, fontSize: 13 },
    itemWidth: 14,
    itemHeight: 140,
  },
  grid: { left: gridLeft, top: gridTop, width: gridWidth, height: gridHeight },
  xAxis: { type: "value", min: xAxisMin, max: xAxisMax, show: false },
  yAxis: { type: "value", min: yAxisMin, max: yAxisMax, show: false },
  series: [
    {
      // Temperature axis guide
      type: "line",
      data: [
        [originP[0], originP[1]],
        [tempTipP[0], tempTipP[1]],
      ],
      showSymbol: false,
      silent: true,
      lineStyle: { color: t.inkSoft, width: 1.5 },
      z: 1,
    },
    {
      // Pressure axis guide
      type: "line",
      data: [
        [originP[0], originP[1]],
        [pressureTipP[0], pressureTipP[1]],
      ],
      showSymbol: false,
      silent: true,
      lineStyle: { color: t.inkSoft, width: 1.5 },
      z: 1,
    },
    {
      // The surface itself: one quad per grid cell, colored by yield.
      type: "custom",
      coordinateSystem: "cartesian2d",
      xAxisIndex: 0,
      yAxisIndex: 0,
      data: facetData,
      renderItem: (params, api) => {
        const p0 = api.coord([api.value(1), api.value(2)]);
        const p1 = api.coord([api.value(3), api.value(4)]);
        const p2 = api.coord([api.value(5), api.value(6)]);
        const p3 = api.coord([api.value(7), api.value(8)]);
        return {
          type: "polygon",
          shape: { points: [p0, p1, p2, p3] },
          style: { fill: api.visual("color"), stroke: t.pageBg, lineWidth: 0.6 },
        };
      },
      z: 2,
    },
  ],
};

chart.setOption(option);

// Axis labels and unit ticks, anchored to real data coordinates converted to
// pixels (not a decorative overlay) so they read directly off the static PNG.
const toPixel = (dataPoint) => chart.convertToPixel({ xAxisIndex: 0, yAxisIndex: 0 }, dataPoint);
const axisLabels = [
  { point: tempTipP, text: "Temperature (°C)", dx: 15, dy: -8, font: `16px sans-serif` },
  { point: pressureTipP, text: "Pressure (bar)", dx: -170, dy: -8, font: `16px sans-serif` },
];

// Temperature owns the shared ground origin (150 degC / 1 bar); pressure's
// own min tick is dropped so the two labels don't land on the same pixel.
const tempTicks = [0, 0.5, 1].map((f) => ({
  point: project(GROUND_SPAN * f, 0, 0),
  text: `${Math.round(T_MIN + f * (T_MAX - T_MIN))}°C`,
  dx: 4,
  dy: 4,
  font: "11px sans-serif",
}));
const pressureTicks = [0.5, 1].map((f) => ({
  point: project(0, 0, GROUND_SPAN * f),
  text: `${(P_MIN + f * (P_MAX - P_MIN)).toFixed(0)} bar`,
  dx: -46,
  dy: -2,
  font: "11px sans-serif",
}));

chart.setOption({
  graphic: [...axisLabels, ...tempTicks, ...pressureTicks].map((a) => {
    const pixel = toPixel([a.point[0], a.point[1]]);
    return {
      type: "text",
      left: pixel[0] + a.dx,
      top: pixel[1] + a.dy,
      silent: true,
      style: { text: a.text, fill: t.inkSoft, font: a.font },
    };
  }).concat([
    {
      // Z-axis title above the colorbar — height is encoded by both the
      // surface's elevation and this scale, so the colorbar is the z-axis.
      type: "text",
      right: 15,
      top: size.height / 2 - 130,
      silent: true,
      style: { text: "Yield (%)", fill: t.ink, font: "16px sans-serif", textAlign: "right" },
    },
  ]),
});
Runnable source as JSON, for any HTTP client: https://api.anyplot.ai/specs/surface-basic/echarts/code. Any spec id and library id listed in llms-full.txt fit the same URL shape; every URL below is complete and callable.
{
  "spec_id": "surface-basic",
  "language": "javascript",
  "library": "echarts",
  "page": "https://anyplot.ai/surface-basic/javascript/echarts",
  "hub": "https://anyplot.ai/surface-basic",
  "code_json": "https://api.anyplot.ai/specs/surface-basic/echarts/code",
  "spec_json": "https://api.anyplot.ai/specs/surface-basic",
  "render_light_png": "https://storage.googleapis.com/anyplot-images/plots/surface-basic/javascript/echarts/plot-light.png",
  "render_dark_png": "https://storage.googleapis.com/anyplot-images/plots/surface-basic/javascript/echarts/plot-dark.png",
  "interactive_light_html": "https://storage.googleapis.com/anyplot-images/plots/surface-basic/javascript/echarts/plot-light.html",
  "interactive_dark_html": "https://storage.googleapis.com/anyplot-images/plots/surface-basic/javascript/echarts/plot-dark.html",
  "quality_score": 90.0,
  "license": "MIT",
  "guide": "https://anyplot.ai/llms.txt"
}
Part of Basic 3D Surface Plot on anyplot.ai.