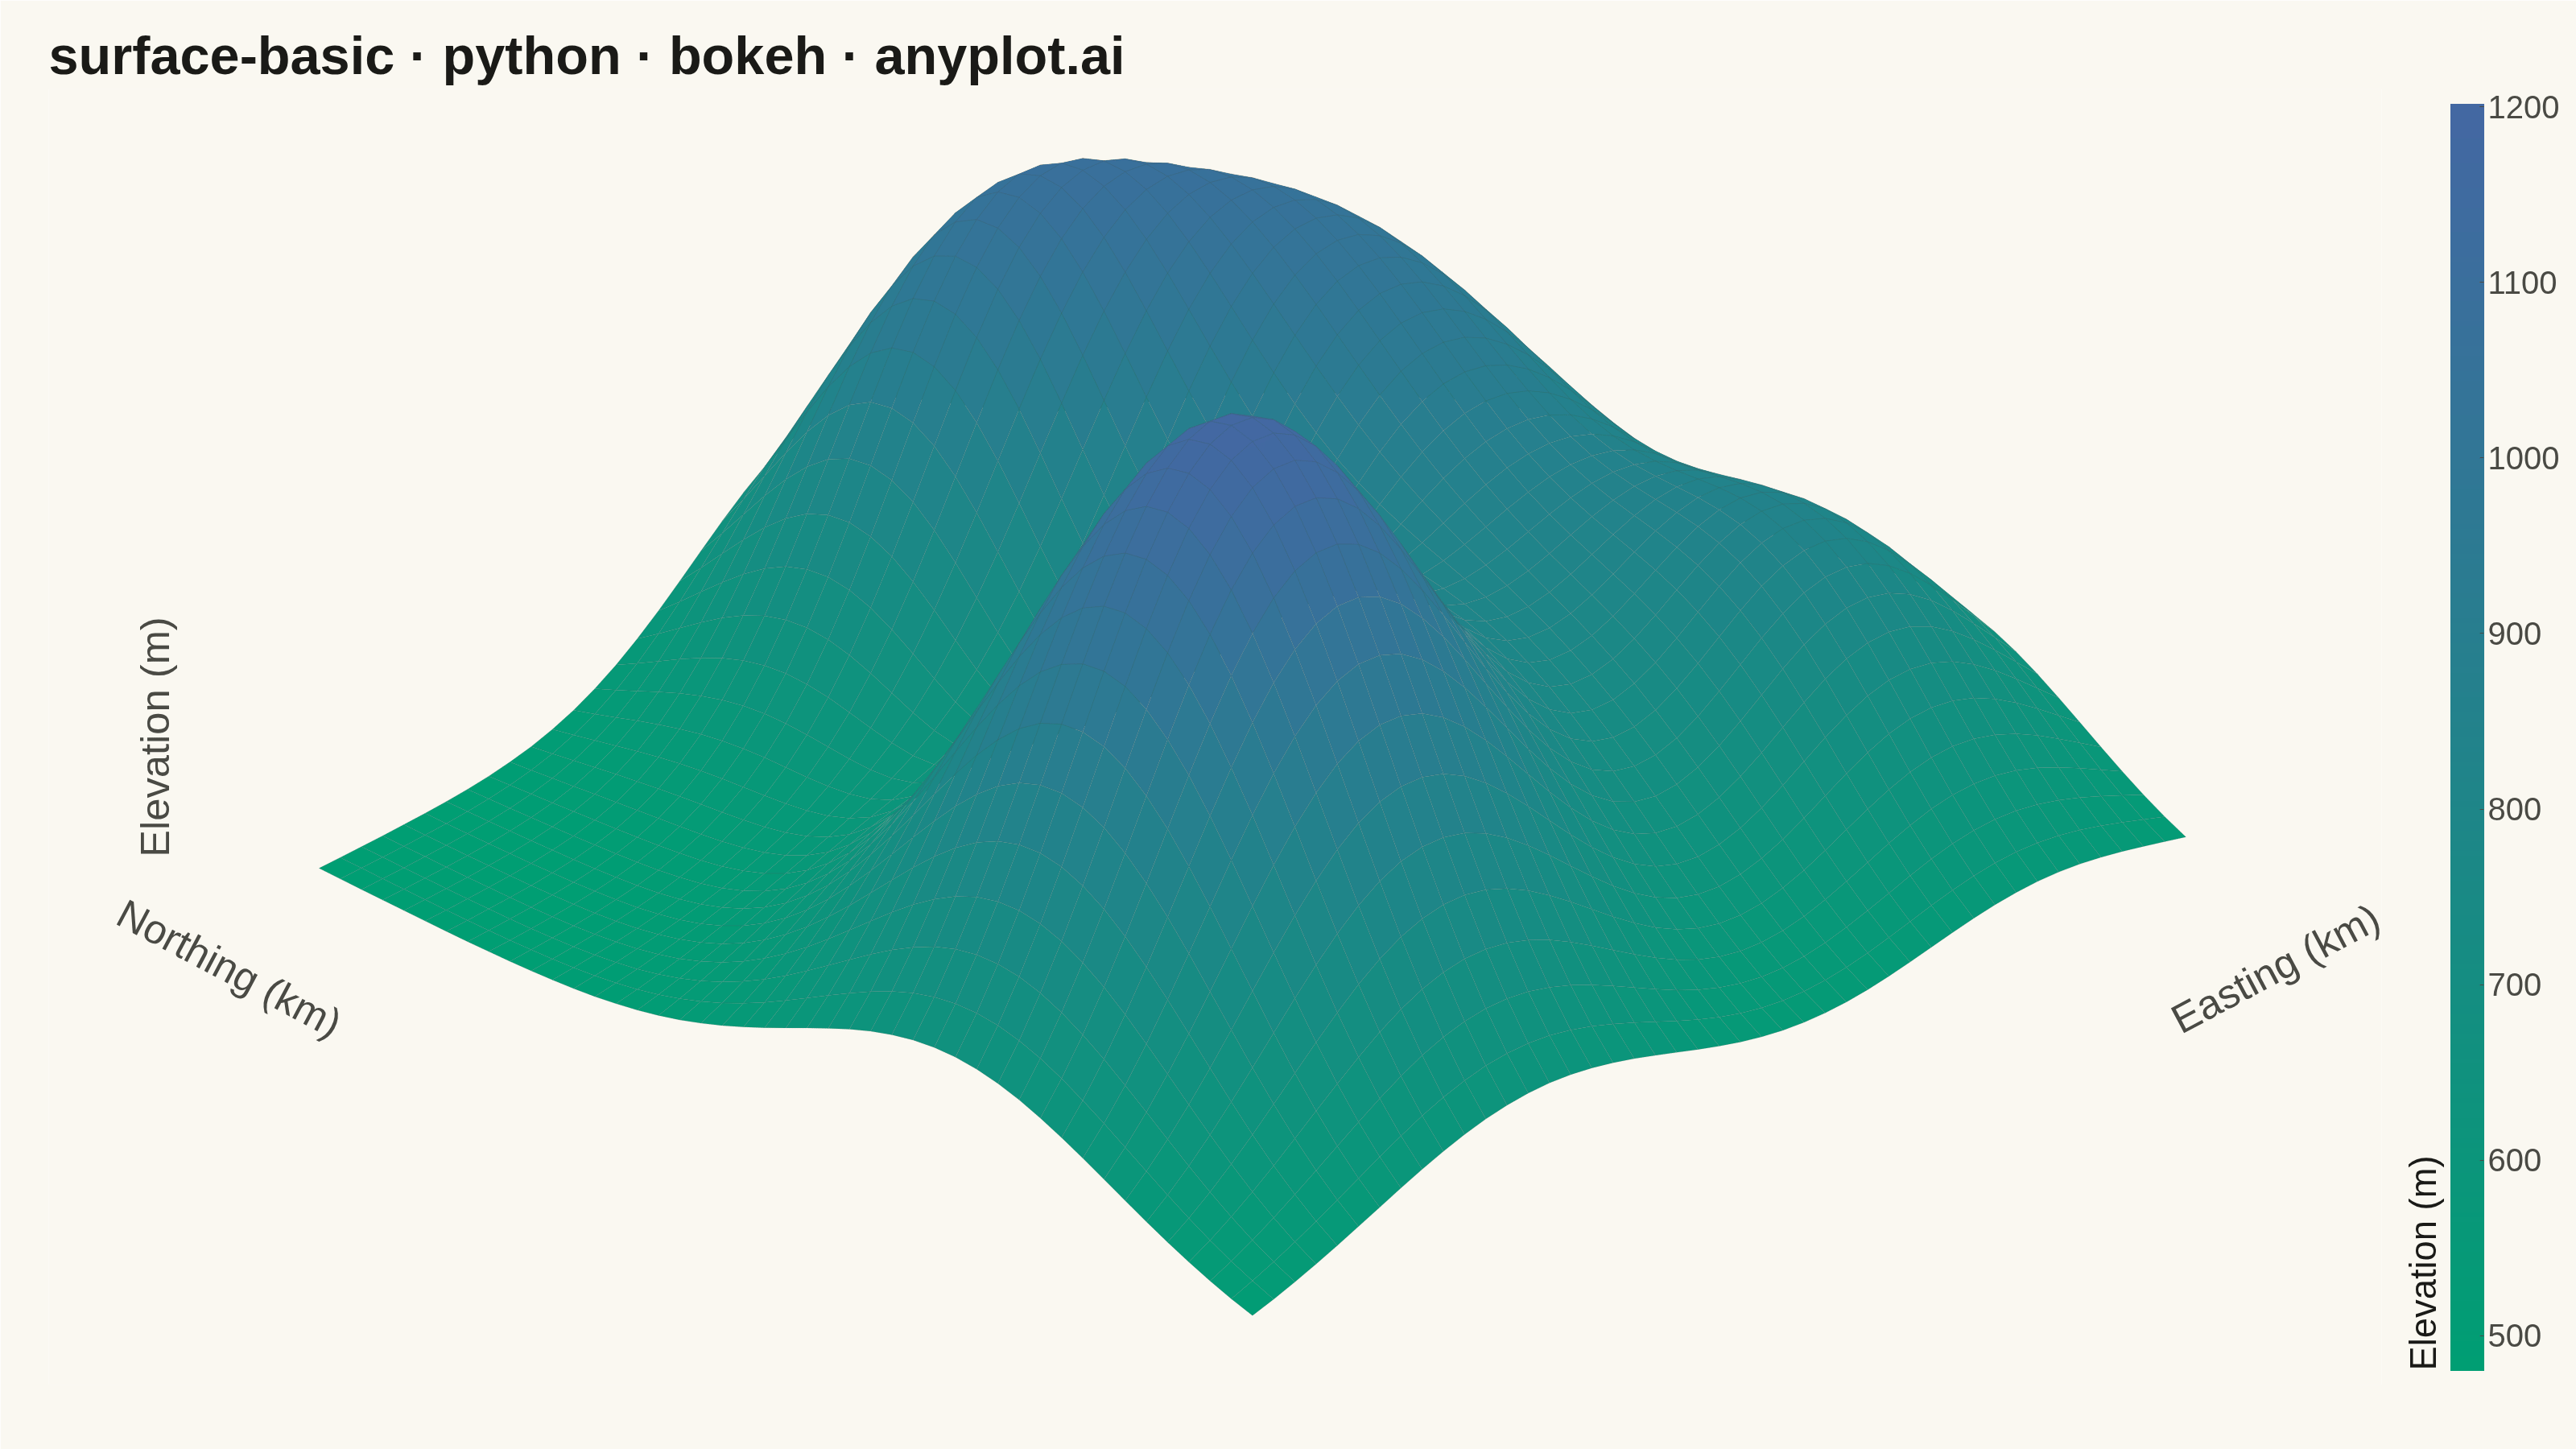
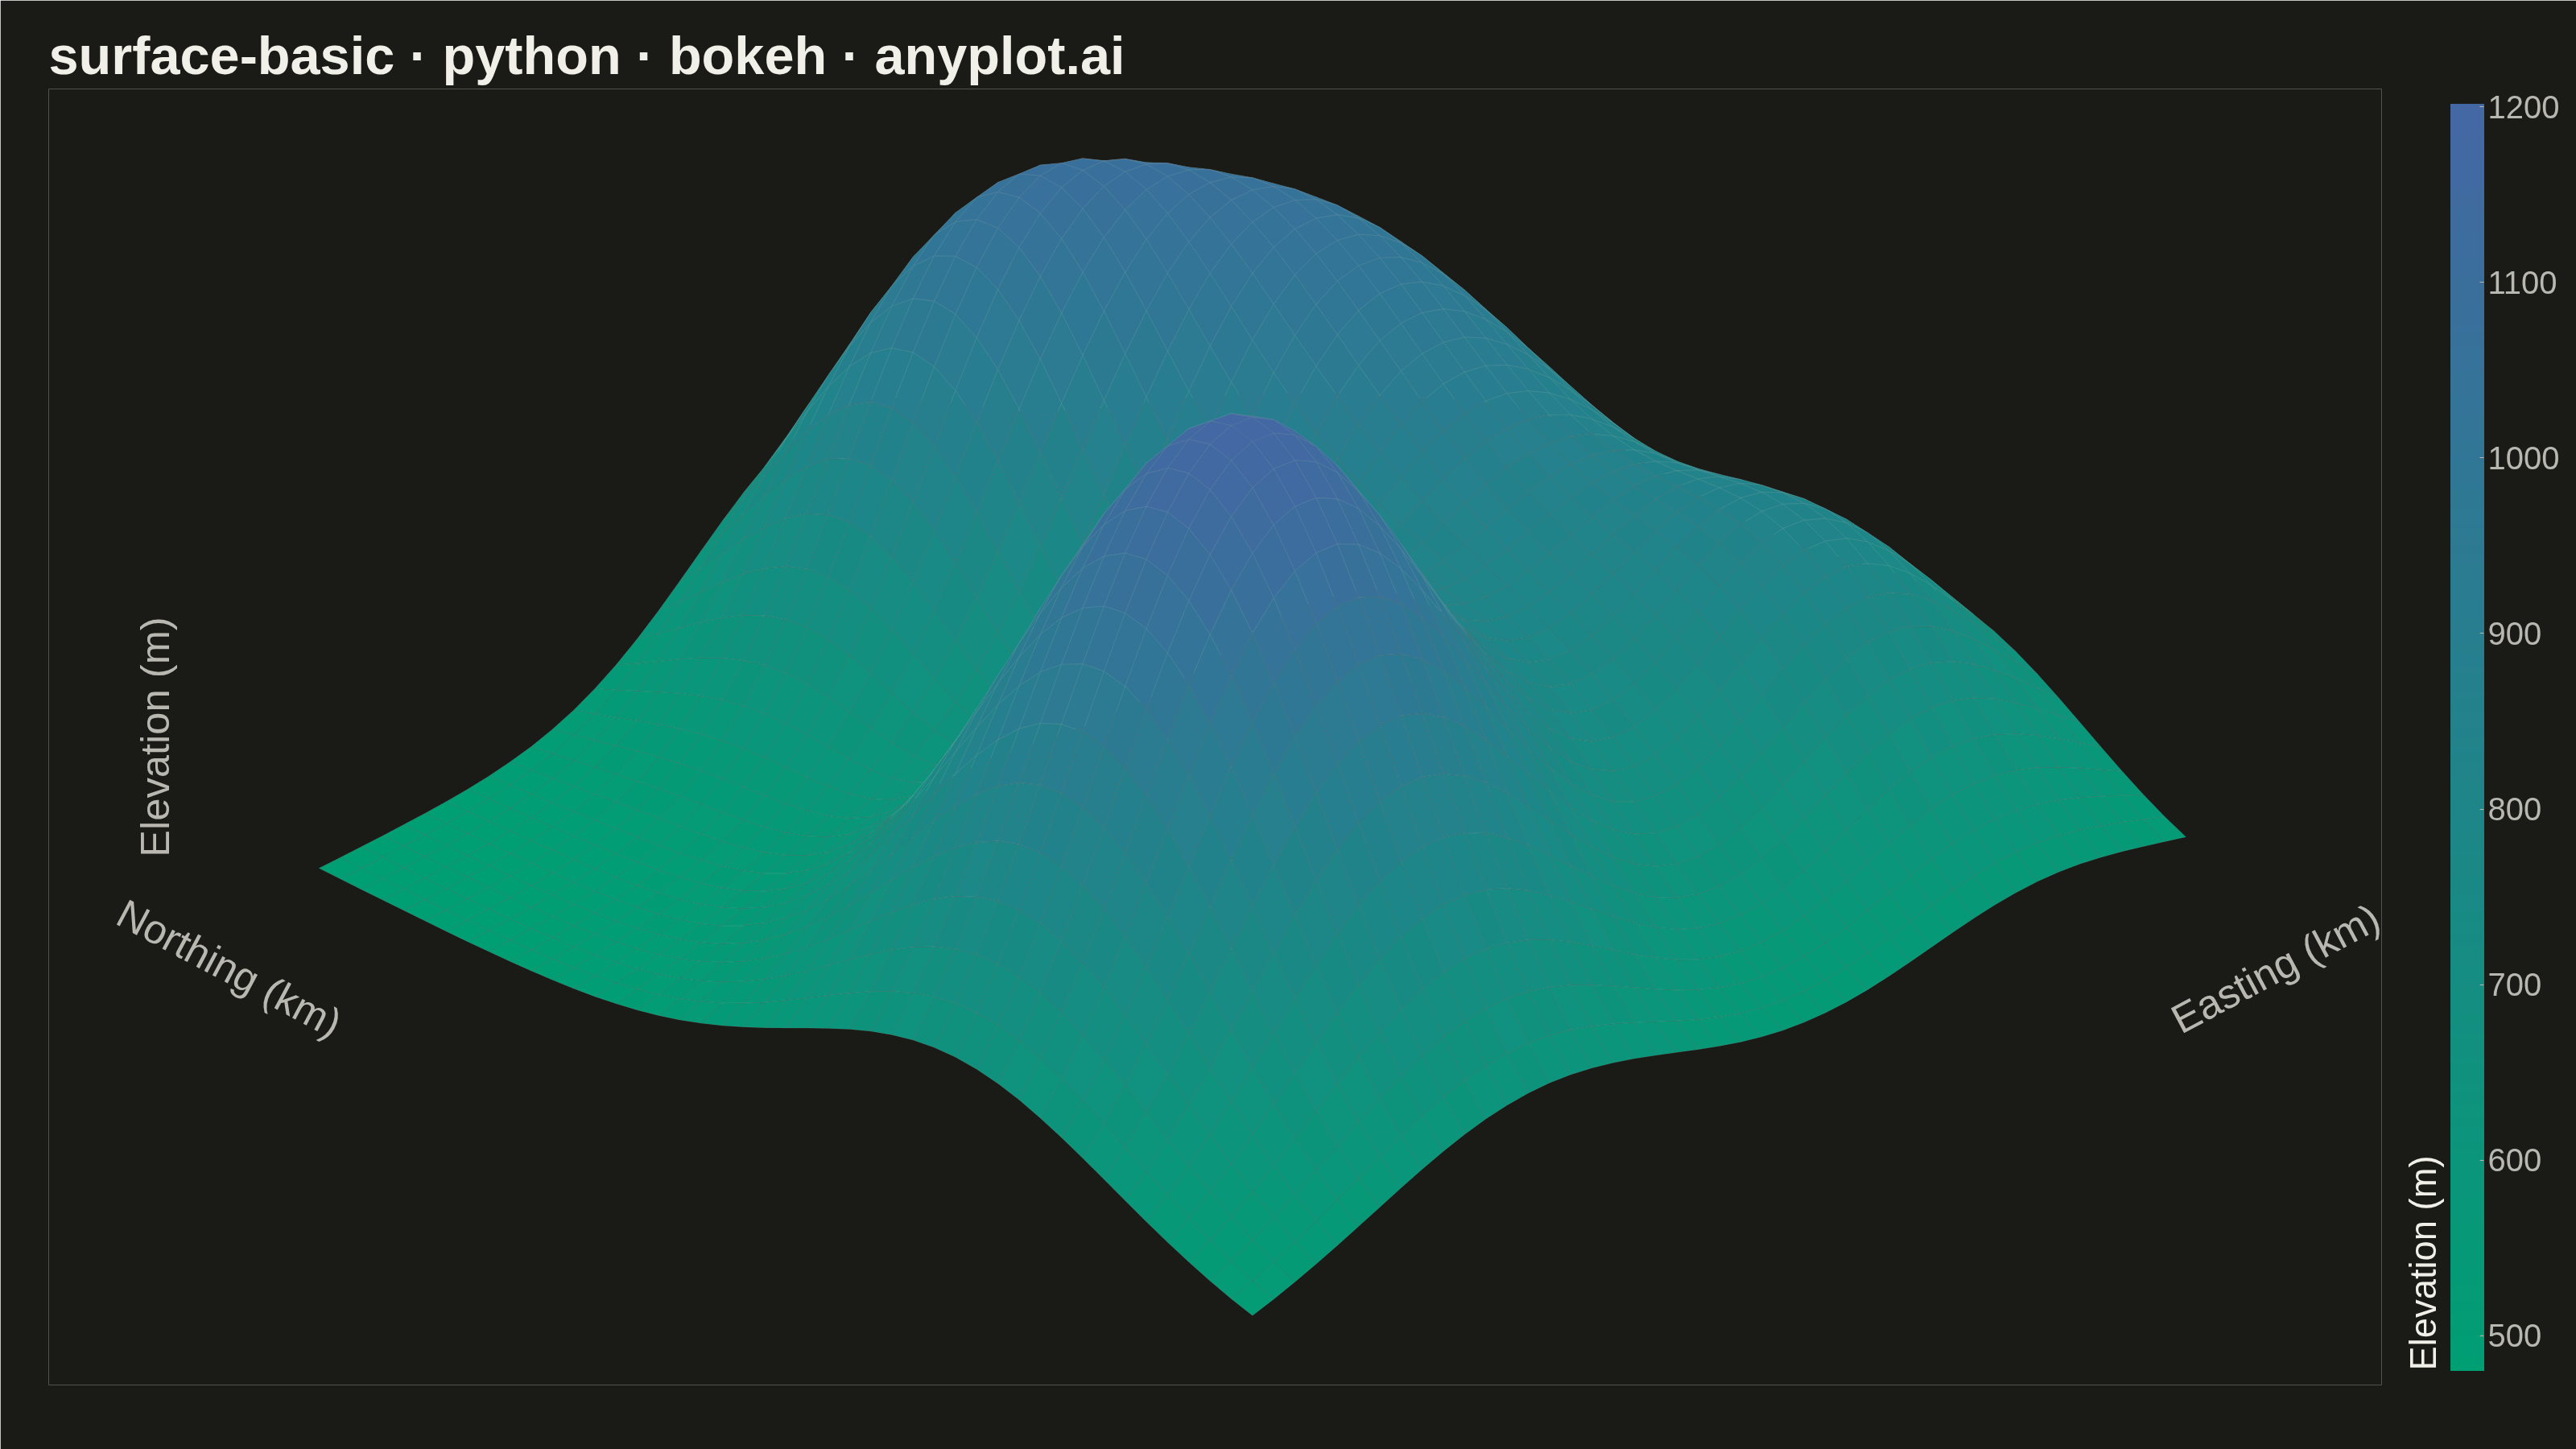
A 3D surface plot visualizes a function of two variables as a continuous surface in three-dimensional space. The height (z-axis) represents the function value at each (x, y) point, with color encoding the same information to enhance depth perception. This visualization is ideal for understanding mathematical functions, terrain data, and response surfaces where the relationship between two inputs and one output needs to be explored.
""" anyplot.ai
surface-basic: Basic 3D Surface Plot
Library: bokeh 3.9.1 | Python 3.13.13
Quality: 93/100 | Updated: 2026-06-16
"""

import os
import time
from pathlib import Path

import numpy as np
from bokeh.io import output_file, save
from bokeh.models import ColorBar, LinearColorMapper
from bokeh.plotting import figure
from selenium import webdriver
from selenium.webdriver.chrome.options import Options


# Theme tokens (see prompts/default-style-guide.md "Theme-adaptive Chrome")
THEME = os.getenv("ANYPLOT_THEME", "light")
PAGE_BG = "#FAF8F1" if THEME == "light" else "#1A1A17"
ELEVATED_BG = "#FFFDF6" if THEME == "light" else "#242420"
INK = "#1A1A17" if THEME == "light" else "#F0EFE8"
INK_SOFT = "#4A4A44" if THEME == "light" else "#B8B7B0"


# Imprint sequential colormap (brand green -> blue), the only allowed
# single-polarity continuous ramp. Build a 256-stop gradient by interpolating
# the two endpoints in RGB space.
green_rgb = np.array([0x00, 0x9E, 0x73])
blue_rgb = np.array([0x44, 0x67, 0xA3])
IMPRINT_SEQ256 = [
    "#{:02X}{:02X}{:02X}".format(*np.round(green_rgb + (blue_rgb - green_rgb) * t / 255).astype(int))
    for t in range(256)
]

# Data - a smooth synthetic terrain (sum of Gaussian hills) over a 10x10 km tile.
# Single-polarity elevation in metres -> imprint_seq colormap.
n_points = 45
easting = np.linspace(0, 10, n_points)
northing = np.linspace(0, 10, n_points)
X, Y = np.meshgrid(easting, northing)

# Each hill: (centre_x, centre_y, peak_height_m, spread); the last is a basin.
hills = [(3.0, 3.2, 720, 1.7), (7.0, 6.4, 540, 1.9), (5.2, 8.4, 360, 1.3), (8.4, 2.4, 300, 1.4), (4.6, 5.6, -220, 1.2)]
elevation = 480 + sum(
    height * np.exp(-((X - cx) ** 2 + (Y - cy) ** 2) / (2 * spread**2)) for cx, cy, height, spread in hills
)

# Vertical geometry: normalise elevation into the x/y coordinate range so the
# isometric projection isn't crushed or exaggerated. Colour still uses metres.
z_visual = (elevation - elevation.min()) / (elevation.max() - elevation.min()) * 5.0

# 3D -> 2D isometric projection (elevation 28 deg, azimuth 45 deg)
elev_rad = np.radians(28)
azim_rad = np.radians(45)

Xc, Yc = X - 5.0, Y - 5.0
X_rot = Xc * np.cos(azim_rad) - Yc * np.sin(azim_rad)
Y_rot = Xc * np.sin(azim_rad) + Yc * np.cos(azim_rad)
X_proj = X_rot
Z_proj = Y_rot * np.sin(elev_rad) + z_visual * np.cos(elev_rad)

# Build one quad per grid cell, with depth + colour from the cell average
elev_min, elev_max = elevation.min(), elevation.max()
quads = []
for i in range(n_points - 1):
    for j in range(n_points - 1):
        xs = [X_proj[i, j], X_proj[i, j + 1], X_proj[i + 1, j + 1], X_proj[i + 1, j]]
        ys = [Z_proj[i, j], Z_proj[i, j + 1], Z_proj[i + 1, j + 1], Z_proj[i + 1, j]]
        avg_elev = (elevation[i, j] + elevation[i, j + 1] + elevation[i + 1, j + 1] + elevation[i + 1, j]) / 4
        depth = (Y_rot[i, j] + Y_rot[i, j + 1] + Y_rot[i + 1, j + 1] + Y_rot[i + 1, j]) / 4
        quads.append((depth, xs, ys, avg_elev))

# Painter's algorithm: draw back (far) quads first
quads.sort(key=lambda q: q[0], reverse=True)
quad_xs = [q[1] for q in quads]
quad_ys = [q[2] for q in quads]
quad_idx = [int((q[3] - elev_min) / (elev_max - elev_min) * 255) for q in quads]
quad_fill = [IMPRINT_SEQ256[max(0, min(255, k))] for k in quad_idx]

# Plot
p = figure(
    width=3200,
    height=1800,
    title="surface-basic · python · bokeh · anyplot.ai",
    toolbar_location=None,
    tools="",
    min_border_top=110,
    min_border_left=60,
    min_border_bottom=80,
    min_border_right=80,
)

# Surface: filled quads with subtle edges to read the mesh and aid depth
p.patches(xs=quad_xs, ys=quad_ys, fill_color=quad_fill, line_color=INK_SOFT, line_alpha=0.22, line_width=0.6)

# Floating, descriptive axis labels (a projected 3D surface has no flat axes)
x_lo, x_hi = min(min(v) for v in quad_xs), max(max(v) for v in quad_xs)
y_lo, y_hi = min(min(v) for v in quad_ys), max(max(v) for v in quad_ys)
x_pad = (x_hi - x_lo) * 0.16

p.text(
    x=[x_hi + x_pad * 0.30],
    y=[y_lo + (y_hi - y_lo) * 0.30],
    text=["Easting (km)"],
    text_font_size="38pt",
    text_color=INK_SOFT,
    text_align="center",
    text_baseline="middle",
    angle=np.radians(28),
)
p.text(
    x=[x_lo - x_pad * 0.30],
    y=[y_lo + (y_hi - y_lo) * 0.30],
    text=["Northing (km)"],
    text_font_size="38pt",
    text_color=INK_SOFT,
    text_align="center",
    text_baseline="middle",
    angle=np.radians(-28),
)
p.text(
    x=[x_lo - x_pad * 0.55],
    y=[(y_lo + y_hi) / 2],
    text=["Elevation (m)"],
    text_font_size="38pt",
    text_color=INK_SOFT,
    text_align="center",
    text_baseline="middle",
    angle=np.radians(90),
)

# Colorbar for the elevation scale
color_mapper = LinearColorMapper(palette=IMPRINT_SEQ256, low=elev_min, high=elev_max)
color_bar = ColorBar(
    color_mapper=color_mapper,
    width=42,
    padding=18,
    title="Elevation (m)",
    title_text_font_size="34pt",
    title_text_color=INK,
    title_text_font_style="normal",
    title_standoff=16,
    major_label_text_font_size="30pt",
    major_label_text_color=INK_SOFT,
    major_tick_line_color=INK_SOFT,
    background_fill_color=ELEVATED_BG,
    background_fill_alpha=0.0,
)
p.add_layout(color_bar, "right")

# Style - clean, frameless projection
p.x_range.range_padding = 0.10
p.y_range.range_padding = 0.12
p.title.text_font_size = "50pt"
p.title.text_color = INK
p.xaxis.visible = False
p.yaxis.visible = False
p.xgrid.grid_line_color = None
p.ygrid.grid_line_color = None
p.outline_line_color = None
p.background_fill_color = PAGE_BG
p.border_fill_color = PAGE_BG

# Save - interactive HTML (catalog artifact) + headless-Chrome screenshot
output_file(f"plot-{THEME}.html", title="surface-basic · python · bokeh · anyplot.ai")
save(p)

W, H = 3200, 1800
opts = Options()
for arg in (
    "--headless=new",
    "--no-sandbox",
    "--disable-dev-shm-usage",
    "--disable-gpu",
    f"--window-size={W},{H}",
    "--hide-scrollbars",
):
    opts.add_argument(arg)
driver = webdriver.Chrome(options=opts)
driver.set_window_size(W, H)
driver.get(f"file://{Path(f'plot-{THEME}.html').resolve()}")

# Headless Chrome reserves some window chrome, so the inner viewport ends up
# shorter than the requested window. Grow the window by that delta so the inner
# viewport is exactly W x H and the screenshot captures the full bokeh canvas.
inner_w, inner_h = driver.execute_script("return [window.innerWidth, window.innerHeight]")
driver.set_window_size(W + (W - inner_w), H + (H - inner_h))

time.sleep(3)  # let bokeh's JS render the canvas
driver.save_screenshot(f"plot-{THEME}.png")
driver.quit()
Runnable source as JSON, for any HTTP client: https://api.anyplot.ai/specs/surface-basic/bokeh/code. Any spec id and library id listed in llms-full.txt fit the same URL shape; every URL below is complete and callable.
{
  "spec_id": "surface-basic",
  "language": "python",
  "library": "bokeh",
  "page": "https://anyplot.ai/surface-basic/python/bokeh",
  "hub": "https://anyplot.ai/surface-basic",
  "code_json": "https://api.anyplot.ai/specs/surface-basic/bokeh/code",
  "spec_json": "https://api.anyplot.ai/specs/surface-basic",
  "render_light_png": "https://storage.googleapis.com/anyplot-images/plots/surface-basic/python/bokeh/plot-light.png",
  "render_dark_png": "https://storage.googleapis.com/anyplot-images/plots/surface-basic/python/bokeh/plot-dark.png",
  "interactive_light_html": "https://storage.googleapis.com/anyplot-images/plots/surface-basic/python/bokeh/plot-light.html",
  "interactive_dark_html": "https://storage.googleapis.com/anyplot-images/plots/surface-basic/python/bokeh/plot-dark.html",
  "quality_score": 93.0,
  "license": "MIT",
  "guide": "https://anyplot.ai/llms.txt"
}
Part of Basic 3D Surface Plot on anyplot.ai.