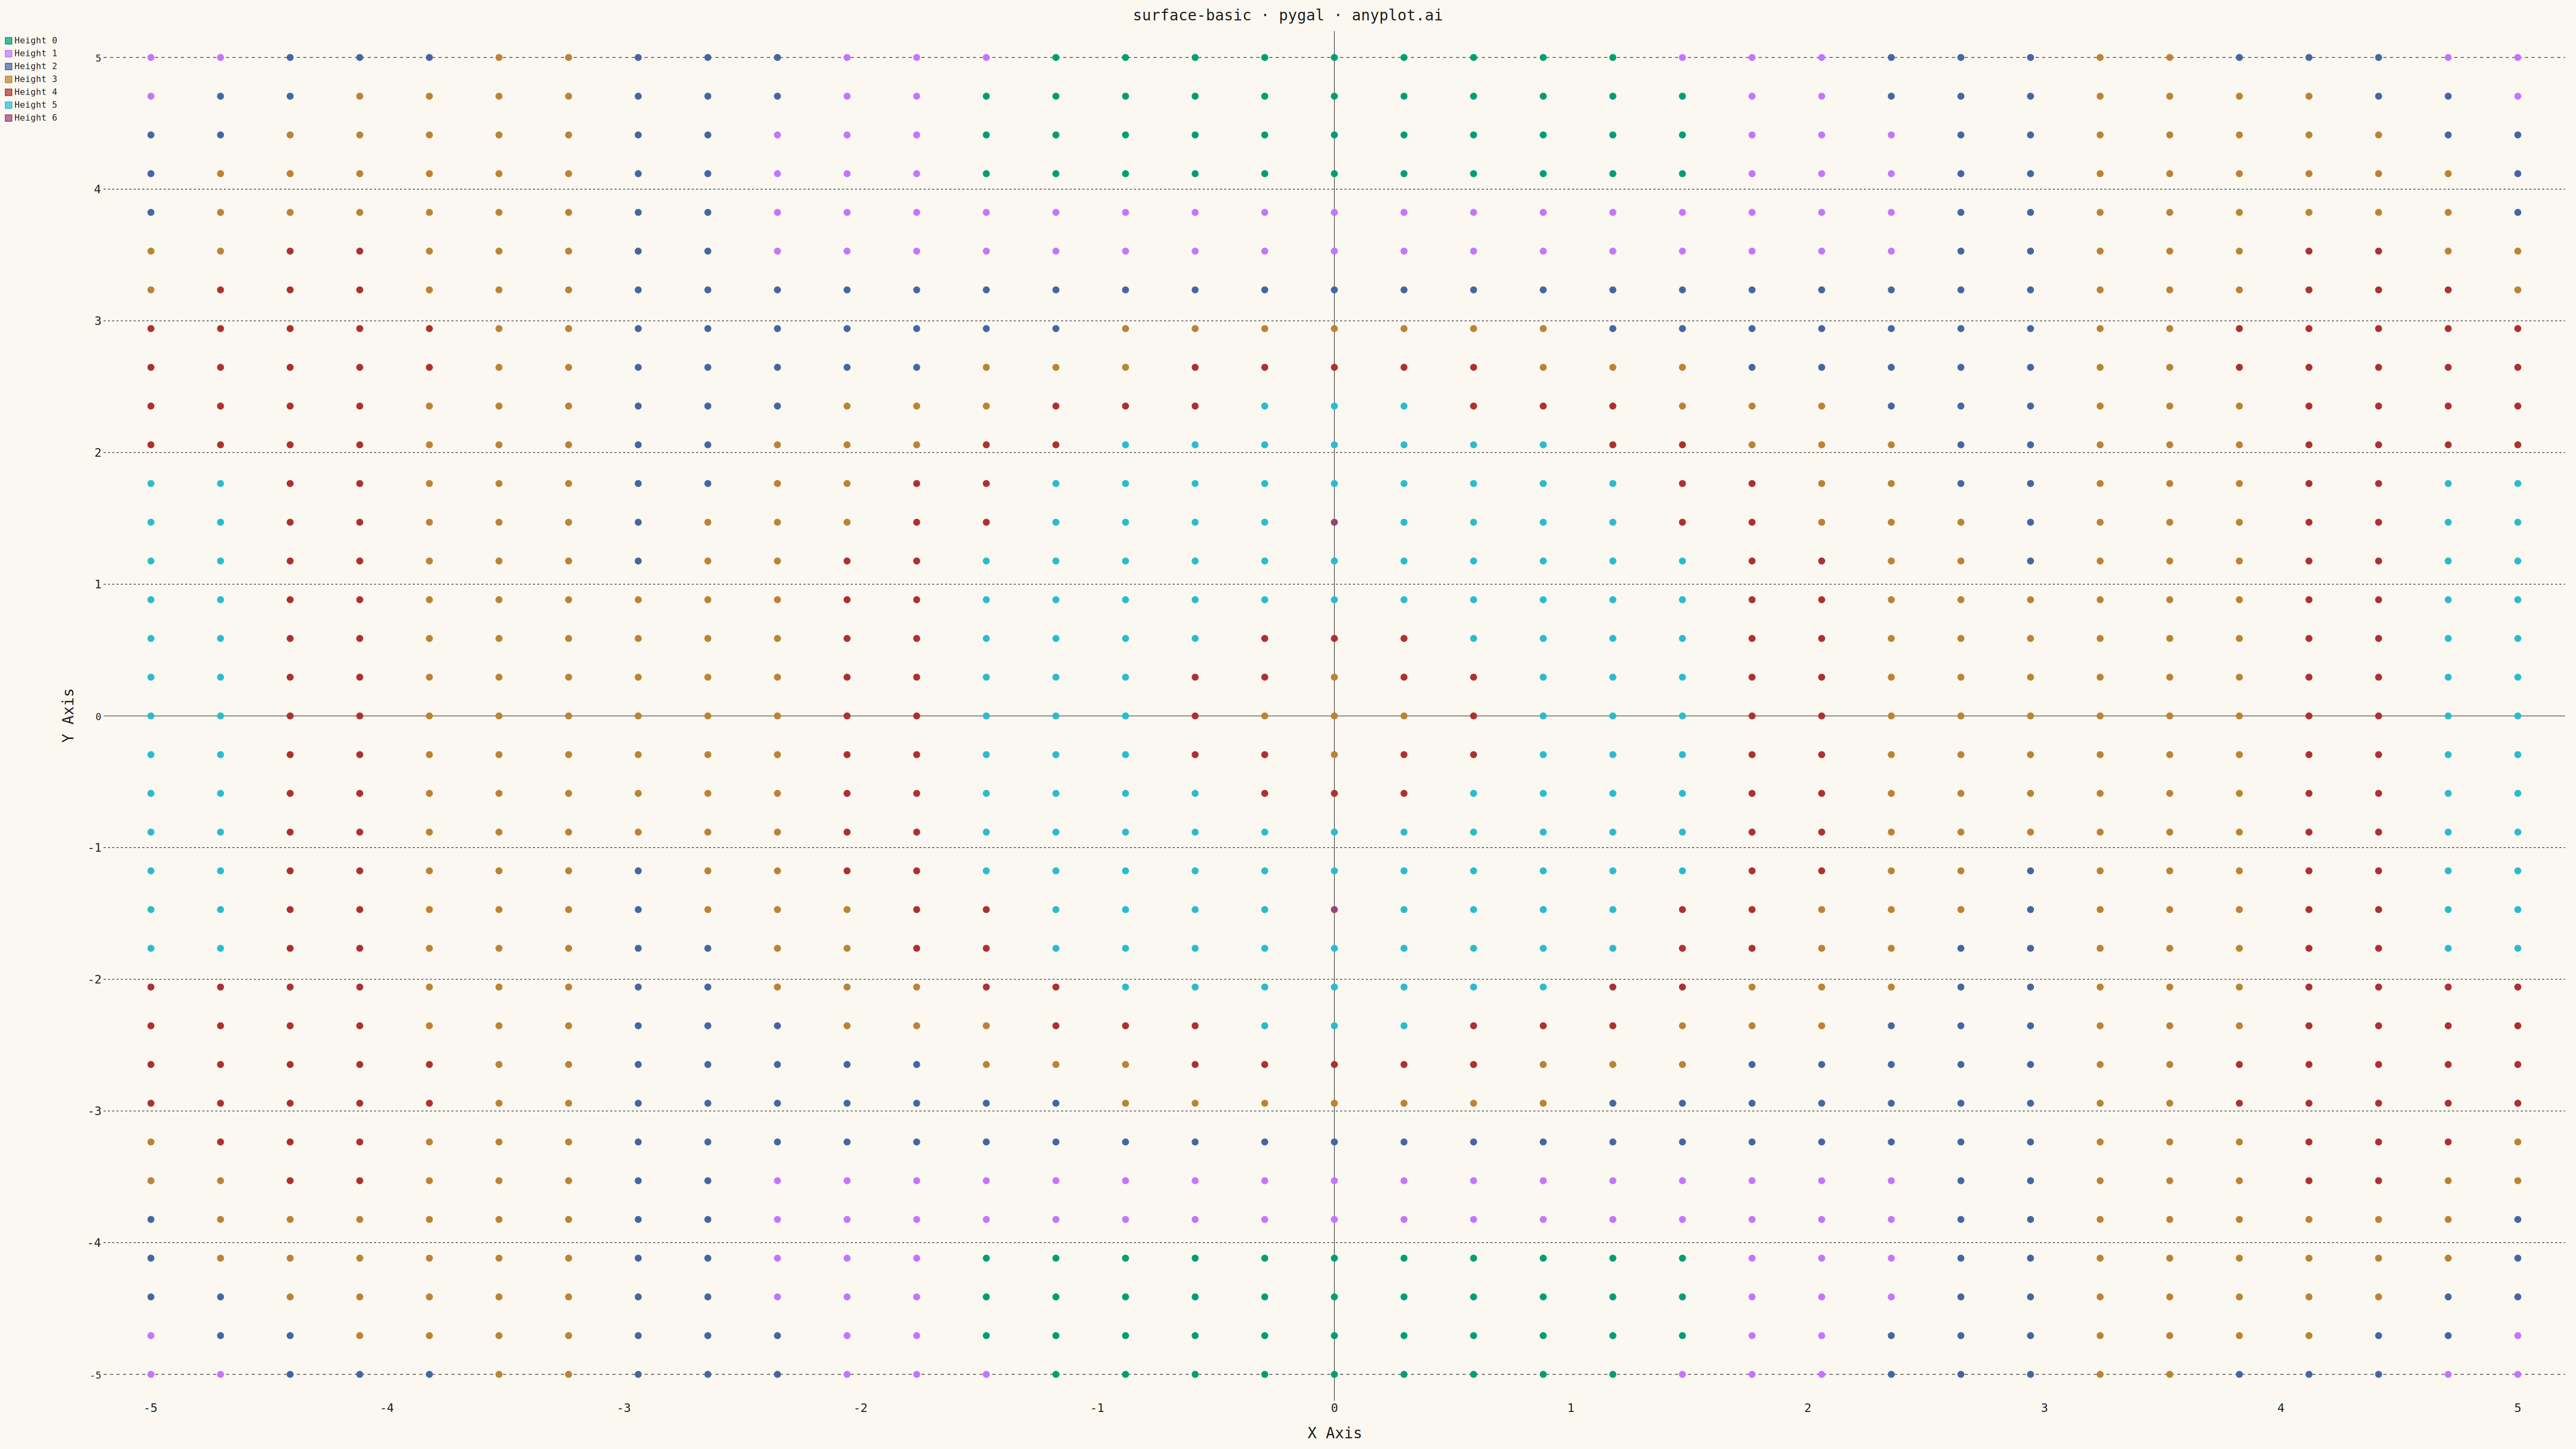
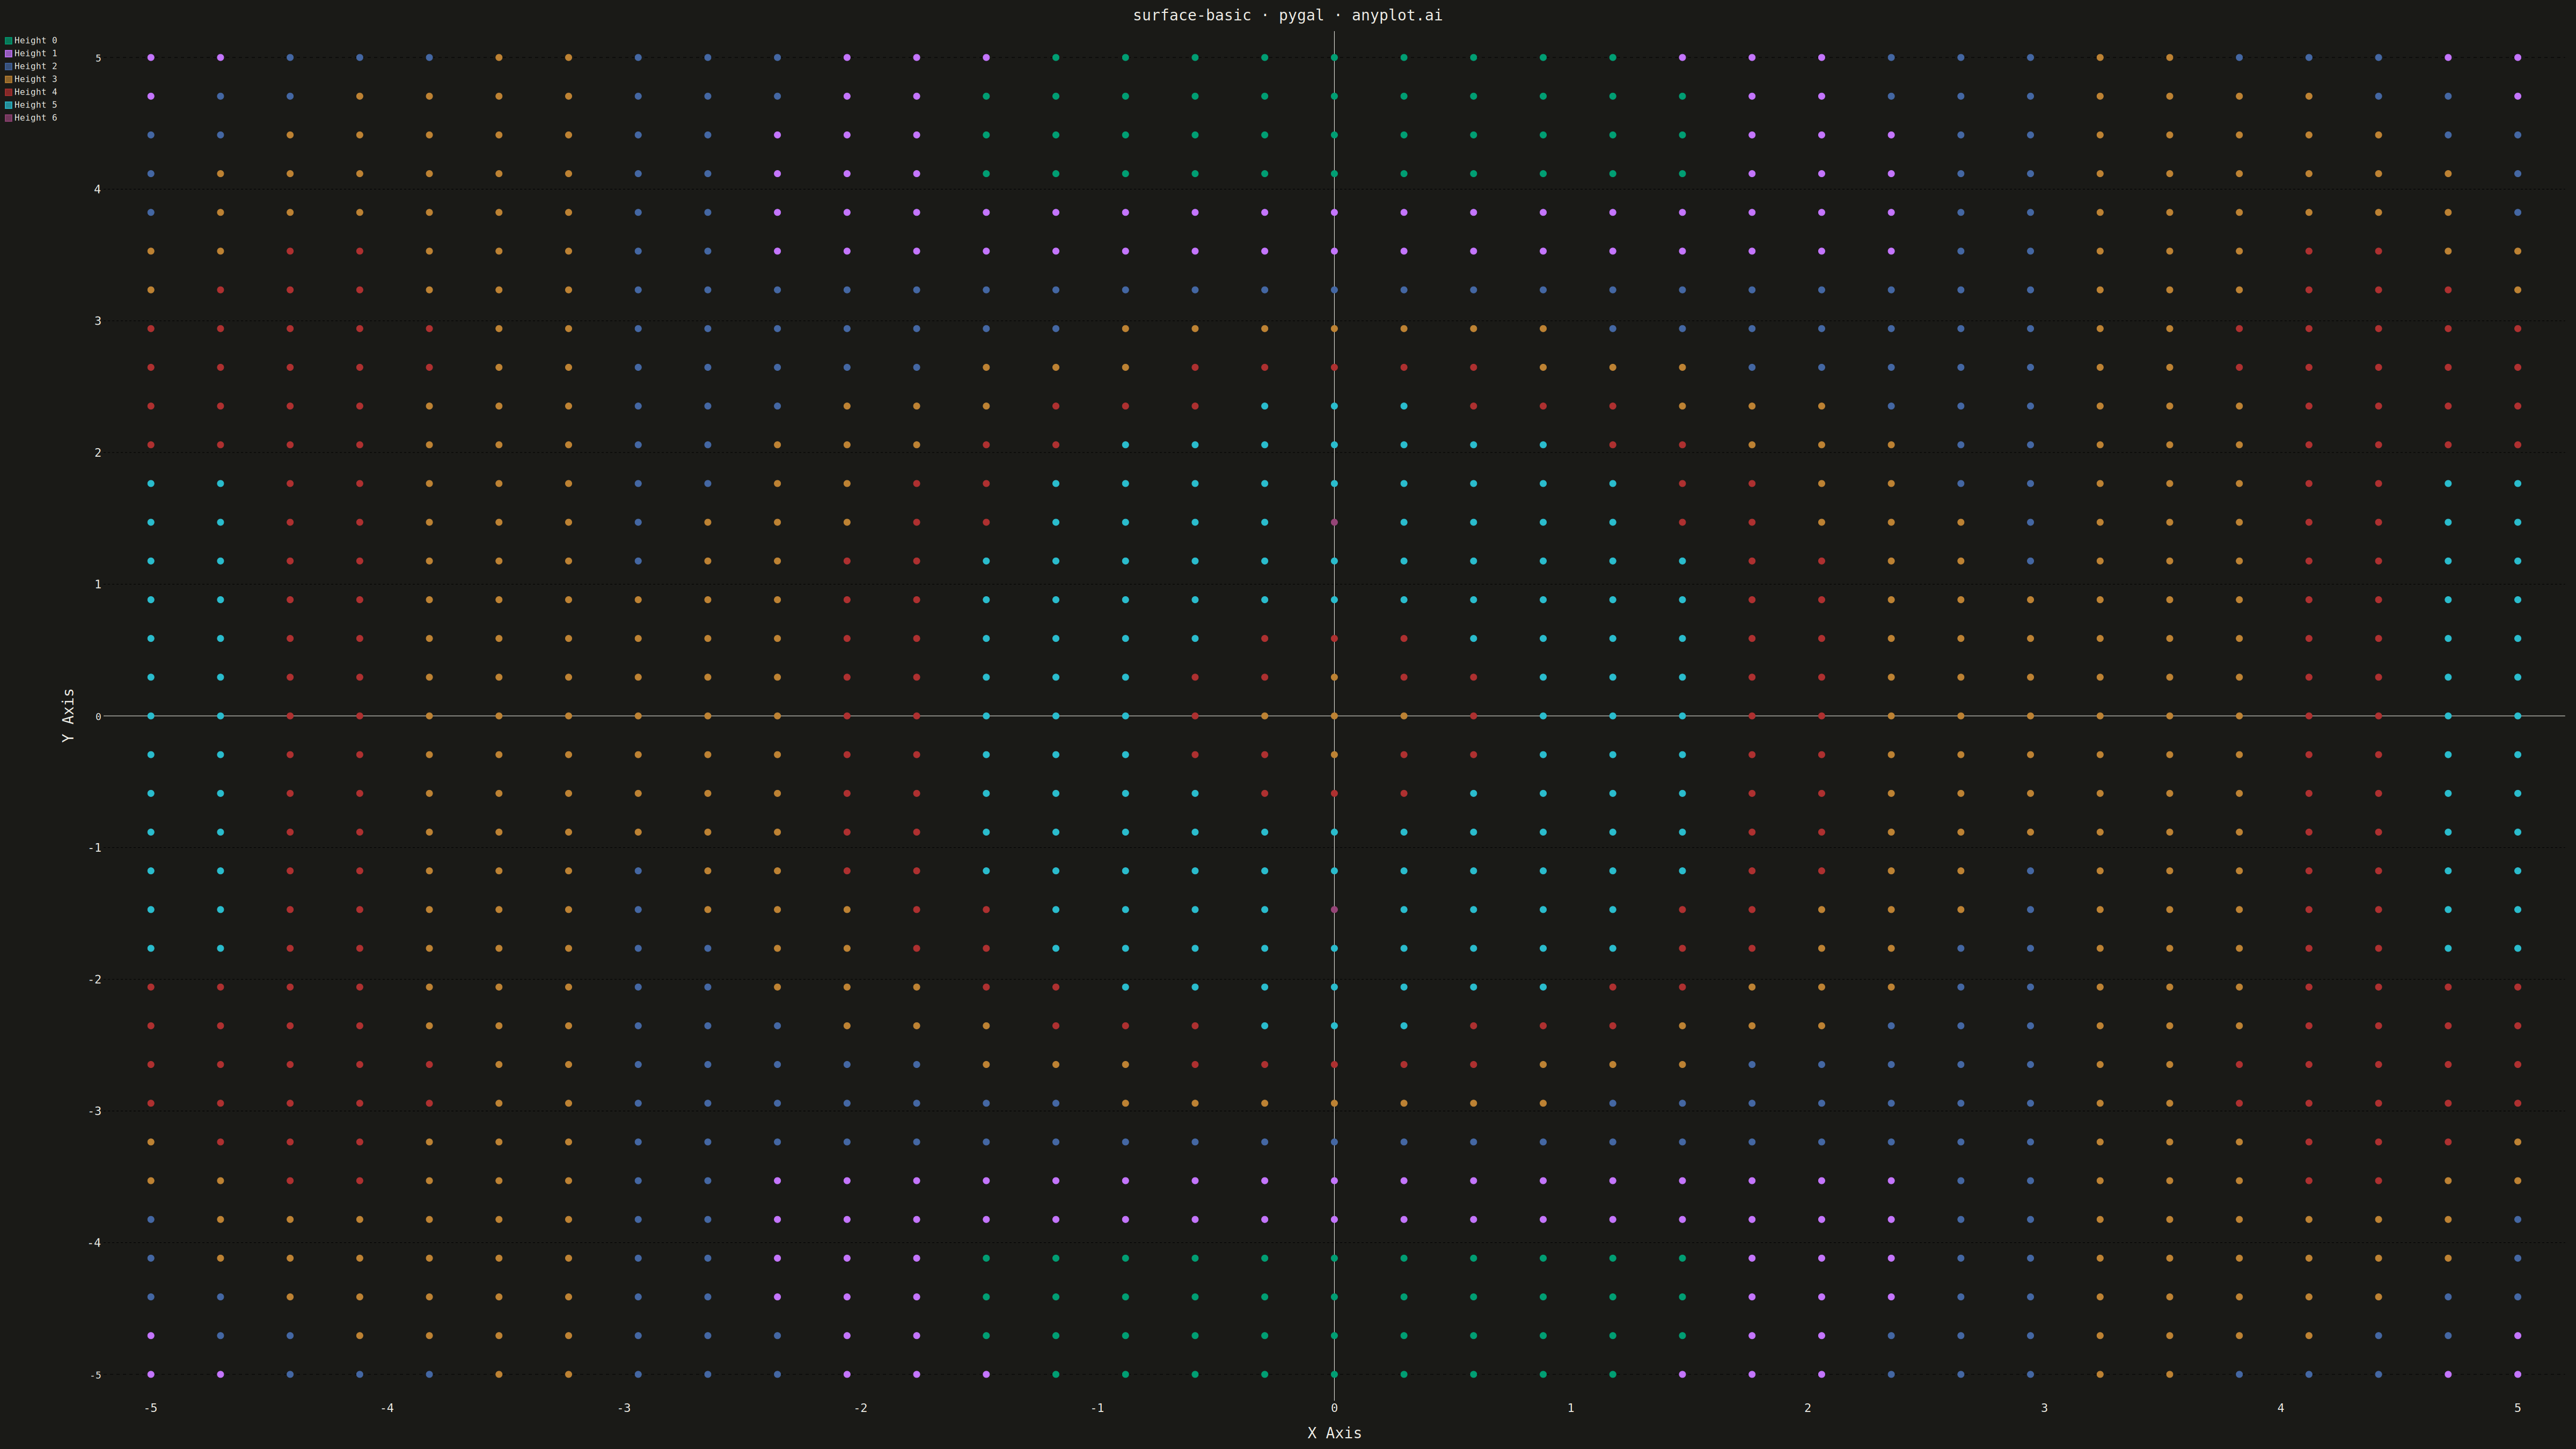
A 3D surface plot visualizes a function of two variables as a continuous surface in three-dimensional space. The height (z-axis) represents the function value at each (x, y) point, with color encoding the same information to enhance depth perception. This visualization is ideal for understanding mathematical functions, terrain data, and response surfaces where the relationship between two inputs and one output needs to be explored.
""" anyplot.ai
surface-basic: Basic 3D Surface Plot
Library: pygal 3.1.0 | Python 3.13.13
Quality: 74/100 | Created: 2026-05-05
"""

import os
import pathlib
import sys
script_dir = str(pathlib.Path(__file__).parent)
sys.path = [p for p in sys.path if p != script_dir and p != "."]

import numpy as np
import pygal
from matplotlib.colors import Normalize
from pygal.style import Style


THEME = os.getenv("ANYPLOT_THEME", "light")

PAGE_BG = "#FAF8F1" if THEME == "light" else "#1A1A17"
INK = "#1A1A17" if THEME == "light" else "#F0EFE8"
INK_MUTED = "#6B6A63" if THEME == "light" else "#A8A79F"

IMPRINT = ("#009E73", "#C475FD", "#4467A3", "#BD8233", "#AE3030", "#2ABCCD", "#954477")

custom_style = Style(
    background=PAGE_BG,
    plot_background=PAGE_BG,
    foreground=INK,
    foreground_strong=INK,
    foreground_subtle=INK_MUTED,
    colors=IMPRINT,
    title_font_size=28,
    label_font_size=22,
    major_label_font_size=18,
    legend_font_size=16,
    value_font_size=14,
    stroke_width=2,
)

np.random.seed(42)
x = np.linspace(-5, 5, 35)
y = np.linspace(-5, 5, 35)
X, Y = np.meshgrid(x, y)
Z = np.sin(np.sqrt(X**2 + Y**2)) * np.cos(X * 0.5)

z_min, z_max = Z.min(), Z.max()
norm = Normalize(vmin=z_min, vmax=z_max)

z_binned = (norm(Z.flatten()) * 6).astype(int)
z_binned = np.clip(z_binned, 0, 6)

xy_pairs = list(zip(X.flatten(), Y.flatten(), z_binned, strict=False))

chart = pygal.XY(
    style=custom_style,
    width=4800,
    height=2700,
    title="surface-basic · pygal · anyplot.ai",
    x_title="X Axis",
    y_title="Y Axis",
    show_legend=True,
    dots_size=6,
    stroke=False,
)

for bin_idx in range(7):
    points = [(x, y) for x, y, z in xy_pairs if z == bin_idx]
    if points:
        chart.add(f"Height {bin_idx}", points)

chart.render_to_png(f"plot-{THEME}.png")
with open(f"plot-{THEME}.html", "wb") as f:
    f.write(chart.render())
Runnable source as JSON, for any HTTP client: https://api.anyplot.ai/specs/surface-basic/pygal/code. Any spec id and library id listed in llms-full.txt fit the same URL shape; every URL below is complete and callable.
{
  "spec_id": "surface-basic",
  "language": "python",
  "library": "pygal",
  "page": "https://anyplot.ai/surface-basic/python/pygal",
  "hub": "https://anyplot.ai/surface-basic",
  "code_json": "https://api.anyplot.ai/specs/surface-basic/pygal/code",
  "spec_json": "https://api.anyplot.ai/specs/surface-basic",
  "render_light_png": "https://storage.googleapis.com/anyplot-images/plots/surface-basic/python/pygal/plot-light.png",
  "render_dark_png": "https://storage.googleapis.com/anyplot-images/plots/surface-basic/python/pygal/plot-dark.png",
  "interactive_light_html": "https://storage.googleapis.com/anyplot-images/plots/surface-basic/python/pygal/plot-light.html",
  "interactive_dark_html": "https://storage.googleapis.com/anyplot-images/plots/surface-basic/python/pygal/plot-dark.html",
  "quality_score": 74.0,
  "license": "MIT",
  "guide": "https://anyplot.ai/llms.txt"
}
Part of Basic 3D Surface Plot on anyplot.ai.