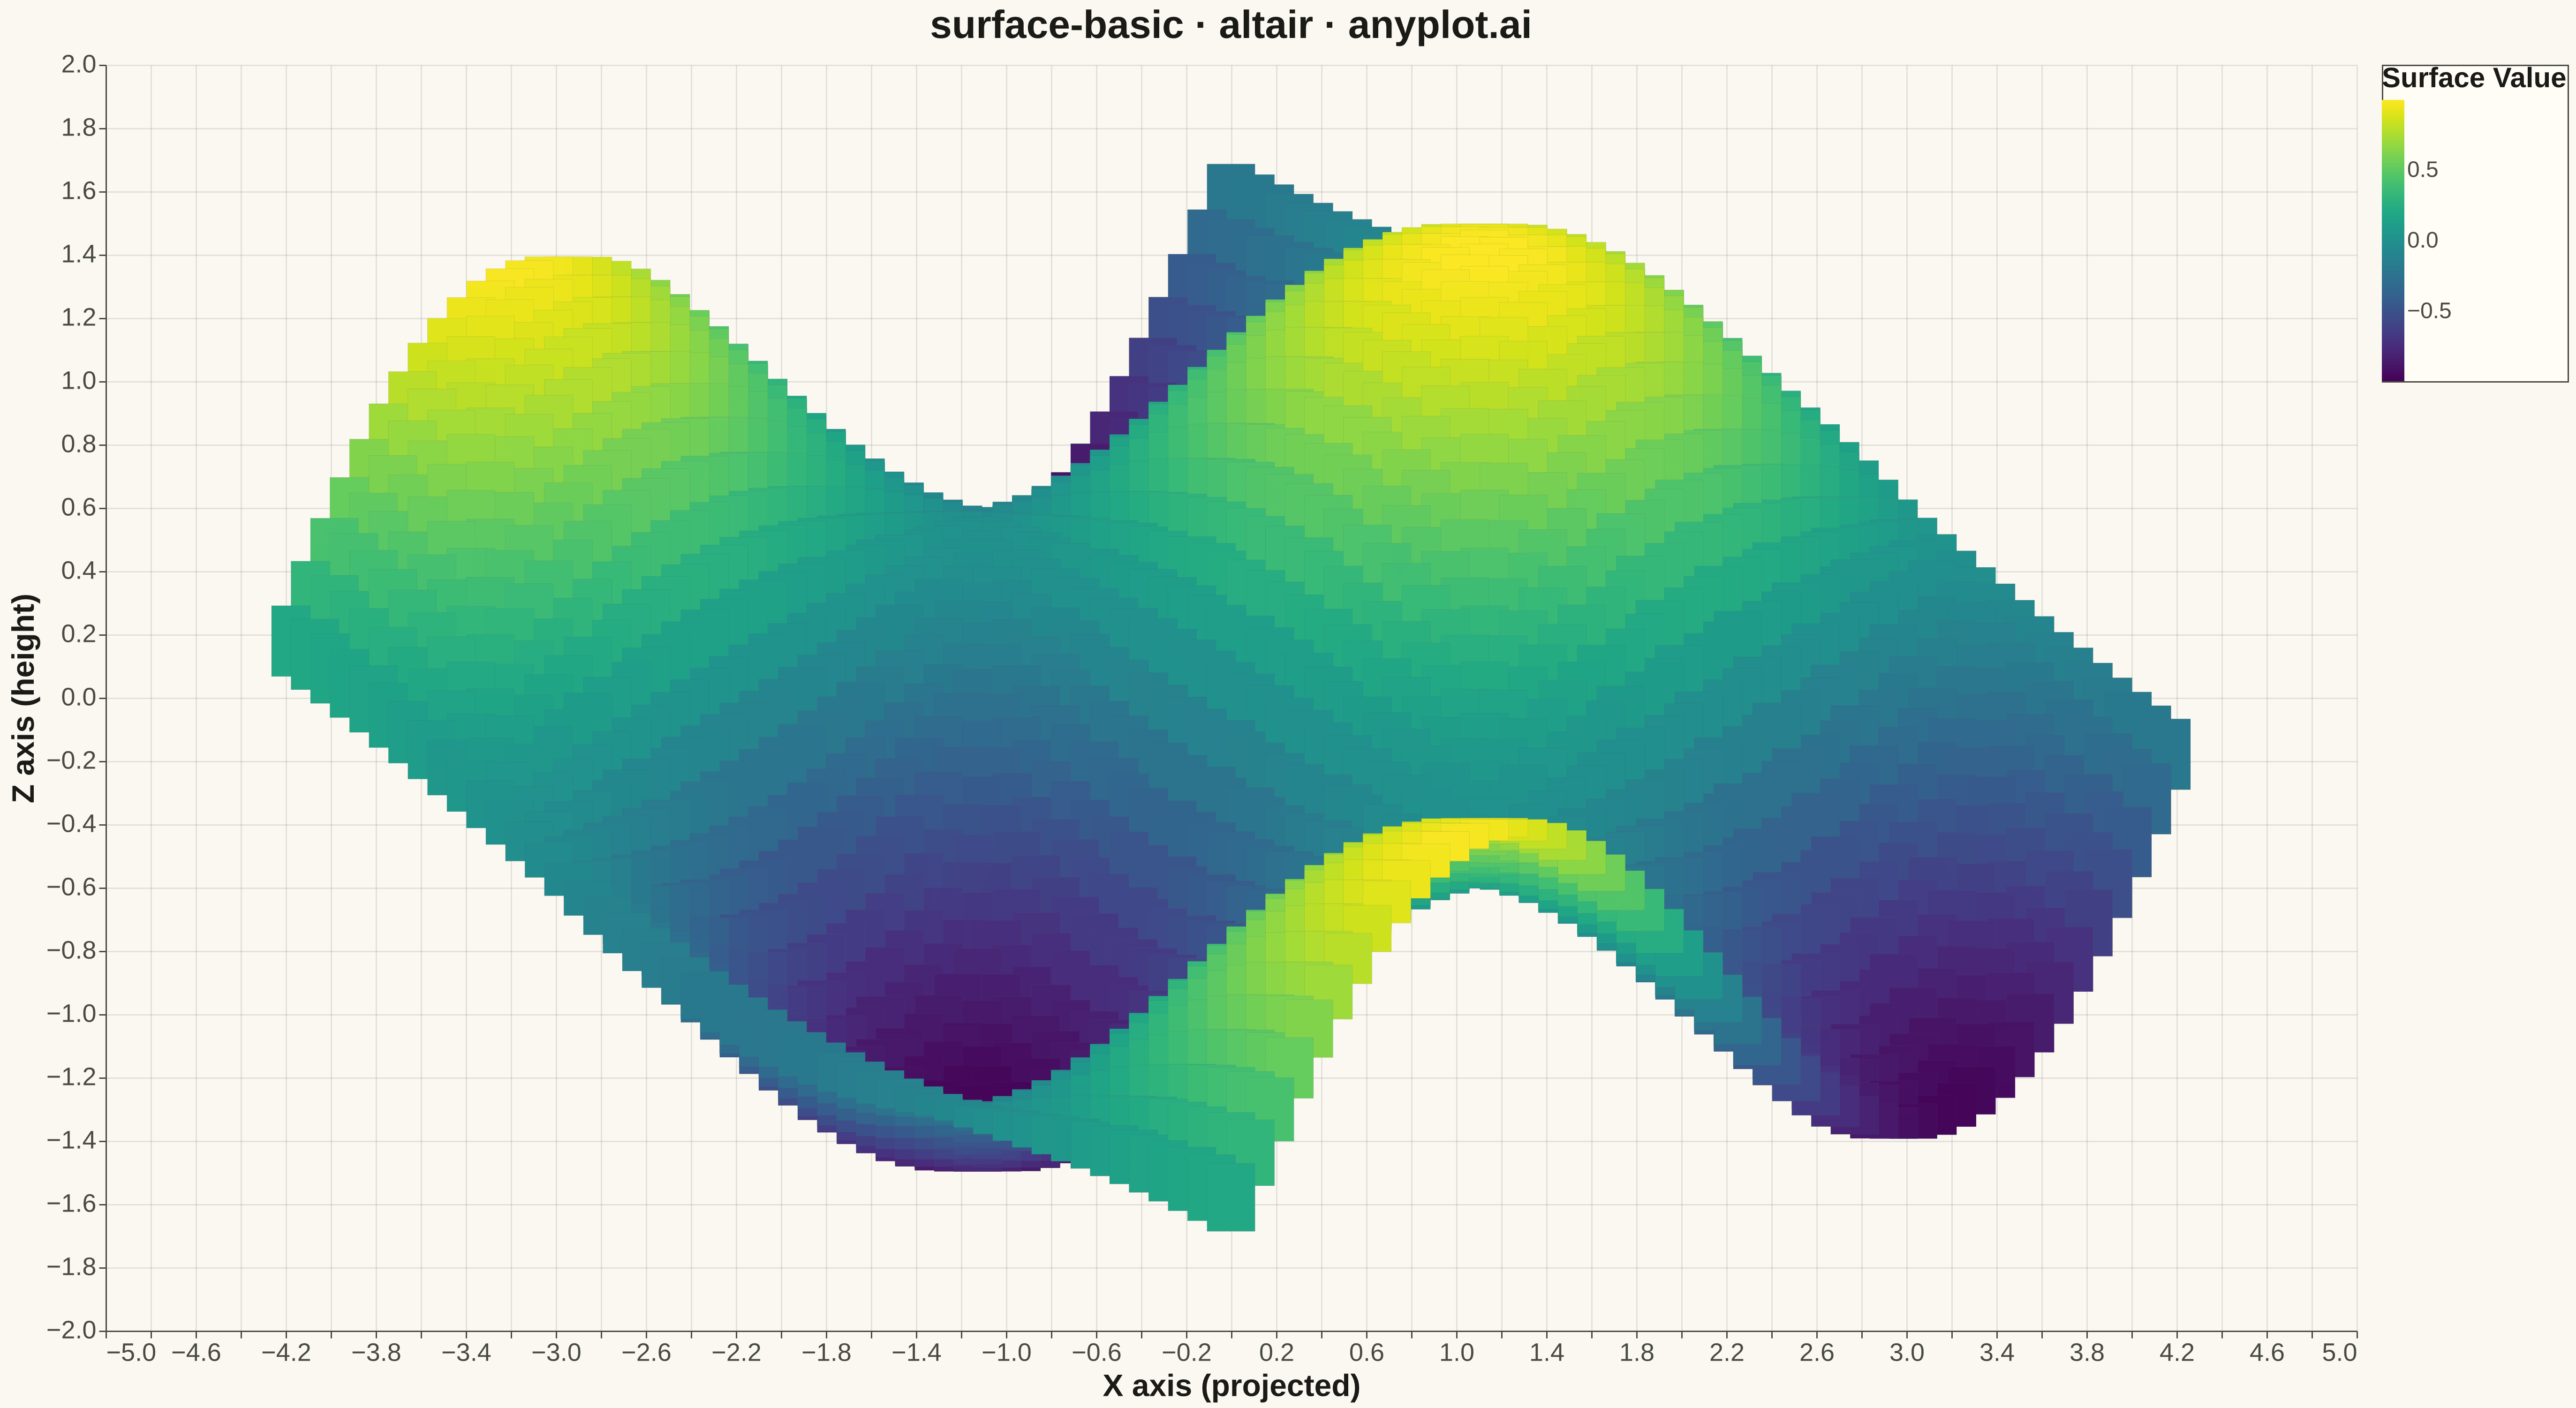
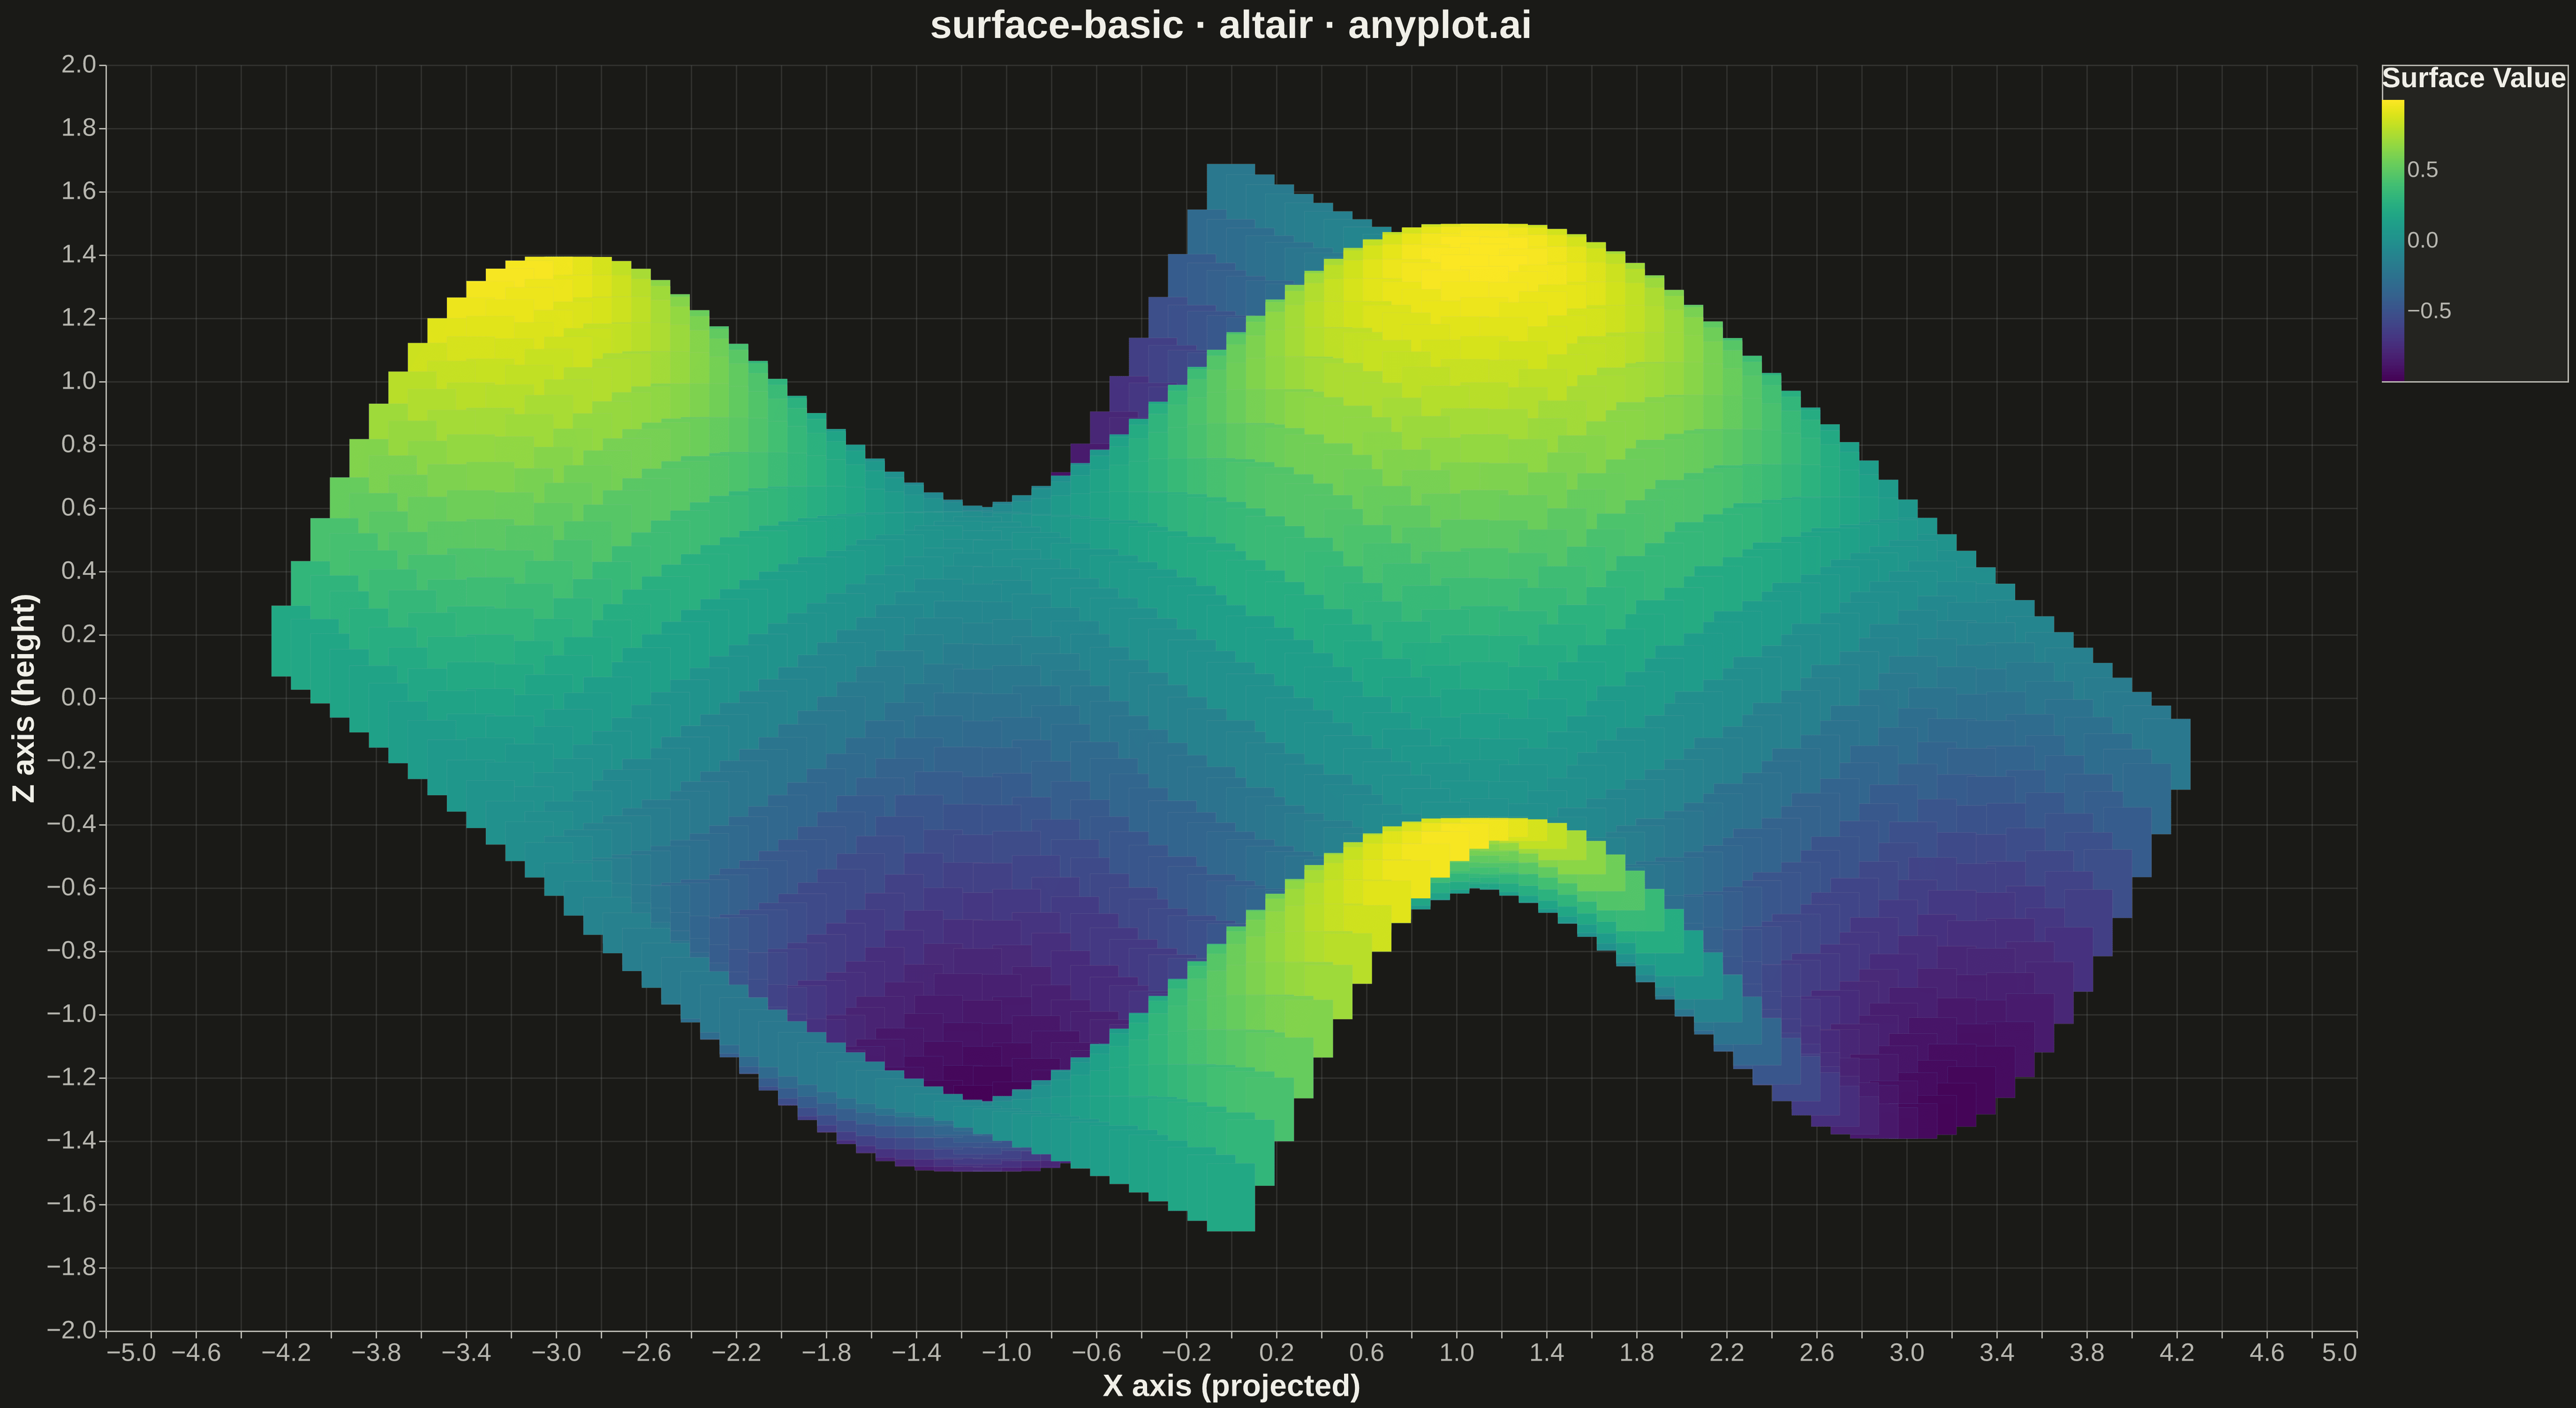
A 3D surface plot visualizes a function of two variables as a continuous surface in three-dimensional space. The height (z-axis) represents the function value at each (x, y) point, with color encoding the same information to enhance depth perception. This visualization is ideal for understanding mathematical functions, terrain data, and response surfaces where the relationship between two inputs and one output needs to be explored.
""" anyplot.ai
surface-basic: Basic 3D Surface Plot
Library: altair 6.1.0 | Python 3.13.13
Quality: 90/100 | Updated: 2026-05-05
"""

import os

import altair as alt
import numpy as np
import pandas as pd


# Theme tokens
THEME = os.getenv("ANYPLOT_THEME", "light")
PAGE_BG = "#FAF8F1" if THEME == "light" else "#1A1A17"
ELEVATED_BG = "#FFFDF6" if THEME == "light" else "#242420"
INK = "#1A1A17" if THEME == "light" else "#F0EFE8"
INK_SOFT = "#4A4A44" if THEME == "light" else "#B8B7B0"

# Data - create a smooth surface z = sin(x) * cos(y)
np.random.seed(42)

# Grid setup - 50x50 for smoother surface
n_points = 50
x = np.linspace(-3, 3, n_points)
y = np.linspace(-3, 3, n_points)
X, Y = np.meshgrid(x, y)

# Surface function
Z = np.sin(X) * np.cos(Y)

# 3D to 2D projection (elevation=25, azimuth=45)
elev_rad = np.radians(25)
azim_rad = np.radians(45)

# Rotation around z-axis (azimuth)
X_rot = X * np.cos(azim_rad) - Y * np.sin(azim_rad)
Y_rot = X * np.sin(azim_rad) + Y * np.cos(azim_rad)

# Rotation around x-axis (elevation) and project
X_proj = X_rot
Z_proj = Y_rot * np.sin(elev_rad) + Z * np.cos(elev_rad)

# Build facets with overlapping boundaries to reduce edge artifacts
rect_data = []
overlap = 0.02
for i in range(n_points - 1):
    for j in range(n_points - 1):
        # Get projected quad corners
        corners_x = [X_proj[i, j], X_proj[i, j + 1], X_proj[i + 1, j], X_proj[i + 1, j + 1]]
        corners_z = [Z_proj[i, j], Z_proj[i, j + 1], Z_proj[i + 1, j], Z_proj[i + 1, j + 1]]

        # Add slight overlap to reduce visual gaps
        x1 = min(corners_x) - overlap
        x2 = max(corners_x) + overlap
        y1 = min(corners_z) - overlap
        y2 = max(corners_z) + overlap

        # Average z for color (original Z, not projected)
        avg_z = (Z[i, j] + Z[i, j + 1] + Z[i + 1, j + 1] + Z[i + 1, j]) / 4

        # Depth for sorting (painter's algorithm - back to front)
        depth = (Y_rot[i, j] + Y_rot[i, j + 1] + Y_rot[i + 1, j + 1] + Y_rot[i + 1, j]) / 4

        rect_data.append({"x1": x1, "x2": x2, "y1": y1, "y2": y2, "z": avg_z, "depth": depth})

# Sort by depth (back to front)
rect_data.sort(key=lambda r: r["depth"], reverse=True)

# Assign order for rendering
for idx, r in enumerate(rect_data):
    r["order"] = idx

df_rects = pd.DataFrame(rect_data)

# Create surface chart with filled rectangles
surface = (
    alt.Chart(df_rects)
    .mark_rect(strokeWidth=0.3, stroke=INK_SOFT, strokeOpacity=0.15)
    .encode(
        x=alt.X(
            "x1:Q",
            axis=alt.Axis(
                title="X axis (projected)",
                labelFontSize=18,
                titleFontSize=22,
                labelColor=INK_SOFT,
                titleColor=INK,
                domainColor=INK_SOFT,
                tickColor=INK_SOFT,
                gridOpacity=0.10,
                gridColor=INK,
            ),
        ),
        y=alt.Y(
            "y1:Q",
            axis=alt.Axis(
                title="Z axis (height)",
                labelFontSize=18,
                titleFontSize=22,
                labelColor=INK_SOFT,
                titleColor=INK,
                domainColor=INK_SOFT,
                tickColor=INK_SOFT,
                gridOpacity=0.10,
                gridColor=INK,
            ),
        ),
        x2=alt.X2("x2:Q"),
        y2=alt.Y2("y2:Q"),
        color=alt.Color(
            "z:Q",
            scale=alt.Scale(scheme="viridis"),
            legend=alt.Legend(
                title="Surface Value",
                titleFontSize=20,
                labelFontSize=16,
                fillColor=ELEVATED_BG,
                strokeColor=INK_SOFT,
                labelColor=INK_SOFT,
                titleColor=INK,
            ),
        ),
        order=alt.Order("order:Q"),
        tooltip=[
            alt.Tooltip("z:Q", title="Surface value", format=".3f"),
            alt.Tooltip("x1:Q", title="X coordinate", format=".2f"),
            alt.Tooltip("y1:Q", title="Z coordinate", format=".2f"),
        ],
    )
)

# Add pan and zoom interactivity
pan_zoom = alt.selection_interval(bind="scales", encodings=["x", "y"])

# Combine into final chart with interactivity
chart = (
    surface.add_params(pan_zoom)
    .properties(
        width=1600,
        height=900,
        title=alt.Title("surface-basic · altair · anyplot.ai", fontSize=28, color=INK),
        background=PAGE_BG,
    )
    .configure_view(strokeWidth=0, fill=PAGE_BG)
    .configure_axis(grid=True, gridOpacity=0.10)
    .configure_title(color=INK)
)

# Save outputs
chart.save(f"plot-{THEME}.png", scale_factor=3.0)
chart.save(f"plot-{THEME}.html")
Runnable source as JSON, for any HTTP client: https://api.anyplot.ai/specs/surface-basic/altair/code. Any spec id and library id listed in llms-full.txt fit the same URL shape; every URL below is complete and callable.
{
  "spec_id": "surface-basic",
  "language": "python",
  "library": "altair",
  "page": "https://anyplot.ai/surface-basic/python/altair",
  "hub": "https://anyplot.ai/surface-basic",
  "code_json": "https://api.anyplot.ai/specs/surface-basic/altair/code",
  "spec_json": "https://api.anyplot.ai/specs/surface-basic",
  "render_light_png": "https://storage.googleapis.com/anyplot-images/plots/surface-basic/python/altair/plot-light.png",
  "render_dark_png": "https://storage.googleapis.com/anyplot-images/plots/surface-basic/python/altair/plot-dark.png",
  "interactive_light_html": "https://storage.googleapis.com/anyplot-images/plots/surface-basic/python/altair/plot-light.html",
  "interactive_dark_html": "https://storage.googleapis.com/anyplot-images/plots/surface-basic/python/altair/plot-dark.html",
  "quality_score": 90.0,
  "license": "MIT",
  "guide": "https://anyplot.ai/llms.txt"
}
Part of Basic 3D Surface Plot on anyplot.ai.